
Automated Segmentation of Cell Structure in Microscopy Images
Nicole Kerrison and Andy Bulpitt
School of Computing, University of Leeds, Woodhouse Lane, Leeds, LS2 9JT, U.K.
Keywords:
Segmentation, Lighting Correction, Cell Motility, Microscopy, Lamellipodia, DIC.
Abstract:
Understanding cell movement is important in helping to prevent and cure damage and disease. Increasingly,
this study is performed by obtaining video footage of cells in vitro. However, as the number of images
obtained for cellular analysis increases, so does the need for automated segmentation of these images, since
this is difficult and time consuming to perform manually. We propose to automate the process of segmenting
all parts of a cell visible in DIC microscopy video frames by providing an efficient method for correcting the
lighting bias and a novel combination of techniques to detect different cell areas and isolate parts of the cell
vital to their movement. To the best of our knowledge we contribute the only method able to automatically
detect the thin cellular membranes in DIC images. We show that the method can be used to isolate features in
order to detect variations vital to motility in differently affected cells.
1 INTRODUCTION
The study of cells is a key field in modern science in
order to help understand biological processes. Cur-
rently, much of the analysis is conducted by hand but
this can be time consuming and subject to human er-
ror. Automating this work would allow greater ac-
curacy, with reproducible results at a higher speed.
Automation would additionally allow for quantitative
analysis of the data, rather than just qualitative.
The movement of cells is vital to many biolog-
ical processes, as cells can move to infected areas or
wounds which need healing, and abnormal cell move-
ments can lead to disease and defects. In order to pre-
vent and cure disease we need to be able to understand
how cells migrate and morph, and to be able to mea-
sure their movement and change in shape (Dormann
and Weijer, 2006; Zimmer et al., 2006).
This is particularly important in ameoboid cells,
such as the myoblast cell, in which movement on sub-
strate is achieved through a crawling motion. The cell
extends large, but very thin protrusions called lamel-
lipodia which stretch out and adhere to the substrate,
providing anchor points for the cell to be pulled for-
ward (Becker et al., 2000; Karp, 2010; Middleton and
Sharp, 1984).
Biologists have taken videos of moving cells us-
ing time-lapse DIC (differential interference contrast)
microscopy, in which the light beam is split with part
passed through the cell and the difference calculated
to give a representation of the thickness of the cell,
discussed further in Section 1.1. Due to the nature
of DIC imaging, the thinly spread membranes of the
lamellipodia are often barely visible, with the texture
appearing the same as the background.
Researchers in cell motility wish to obtain infor-
mation about the cells and their movement, both in
unaffected (wildtype) cells, and in those in which
genes have been affected (knocked down or over ex-
pressed) or chemicals added. One particular chemi-
cal, blebbistatin, is an inhibitor which has been found
to affect the cells contractile forces and has an affect
on the lamellipodia and the cells’ motility (Limouze
et al., 2004; Straight et al., 2003; Kolega, 2006). Re-
searchers wish to know if brenk also has a similar
affect on the lamellipodia, and therefore the cells’
movement.
To find out more about the lamellipodia they need
to be segmented separately from the cell in order to
calculate information about their size and shape, and
how these change over time. This work aims to seg-
ment not only the cell but also divide it into its compo-
nent parts to enable this information to be calculated.
This is done in a fully automated manner, in which
a video can be analysed with no need for manual se-
lection or segmentation, and no necessity for manual
adjustment of parameters. We firstly present results
confirming our general segmentation method works
against a variety of DIC cell images, then focus on
the particular application of lamellipodia segmenta-
98
Kerrison N. and Bulpitt A..
Automated Segmentation of Cell Structure in Microscopy Images.
DOI: 10.5220/0004659800980105
In Proceedings of the 9th International Conference on Computer Vision Theory and Applications (VISAPP-2014), pages 98-105
ISBN: 978-989-758-009-3
Copyright
c
2014 SCITEPRESS (Science and Technology Publications, Lda.)

tion within the biological domain.
1.1 DIC Microscopy
There have been many advances in light microscopy
over the years, particularly the discovery of Green
Fluorescent Protein (GFP) which fluoresces under
blue light. As such it can be used to tag proteins
or genes, enabling the detection and localisation of
their expression (Tsien, 1998). However, the illumi-
nation can cause cell damage which affects both the
movement and lifespan of a cell (Stephens and Allan,
2003).
Using transmitted light for imaging live cells can
provide additional information and detail relating to
the cell shape. One such method is phase contrast
microscopy, which can outline the cells and highlight
some organelles. This, however, surrounds the im-
aged cell by a bright halo making it difficult to iden-
tify distinct edges (Lane and Stebbings, 2006).
Another method is DIC microscopy, in which a
beam splitter is applied to the light and half passed
through the cell. By measuring the difference in the
lengths of the optical paths the thickness of the cell
can be estimated (Murphy, 2001). The resulting im-
age appears as three-dimensional, and high contrast
images can be created showing more detail than previ-
ous methods. This is particularly useful for transpar-
ent objects, which would normally be difficult to see
without staining (Salmon and Tran, 2007; Schwartz
et al., 2003).
Although the method of obtaining DIC images can
provide many advantages, it can also cause problems
when the images are to be processed. The images
appear to be illuminated by a highly oblique light
source, which creates a shadow and light 3D effect,
but this also causes a large variation in the brightness
of the background (Schwartz et al., 2003; Kuijper and
Heise, 2008) and the object being studied, which can
be seen in Figures 2(a) and 2(b).
2 RELATED WORK
When studying normal and abnormal cell movement
it is not only important to find the location of the
cell, but to segment it in such a way that the size
and shape of the cell can also be recorded for anal-
ysis. Although a lot of previous work on cells has
involved counting or tracking the cells, far less has
been produced on shape analysis. Pincus and The-
riot compared methods for cell shape analysis by in-
vestigating methods which provided interpretable and
accurate numerical representations of the cell shape
(Pincus and Theriot, 2007). They found that principal
component analysis was the method which can most
accurately capture modes of shape variation, and this
has been very successful on keratocyte cells, which
can be modelled with only a few modes of shape vari-
ability (Keren et al., 2008). However, this approach
is not suitable for amorphous structures such as my-
oblast cells where the features cannot be aligned.
Much of the previous work on cell shape analy-
sis has involved manual segmentation, which is very
time consuming. Wu et al. used a two step procedure
to reduce this cost, by manually selecting each region
of an image which contained a cell (Wu et al., 1995).
They found that this reduced the variation in inten-
sity levels which occurs across images and allowed
for local thresholding. Further work to automate the
process of segmentation has often been for the pur-
poses of cell counting or tracking, in which obtaining
the cell boundary is not necessary. Jiang et al. used
SIFT to compare key-points and track cells in DIC
videos, without the necessity to find cell boundaries
(Jiang et al., 2010). Bise et al. also looked at tracking
and intentionally excluded portions of the cells from
the segmentation, such as the long thin parts which
deform significantly as these can confuse the tracking
(Bise et al., 2009).
Level sets have used to automate segmentation.
This was found to be successful on cells which
showed symmetry and did not contain too many vis-
ible sub-structures (Kuijper and Heise, 2008). Young
and Gray also relied on similarly shaped elliptical
cells applying a curvature constraint and segmenting
cells using edge contours (Young and Gray, 1996).
Segmentation of complex shaped cells was investi-
gated by Simon et al. but the method was found to
be unsuitable for images with a large background to
cell ratio, and for cells with a thin membrane (Simon
et al., 1998), such as ours. These cells (with poor in-
tensity contrast) were excluded from the analysis.
Li and Kanade developed a method for precondi-
tioning DIC images to assist with segmentation, but
when tested on our images the areas of most contrast
appear as if affected by a very bright “shadow” which
distorts the cell shape and there is no increase in the
definition of the thinner, less obvious parts of the cell
(Li and Kanade, 2009), as can be seen in Figure 1(a).
ImageJ (Abramoff et al., 2004) is an imaging program
which provides a method (pseudo-flat-field) for inten-
sity correction of images. When tested on our images
using a smaller filter this produced a “glow” around
the cell and slight blurring, as well as a small amount
of “shadow” in one corner. As the size of the filter
was increased, so did the area of shadow. The result
of using the default size is shown in Figure 1(b).
AutomatedSegmentationofCellStructureinMicroscopyImages
99
(a) Original (b) With
colour
(c) Blurred
background
(d) Corrected (e) Corrected
with colour
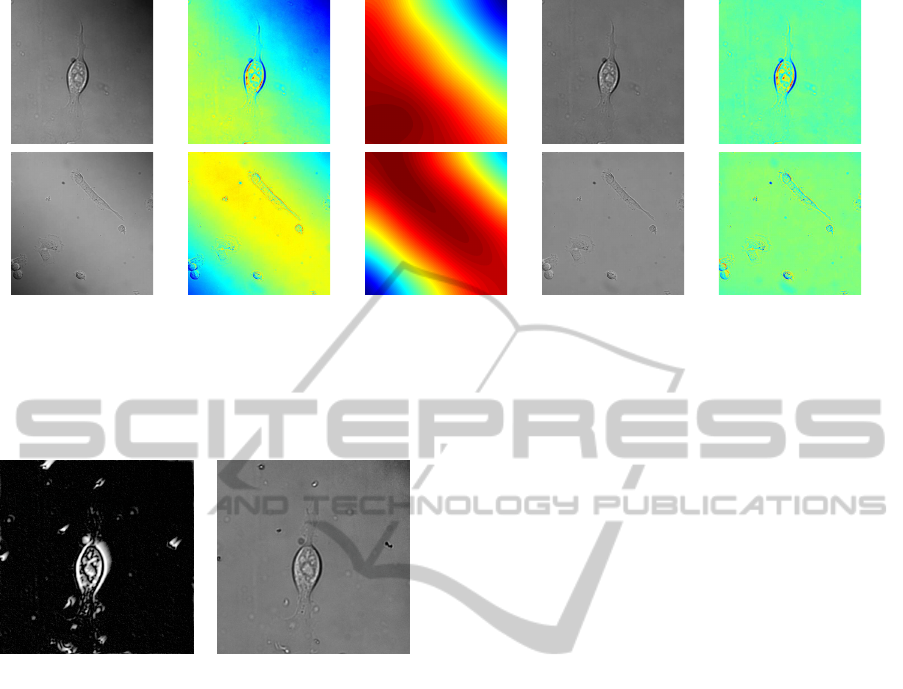
Figure 2: Correcting for DIC shadow effect.
The first column shows the original frames and the second shows these with colour applied, to make the lighting variation
more visible. The middle column shows the brightness of pixels over the background when the cell is blurred out. The final
two columns show the resulting images, with the shadow effect corrected.
(a) Preconditioned Image (b) ImageJ
Pseudo-Flatfield
Figure 1: Alternative methods to account for lighting varia-
tions.
The first image shows the result of preconditioning the im-
age using the method from (Li and Kanade, 2009). The
second image uses ImageJ (Abramoff et al., 2004) to cor-
rect the intensity but using a filter large enough not to affect
the cell results in a darker area still visible in the top right
of the image.
3 LIGHTING CORRECTION
DIC imaging causes lighting variations across the
frame, as can be seen in Figure 2(a). Two example
frames are shown, with the lighting and shadow ap-
pearing differently in both. The top image appears
to be lit from the bottom left, with shadow appear-
ing in the top right, and the bottom image appears to
be lit from roughly the middle with shadow appear-
ing in two corners, Figure 2(a). A colour map has
been added to the images, as in Figure 2(b), to make
the light variations more visible to the eye. The light-
ing variations occur smoothly across the whole image,
and affect the cells as well as the background.
Using a Gaussian blur, the cell detail can be re-
moved, shown in Figure 2(c). The intensity differ-
ences between the original and the blurred image are
stored for every pixel, which allows us to obtain the
detail of the cell and other objects in the image, with-
out need to model the background. The background
is then set to the mean of the image intensity of the
frame. The stored values are then re-added to the ad-
justed image to show the cell and other information
with no loss of detail, as seen in Figure 2(d), and again
in 2(e) with added colour to make the lack of variation
more apparent. This is repeated for each frame in the
video.
The pixel values were calculated across the diag-
onal with the greatest variation in intensity (e.g. bot-
tom left to top right in the examples shown in Figure
2) before and after the background lighting variation
was corrected. It can be seen from Figure 3 that this
efficient method creates a uniform background level
across the frames.
This was also tested on images from an internet
search and was demonstrated to be equally effective
on all DIC images tested, including those where the
cells took up the majority of the frame. Some exam-
ple results are shown in Figure 3. The first two rows
are the images from Figure 2, the third is an online
image of HeLa cells, in which there is very little back-
ground, and the fourth is an online image of a C. Ele-
gans worm tail. The original images all show a varia-
tion in background lighting as well as the detail of the
object being examined, as can be seen in Figure 3(a).
The uneven background without the detail (after the
Gaussian blur) is shown in 3(b). The corrected images
all show a more even background illumination with-
out loss of detail of the cell or worm, as seen in Figure
VISAPP2014-InternationalConferenceonComputerVisionTheoryandApplications
100
0 100 200 300 400 500 600
0
0.1
0.2
0.3
0.4
0.5
0.6
0.7
0.8
0 100 200 300 400 500 600
0
0.1
0.2
0.3
0.4
0.5
0.6
0.7
0.8
0 100 200 300 400 500 600
0
0.1
0.2
0.3
0.4
0.5
0.6
0.7
0.8
0 100 200 300 400 500 600
0
0.1
0.2
0.3
0.4
0.5
0.6
0.7
0.8
0 100 200 300 400 500 600
0
0.1
0.2
0.3
0.4
0.5
0.6
0.7
0.8
0 100 200 300 400 500 600
0
0.1
0.2
0.3
0.4
0.5
0.6
0.7
0.8
0 100 200 300 400 500 600 700
0
0.05
0.1
0.15
0.2
0.25
0.3
0.35
0.4
0.45
0.5
0 100 200 300 400 500 600 700
0
0.05
0.1
0.15
0.2
0.25
0.3
0.35
0.4
0.45
0.5
0 100 200 300 400 500 600 700
0
0.05
0.1
0.15
0.2
0.25
0.3
0.35
0.4
0.45
0.5
0 50 100 150 200 250 300
0
0.1
0.2
0.3
0.4
0.5
0.6
0.7
0.8
0.9
1
0 50 100 150 200 250 300
0
0.1
0.2
0.3
0.4
0.5
0.6
0.7
0.8
0.9
1
0 50 100 150 200 250 300
0
0.1
0.2
0.3
0.4
0.5
0.6
0.7
0.8
0.9
1
(a) Original
Image
(b) After
Gaussian
Blur
(c) Corrected
Image
Figure 3: Pixel values before and after correction.
The pixel values were recorded along the diagonal with the
most lighting variation before and after lighting correction.
The first two images are those shown in Figure 2 and the
second two were found using an online image search. All
show a more even background without loss of information
of the cell or worm.
3(c). This is successful even with only small amounts
of background visible as the lighting variations occur
not only over the background but also across the cells.
Although other there are other methods for correcting
lighting, this efficient method proved suitable for all
DIC images tested.
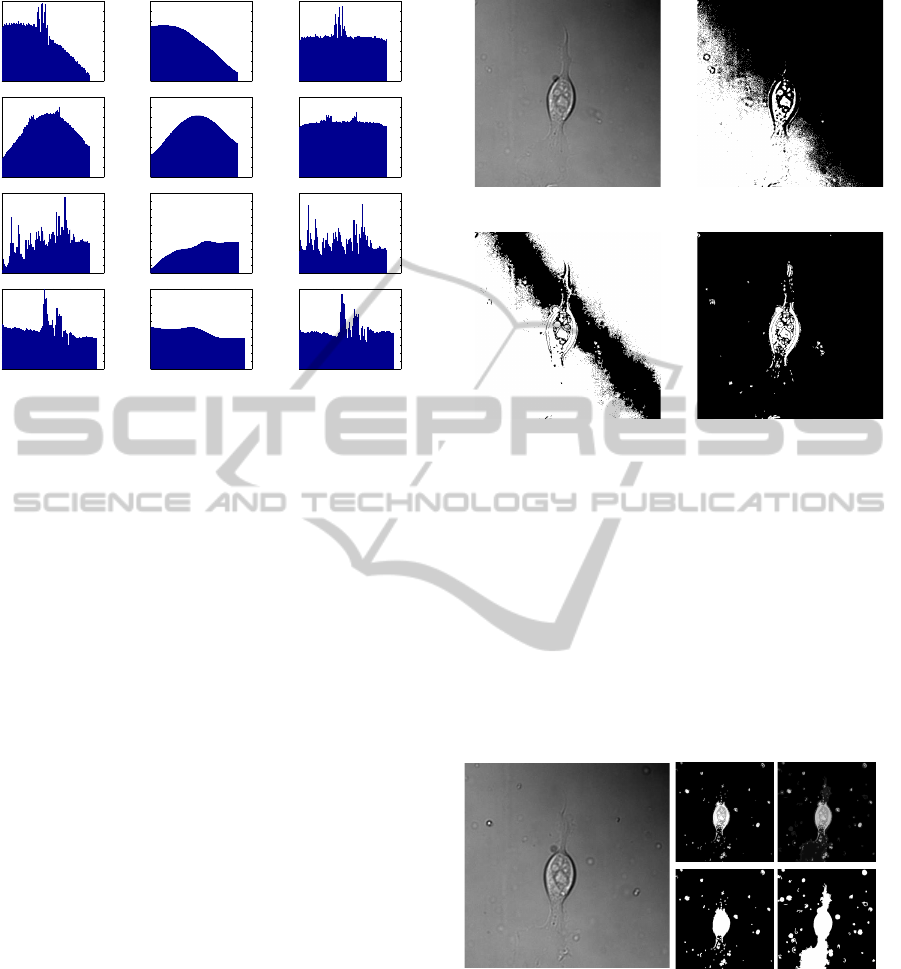
4 THRESHOLDING AND EDGE
DETECTION
Due to the lighting variations in DIC images, thresh-
olding based on brightness is not normally possible,
as can be seen Figures 4(b) and 4(c). Our lighting
adjustment method not only corrects the background
visually, but also provides the mean to which the
background is adjusted on which thresholding can be
based. The image seen in Figure 4(d) shows in white
those pixels in the light-corrected image that are more
than 10% brighter or darker than the mean value, with
those that are nearest to the mean being set to black
as background.
The brightest and darkest areas of the image such
as the main body of the cell can be detected using
thresholding. In most cases, cell videos are taken of
one particular type of cell, and as such the main bod-
ies are of reasonably similar sizes. This stage allows
(a) Original (b) Threshold
at 50%
(c) Threshold
around mean
(d) Threshold after
lighting correction
Figure 4: Thresholding DIC images.
Prior to lighting correction, it is not possible to segment DIC
images using thresholding alone as the differences in the
background cover the same intensities as the cell. The final
image shows that the main parts of the cell can be easily
thresholded after the lighting adjustment.
us to calculate the size and provides information for
removing non-cellular material from the frame. Al-
though this thresholding finds the main body of the
cell, the fainter lamellipodium still needs to be seg-
mented.
(a) Original (b)
Threshold
(c)
Combined
Figure 5: Combined results.
It can be seen that thresholding alone cannot detect large
area of the lamellipodia at the bottom, but when combined
with edge detection the full cell is detected. The images are
also shown in binary beneath the results to aid viewing.
Taking F(t) as a light corrected frame at time t,
we apply a Canny Edge detection generating a set of
edges E(t). We only keep the subset of edges e ⊆ E(t)
which are connected to the “on” pixels in the thresh-
olded image F(t), as shown in Figure 5(c). The top
AutomatedSegmentationofCellStructureinMicroscopyImages
101

images are shown in greyscale, and the lower images
are shown in binary with all non-zero pixels shown as
white for clarity.
The resulting image is then filled, smoothed and
the small non-cellular areas are removed, proportional
to the body size calculated in the thresholding step.
The result is a binary image in which the white areas
are the cell and the black are the background. This
white shape can be applied to the original image as
a template to provide the boundary of the cell and to
segment it from the background. We denote this cell
segmentation at time t as C(t).
(a) Outline of
one cell
(b) Outline of
two cells
(c) Outline of
many cells
Figure 6: Outline of cells from the template.
Using the template created from the combined thresholding
and edge detection method, the outline of the cells is traced
onto the original image. As can be seen, the detection is
very close to the actual edge, even when this is difficult to
detect by eye. The bottom row of images have had the back-
ground manually adjusted so the outline of the cells can be
seen.
The resulting segmentation is very close to the cell
boundary (Figure 6), even where it is difficult to de-
tect by eye. Manually adjusted images have been cre-
ated to show the cells with a paler background to as-
sist in visualisation. Additionally, it is shown to work
on varying sizes of cells and with different degrees of
background coverage. Tables 1 and 2 show the accu-
racy of the results which are discussed in section 7.1.
5 ITERATIVE CORRECTION
The resulting segmentation for the thresholding and
edge detection method was very close to the man-
ual segmentation for most frames (which will be dis-
cussed in Section 7.1), but in some frames the lamel-
lipodia were not entirely detected, an example of
which can be seen in Figure 7(a). In these cases it
was often also extremely difficult or even impossible
to detect these areas by eye in the individual frame,
but the location could be inferred from the movement
in the surrounding frames. To detect these cases (of
incomplete segmentation) the cell size was compared
over consecutive frames, with those frames showing a
significant increase or decrease being the most likely
to not be entirely segmented.
We denote a cell segmentation at time t as C(t).
At each time-step, we compare the area of C(t) with
that of C(t − 1). If the area has changed by at least
10%, we take the intersection of C(t − 1) and C(t +1)
to generate the basis of a new segmentation image,
ˆ
C(t). As stated in section 4, we have a set of edges
E(t) generated from F(t). We now keep those edges
ˆe ⊆ E(t) that are connected to
ˆ
C(t). We replace each
segmentation C(t) with the new version
ˆ
C(t) + ˆe.
The entire process is then repeated over the entire
video using the updated frames. This is run iteratively
until such a time as no two consecutive frames have
an area difference of greater than 10%, or until the
method is creating no further changes, which is de-
tected by comparing the list of sizes in consecutive
runs.
The advantage of this iterative framework be-
comes evident where we have two or more consecu-
tive erroneous segmentations. Take as an example the
situation where C(t) and C(t + 1) are incorrect; when
taking the intersection of C(t − 1) and C(t + 1), we
still obtain an incomplete representation of the cell.
As such the initial pass of the method will not create
a full segmentation throughout the video. However,
if we repeat the full process as described above, seg-
mentation improves at each pass until we converge on
a more complete solution.
The resulting segmentation shows an improve-
ment on the previous results, as shown in Figure 7(b),
when compared with manually segmented cells (Ta-
bles 1 and 2).
6 SEGMENTATION OF
LAMELLIPODIA
As previously discussed (Section 1), it is important
to not only be able to segment the cell, but also to
identify the component parts. As the size and spread
of lamellipodia is vital to the cells movement, being
able to calculate this can assist in learning about the
cell’s motility.
VISAPP2014-InternationalConferenceonComputerVisionTheoryandApplications
102
(a) Before Iterative
Correction
(b) After Iterative
Correction
Figure 7: Correcting the Segmentation.
In some frames the lamellipodia is not fully segmented, as
seen in (a). The previous and subsequent frames are used to
correct this, as shown in (b). In this instance, the boundary
from the segmentation is shown in yellow for clarity.
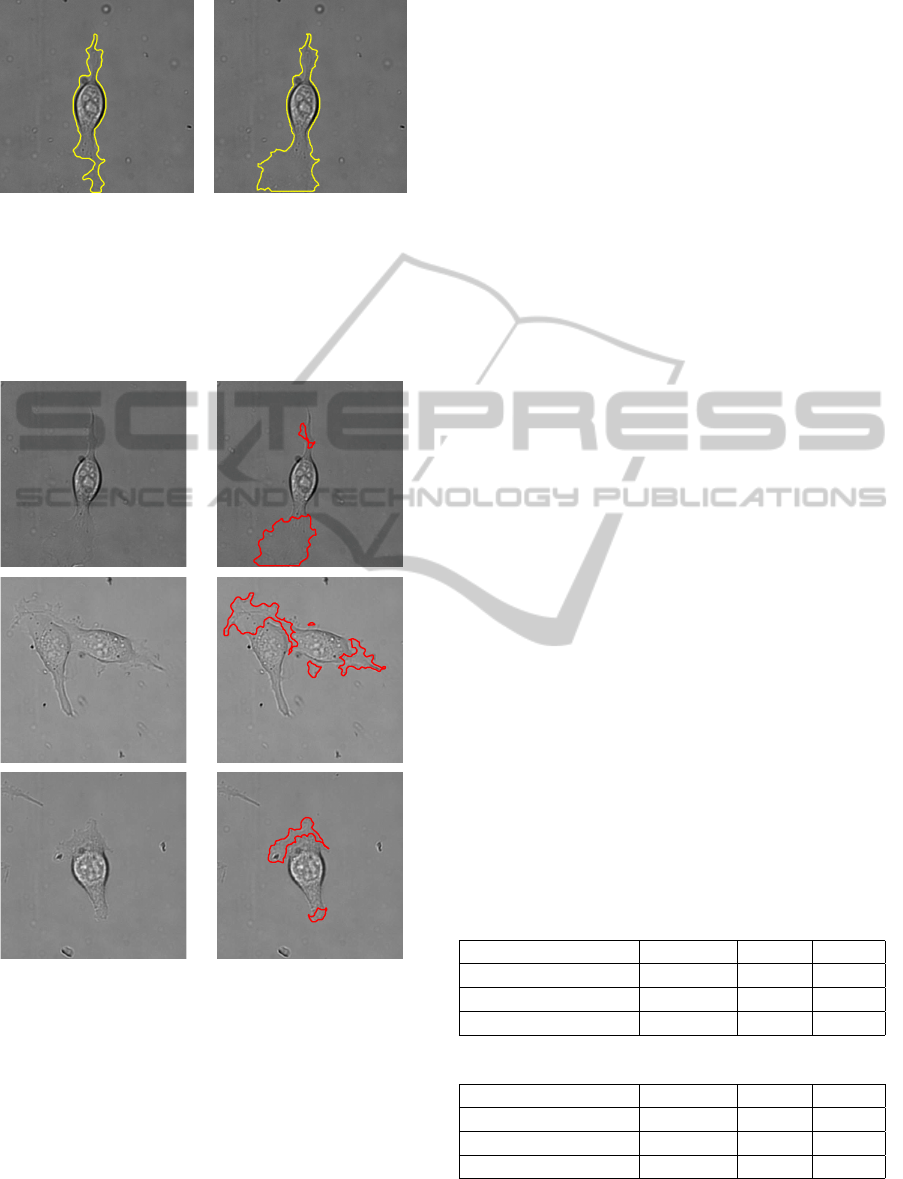
(a) Original (b) Lamellipodia
Figure 8: Cells segmented to show lamellipodia.
The first columns show the original images, the second
shows the segmented lamellipodia.
Figure 8 shows the lamellipodia being segmented
separately from the cell body. As our method uses
thresholding to find the main body of the cell this can
be removed from the final segmentation to leave only
the lamellipodia. From this, the size can be calculated
over time and the individual regions tracked to assist
in building a pattern of the growth.
The segmentation of the lamellipodia was applied
to three groups of videos; those containing wildtype
cells, those containing cells which had been affected
by blebbistatin and those cells which had been af-
fected by brenk. The size of the lamellipodia was cal-
culated for each frame, as the absolute size and as rel-
ative to the size of the cell body to account for larger
and smaller cells. This was used to assess the affect
of these chemicals on the cells, and the results are dis-
cussed in Section 7.2.
7 RESULTS
The lighting correction method for preconditioning
and the segmentation method were applied to all im-
ages from a variety of test sets with visually good re-
sults. The segmentation of the cell and the lamellipo-
dia were then tested against a subgroup of 26 videos
with the results for each shown below.
7.1 Results for Segmenting the Cell
Although the results for this system were obtained us-
ing a fully automated system, no other automated sys-
tem could be found for comparison of results that was
able to detect and segment the cells. The segmenta-
tion was instead compared to results using CellTrack
(Sacan et al., 2008) by manually adjusting the param-
eters of the CellTrack algorithms to obtain the closest
possible result to the cell boundary. The automated
segmentations, both before and after the iterative cor-
rection, and the CellTrack segmentations were com-
pared with manual segmentations using DICE (Table
1) and Jaccard (Table 2), which compare the over-
lap in segmentations. The average results are shown
over each of three groups of videos; wildtype cells,
those affected by the chemical blebbistatin and those
affected by brenk.
Table 1: Comparison Of DICE Results (% accuracy).
Wildtype Blebb. Brenk
Orig. Segmentation 89.75 86.64 89.33
After Correction 90.13 87.35 90.95
CellTrack 88.81 85.52 90.89
Table 2: Comparison Of Jaccard Results (% accuracy).
Wildtype Blebb. Brenk
Orig. Segmentation 82.25 77.43 81.56
After Correction 82.65 78.29 83.69
CellTrack 80.20 75.49 83.44
The initial segmentation provided a very good re-
sult. From 910 frames tested, only 37 (roughly 4%)
AutomatedSegmentationofCellStructureinMicroscopyImages
103

had small parts of the lamellipodia missing. It can
be seen that this still provides a better result than the
best method involving manual adjustment in all but
one case. After using the iterative correction method
the resulting segmentation was more accurate in every
case.
7.2 Results for Segmenting the
Lamellipodia
The segmentation of the lamellipodia was also tested
on wildtype cells, cells affected by blebbistatin and
cells affected by brenk. Researchers wished to know
if both the blebbistatin and the brenk had an effect
on the lamellipodia, which would in turn affect the
cells’ motility, and if this affect was similar for both of
them. Initially, the size was calculated for the lamel-
lipodia in every frame as well as the size of the cell
body.
It was found that the mean size-ratio was greater
for both the brenk and blebbistatin (with an overall
mean ratio of 0.40 and 0.39 respectively) compared
to the wildtype cells (with a mean ratio of 0.18), as
shown in Table 3. Whilst the mean size-ratio was
larger in blebbistatin and brenk than in wildtype, we
see comparatively more variation in wildtype size-
ratios, as evidenced by a standard deviation of more
than 0.24 relative to a mean of 0.18. Conversely,
the spread of blebbistatin and brenk is smaller than
the mean size-ratio in both cases. This could imply
that although the lamellipodia is larger in both cases
it does not have the same ability to change size by
contracting and expanding as would be the case with
wildtype cells.
Table 3: Size of Lamellipodia Comparative to Cell Body.
Mean Standard Deviation
Wildtype 0.1842 0.2448
Blebbistatin 0.4043 0.3337
Brenk 0.3923 0.3195
The size-ratios for every frame in each group of
videos were compared with the Kolmogorov-Smirnov
test against the null hypothesis that they were from
the same distribution. Both the blebbistatin and the
brenk were tested against the wildtype cells and in
both cases were shown not to be from the same distri-
bution (for wildtype and blebbistatin p < 2.5 × 10
−18
and for wildtype and brenk p < 8.5 × 10
−20
). The
blebbistatin and brenk when tested against each other,
however, were not from different distributions (p =
0.5227).
8 CONCLUSIONS AND FURTHER
WORK
We have proposed a method for segmenting cells in
DIC images, even when there is very little contrast
difference between the cell and the background. This
involves a fast lighting correction technique which
has proved successful on not only the cellular footage
currently being assessed, but also on DIC images
found online.
We provide a fully automated segmentation tech-
nique which can segment all parts of the cell including
the thin membrane. To correct the images where the
boundary does not fully encompass the lamellipodia
we use an iterative method to improve the segmenta-
tion based on the surrounding frames. This is a fully
automated system which provides a more accurate re-
sult than currently available tools which require man-
ual input.
The results show that the cell can be accurately
segmented, and the information gained in the process
can then be used to identify lamellipodia separately.
This allows us to obtain further information about the
size of the components affecting the cells’ movement.
We have shown that when affected by brenk or bleb-
bistatin the lamellipodia in cells grow differently to
the lamellipodia in wildtype cells, and that overall the
size is similar.
REFERENCES
Abramoff, M. D., Magelhaes, P. J., and Ram, S. J. (2004).
Image processing with ImageJ. Biophotonics Int,
11(7):36–42.
Becker, W., Kleinsmith, L., and Hardin, J. (2000). The
world of the cell. Benjamin/Cummings series in the
life sciences. Benjamin Cummings.
Bise, R., Li, K., Eom, S., and Kanade, T. (2009). Reli-
ably tracking partially overlapping neural stem cells in
dic microscopy image sequences. In MICCAI Work-
shop on Optical Tissue Image Analysis in Microscopy,
Histopathology and Endoscopy (OPTMHisE), pages
67–77.
Dormann, D. and Weijer, C. J. (2006). Review: Imaging Of
Cell Migration. European Molecular Biology Organi-
zation Journal, 25(15):3480 – 3493.
Jiang, R., Crookes, D., Luo, N., and Davidson, M. (2010).
Live-Cell Tracking Using SIFT Features in DIC Mi-
croscopic Videos. Biomedical Engineering, IEEE
Transactions on, 57(9):2219–2228.
Karp, G. (2010). Cell Biology. John Wiley and Sons, Asia,
sixth edition.
Keren, K., Pincus, Z., Allen, G., Barnhart, E., Marriott,
G., Mogilner, A., and Theriot, J. (2008). Mecha-
VISAPP2014-InternationalConferenceonComputerVisionTheoryandApplications
104

nism of shape determination in motile cells. Nature,
453(7194):475–480.
Kolega, J. (2006). The Role of Myosin II Motor Activity
in Distributing Myosin Asymmetrically and Coupling
Protrusive Activity to Cell Translocation. Molecular
Biology of the Cell, 17(10):4435–4445.
Kuijper, A. and Heise, B. (2008). An automatic cell seg-
mentation method for differential interference contrast
microscopy. In ICPR 2008. 19th International Confer-
ence on Pattern Recognition, pages 1–4. IEEE.
Lane, J. D. and Stebbings, H. (2006). Transmitted light
imaging. In Stephens, D., editor, Cell Imaging, Meth-
ods Express. Scion, Bloxham, Oxfordshire.
Li, K. and Kanade, T. (2009). Nonnegative mixed-norm
preconditioning for microscopy image segmentation.
In Proceedings of the 21st Biennial International Con-
ference on Information Processing in Medical Imag-
ing (IPMI), pages 362–373.
Limouze, J., Straight, A. F., Mitchison, T., and Sellers,
J. R. (2004). Specificity of blebbistatin, an inhibitor of
myosin II. Journal of muscle research and cell motil-
ity, 25(4-5):337–341.
Middleton, C. and Sharp, J. (1984). Cell Locomotion in
Vitro: Techniques and Observations. Croom Helm
Ltd, Kent.
Murphy, D. B. (2001). Fundamentals of Light Microscopy
and Electronic Imaging, chapter Differential Inter-
ference Contrast (DIC) Microscopy and Modulation
Contrast Microscopy, pages 153 – 172. Wiley-Liss,
New York, New York.
Pincus, Z. and Theriot, J. A. (2007). Comparison of quan-
titative methods for cell-shape analysis. Journal of
Microscopy, 227(2):140–156.
Sacan, A., Ferhatosmanoglu, H., and Coskun, H. (2008).
Celltrack: an open-source software for cell track-
ing and motility analysis. Bioinformatics, (14):1647–
1649.
Salmon, E. D. and Tran, P. (2007). High-Resolution Video-
Enhanced Differential Interference Contrast Light Mi-
croscopy. In Sluder, G. and Wolf, D. E., editors, Dig-
ital Microscopy, volume 81 of Methods in Cell Biol-
ogy, pages 335 – 363. Academic Press, San Diego,
California, third edition.
Schwartz, S., Murphy, D., Spring, K., and Davidson, M.
(2003). de s
´
enarmont bias retardation in dic mi-
croscopy. http://www.microscopyu.com/pdfs/
DICMicroscopy.pdf. Nikon MicroscopyU.
Simon, I., Pound, C. R., Partin, A. W., Clemens, J. Q.,
and Christens-Barry, W. A. (1998). Automated im-
age analysis system for detecting boundaries of live
prostate cancer cells. Cytometry, 31(4):287–294.
Stephens, D. J. and Allan, V. J. (2003). Light Microscopy
Techniques for Live Cell Imaging. Science, 300:82 –
86.
Straight, A. F., Cheung, A., Limouze, J., Chen, I., West-
wood, N. J., Sellers, J. R., and Mitchison, T. J.
(2003). Dissecting Temporal and Spatial Control
of Cytokinesis with a Myosin II Inhibitor. Science,
299(5613):1743–1747.
Tsien, R. Y. (1998). The Green Fluorescent Protein. Annual
Review of Biochemistry, 67:509 – 44.
Wu, K., Gauthier, D., and Levine, M. D. (1995). Live cell
image segmentation. Biomedical Engineering, IEEE
Transactions on, 42(1):1–12.
Young, D. and Gray, A. J. (1996). Cell identification in
Differential Interference Contrast microscope images
using edge detection. pages 66.1–66.10. 7th British
Machine Vision Conference, BMVA Press.
Zimmer, C., Zhang, B., Dufour, A., Thebaud, A.,
Berlemont, S., Meas-Yedid, V., and Marin, J.-C.
(2006). On the digital trail of mobile cells. Signal
Processing Magazine, IEEE, 23(3):54 –62.
AutomatedSegmentationofCellStructureinMicroscopyImages
105
