
Online Brain Tissue Classification in Multiple Sclerosis
using a Scanner-integrated Image Analysis Pipeline
Refaat E. Gabr
1
, Amol Pednekar
2
, Xiaojun Sun
1
and Ponnada A. Narayana
1
1
Department of Diagnostic and Interventional Imaging, University of Texas Health Science Center at Houston,
Houston, TX, U.S.A.
2
Philips Healthcare, Cleveland, OH, U.S.A.
Keywords: Multiple Sclerosis, White Mater Lesions, Segmentation, Online Processing.
Abstract: With recent advances in the field, magnetic resonance imaging (MRI) has become a powerful quantitative
imaging modality for the study of neurological disorders. The quantitative power of MRI is significantly
enhanced with multi-contrast and high-resolution techniques. However, those techniques generate large
volumes of data which, combined with the sophisticated state-of-the-art image analysis methods, result in a
very high computational load. In order to keep the scanner workflow uninterrupted, processing has to be
performed off-line leading to delayed access to the quantitative results. This time delay also precludes the
evaluation of data quality, and prevents the care giver from using the results of quantitative analysis to guide
subsequent studies. We developed a scanner-integrated system for fast online processing of dual-echo fast
spin-echo and fluid-attenuated inversion recovery images to quickly classify different brain tissues and
generate white matter lesion maps in patients with multiple sclerosis (MS). The segmented tissues were
imported back into the patient database on the scanner for clinical interpretation by the radiologist. The
analysis pipeline included rigid-body registration, skull stripping, nonuniformity correction, and tissue
segmentation. In six MS patients, the average time taken by the processing pipeline to the final
segmentation of the brain into white matter, grey matter, cerebrospinal fluid, and white matter lesions was
~2 min, making it feasible to generate lesion maps immediately after the scan.
1 INTRODUCTION
Multiple sclerosis (MS) is an inflammatory
demyelinating disease of the central nervous system.
MS affects 2-2.5 million people world-wide, and
primarily affects females and young adults between
20-50 years (Milo and Kahana, 2010). Although MS
is not considered a fatal disease, MS patients
struggle to lead productive lives. The annual health
care cost per patient is estimated to be around
$47,215, including the lost productivity (Kobelt et
al., 2006).
MRI is the most sensitive imaging modality for
MS, and is a key element in the diagnosis and
management of MS (Sahraian and Eshaghi, 2010).
Focal white matter (WM) inflammation, the
hallmark of MS, is detected on MRI as hypo-
intensity on T1-weighted MRI, as enhancing areas
following the injection of a contrast agent, or as
hyper-intensity on T2-weighted and fluid-attenuated
inversion recovery (FLAIR) MRI. MRI enables
assessing WM lesion load, which is an important
measure in monitoring disease progression (Popescu
et al., 2013; Fisniku et al., 2008; Caramanos et al.,
2012).
MS lesions can be segmented on MRI images
using fully automated techniques (e.g. (Sweeney et
al., 2013; Karimaghaloo et al., 2012) and (Datta and
Narayana, 2013)). However, image analysis consists
of multiple computationally intensive and time-
consuming operations, and the lesion map is
typically available only after the patient has left the
scanner area. The lack of fast quantitative analysis
prevents the technologist or physician from quickly
previewing the quantitative MRI metrics of the
disease or evaluating the data quality in the context
of the generated quantitative measures. Moreover,
the time delay precludes the prescription or the
optimization of the following scans that could
benefit from the availability of prior lesion
segmentation.
The image processing and analysis techniques
106
E. Gabr R., Pednekar A., Sun X. and A. Narayana P..
Online Brain Tissue Classification in Multiple Sclerosis using a Scanner-integrated Image Analysis Pipeline.
DOI: 10.5220/0004660301060110
In Proceedings of the 9th International Conference on Computer Vision Theory and Applications (VISAPP-2014), pages 106-110
ISBN: 978-989-758-009-3
Copyright
c
2014 SCITEPRESS (Science and Technology Publications, Lda.)
for detecting WM lesions in MS include the
following steps. First, all datasets are co-registered
using a suitable registration technique. Second, the
extra-meningeal tissues are removed (often called
skull stripping or brain extraction). Third, images are
corrected for intensity variations due to field
nonuniformity. Finally, image segmentation is used
to classify brain tissue into WM, grey matter (GM),
cerebrospinal fluid (CSF), and WM lesions. It is
worth noting that the order of some processing
operation may change and certain operations could
be combined together in order to make the analysis
robust against certain artefacts.
With the large number of voxels generated in
MRI, many of these processing operations are
computationally intensive and very time consuming,
and performing these operations on the scanner
computer could significantly affect the scanner’s
functionality. Consequently, image analysis is
typically performed off-line after the scan session.
We recognize a critical need for a framework that
can process MRI data in almost real-time to provide
quantitative brain tissue and lesion maps
immediately after the scan, and without affecting the
scanner’s performance. Eliminating the time gap
between image acquisition and tissue and lesion
quantification will also allow localized analysis of
the lesions using specialized acquisitions (e.e. MR
spectroscopy or high-resolution techniques) for
improved diagnostic accuracy. In this report we
describe an optimized framework wherein a fast
image analysis pipeline is integrated into a clinical
MRI system for online segmentation of various brain
tissues in MS patients.
2 METHODS
2.1 MRI Acquisition Protocol
Images from six MS patients were processed for
tissue classification and T2-hyperintense lesion
detection (other MS lesions can be analysed in a
similar fashion). All experiments were done on a
Philips Achieva 3.0 T system (Philips Healthcare,
Best, The Netherlands). The MRI protocol for MS
patients included the acquisition of multi-slice (44-
slices) fat-saturated dual-echo fast spin-echo (FSE)
sequence with TR/TE1/TE2 = 6800/8.2/90 msec,
FOV = 256x256x132 mm
3
, voxel size =
1.00x1.22x3.00 mm
3
, scan time 3:24, and multi-slice
FLAIR with TR/TI/TE = 10000/2600/80 msec, FOV
= 256x256x132 mm
3
, voxel size = 1x1x3 mm
3
, scan
time 4:20. The dual-echo FSE and FLAIR images
were reconstructed to the same matrix size
(256x256x44). The short-echo signal of the dual-
echo FSE is proton density (PD) weighted, while the
long-echo signal is T2 weighted (T2W).
2.2 System Layout
MRI data analysis was performed on a dedicated
processing workstation (Quad-Core Intel Xeon
E5640 2.66 GHz with 3.25 GB of memory, running
on Windows XP) connected to the scanner computer
through a fast network link. Special software
modules were added to the scanner console to
extract data from the patient database into a vendor-
specific compact image format. The data were
transferred to the processing workstation using a
HTTP protocol (hypertext transfer protocol).
Image processing and analysis were performed
on the workstation using a custom software package
written in the interactive data language (IDL, Exelis
Visual Information Solutions, Boulder, CO), Matlab
(The Mathworks, Natick, MA), and C programming
languages. The segmentation results were exported
to the scanner computer and added to the patient
database (Fig. 1). The segmented images were
available for preview by the technologist or
physician, and for review by the radiologist to aid
the diagnosis. Data transfer to the workstation,
image analysis, and importing data into the patient’s
database were all fully automated and integrated
with the MRI scanner in a seamless way, without the
need for user interaction.
2.3 Analysis Pipeline
The processing steps performed on the dual-echo
FSE and FLAIR datasets are summarized in Fig. 2.
First, the FLAIR dataset was co-registered with the
dual-echo data using a rigid-body transformation
(Collignon et al., 1995) in SPM8 software
(Wellcome Department of Cognitive Neurology,
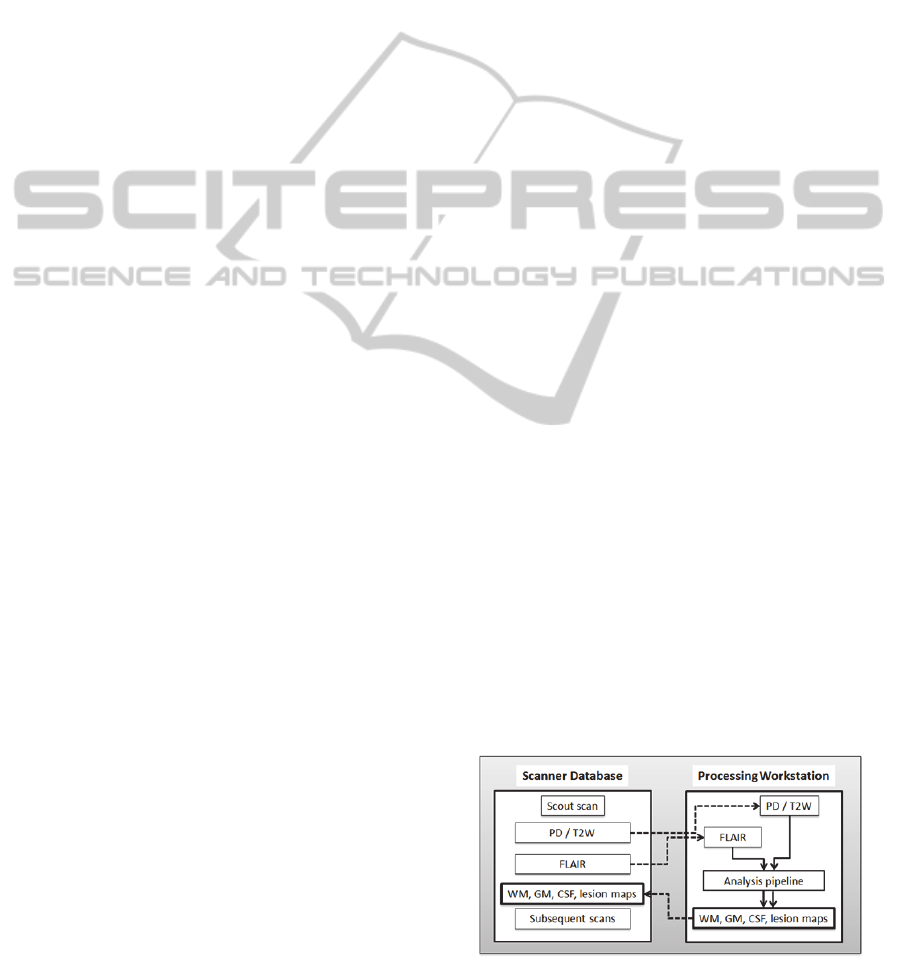
London, UK). Second, extra-meningeal tissues were
Figure 1: Online system for tissue classification and lesion
segmentation in MS.
OnlineBrainTissueClassificationinMultipleSclerosisusingaScanner-integratedImageAnalysisPipeline
107
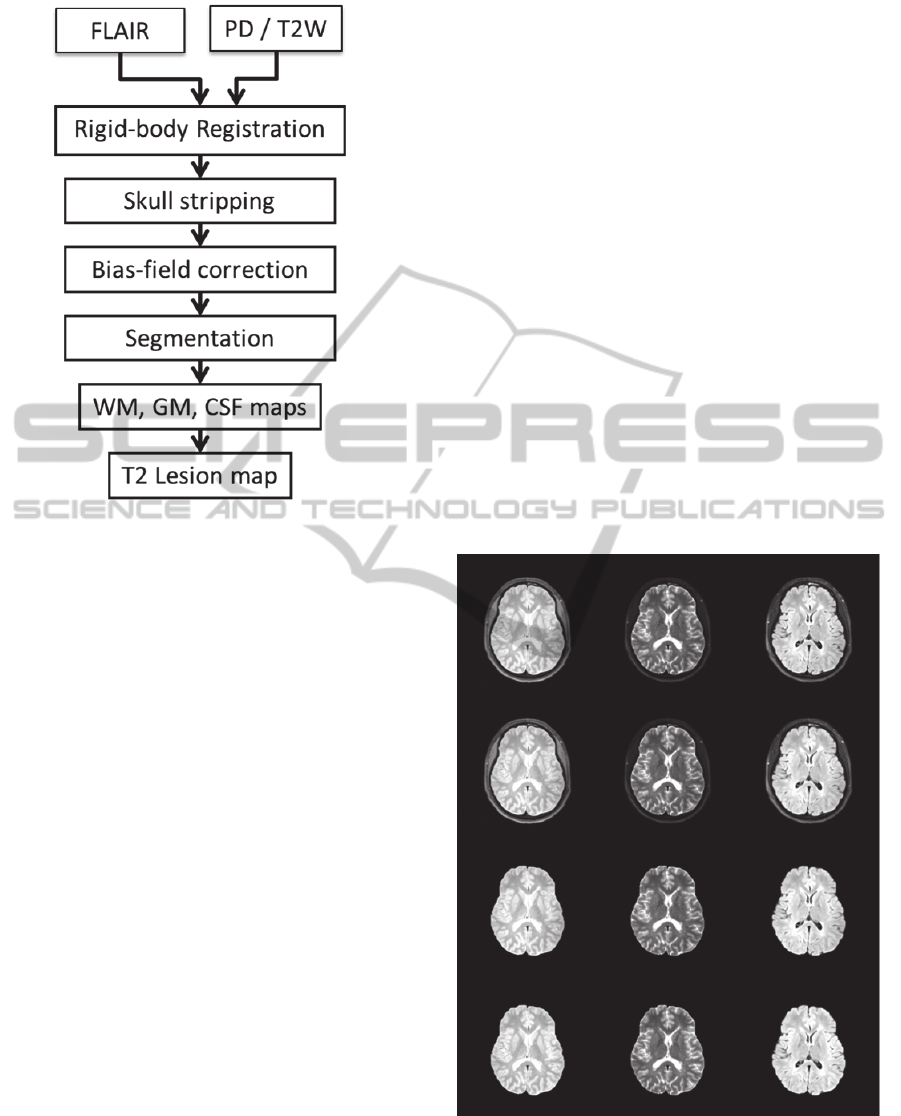
Figure 2: Image analysis pipeline.
removed using an automated procedure that utilizes
the fat-saturated T2W images (Datta and Narayana,
2011). Third, the PD, T2W, and FLAIR images were
corrected for field nonuniformity using the N4
method (Tustison et al., 2010). Finally, segmentation
was performed to classify brain tissue into WM,
GM, CSF, and WM lesions using a combination of
parametric and nonparametric methods as detailed in
(Sajja et al., 2006) and (Datta et al., 2006).
Execution times of the various post-processing
and analysis modules and total processing times
were recorded for each of the six MS cases studied.
Note that the segmentation accuracy was not
compromised, and the results obtained from the
online pipeline are identical to what would result
from off-line processing.
3 RESULTS
Fig. 3 shows one representative dataset at various
stages in the analysis pipeline. The corresponding
tissue classification is shown in Fig. 4, including
WM lesion segmentation. Table 1 reports the
processing times used by each of the registration,
skull stripping, nonuniformity correction, and
segmentation modules, as well as the total
processing time. On average, the total processing
time is 123 sec. All the six dataset were processed in
under 156 sec, making the results available in almost
real-time for the care giver.
4 DISCUSSION
The proposed online image analysis system allows
fast computation of quantitative information which
was traditionally possible only by performing off-
line processing. MS lesions and brain tissues were
classified and imported back on the scanner in about
two minutes after the acquisition of the data.
Importantly, this is achieved without interrupting the
scanner workflow with the aid of a dedicated
workstation that was seamlessly integrated into the
scanner’s software.
Having the analysis results immediately after the
scan is a valuable contribution to the imaging
practice in MS. In addition to quick inspection of the
quantitative results and the ability to evaluate data
quality while the patient is still in the scanner, the
operator can decide on the best flow of the study for
each individual case based on the results of
Figure 3: An axial slice from a representative dataset
showing the PD (left column), T2W (middle), and FLAIR
(right) at different stages of the processing pipeline before
(top row) and after (second row) co-registration, after
brain extraction (third row), and after nonuniformity
correction (fourth row).
VISAPP2014-InternationalConferenceonComputerVisionTheoryandApplications
108

Table 1: Execution times (mean ± standard deviation) for
different modules in the online image analysis pipeline
measured in six datasets.
Processing module Time (sec)
Registration 43 ± 9
Brain extraction 3.2 ± 0.2
Nonuniformity correction 39 ± 13
Tissue and lesion segmentation 38 ± 2
Total time 123 ± 18
quantitative analysis. The quantitative results can
also help determine the optimum parameters for
subsequent scans. The proposed online analysis can
be applied for online longitudinal evaluation to
detect changes in MS lesion activity relative to a
previous scan using subtraction MRI, which has
shown a potential to predict the course of the disease
(Liguori et al., 2011).
Although the 2-min processing time is
considerably short compared to the acquisition time
of the same data (~8 min), shorter processing times
are still desirable, especially when the protocol
requires the segmentation results before executing
the next imaging sequence. Parallel processing using
graphical processing units (GPU) is becoming
increasingly popular for medical image analysis
(Pratx and Xing, 2011), and will be adopted in future
work for further speedup.
Figure 4: Segmentation results showing masks of white
matter (top left), grey matter (top right), CSF (bottom left),
and WM lesions (bottom right) corresponding to the slice
shown in Fig. 3.
5 CONCLUSIONS
We have developed and implemented an online
system for MRI image analysis and demonstrated its
application for brain tissue classification and WM
lesion segmentation in MS patients. The online
image analysis pipeline was integrated into a clinical
MRI system that allowed a seamless workflow
wherein the results of quantitative analysis were
easily incorporated into the patient database and the
scanner’s user interface. We expect the proposed
framework to have an impact on patient
management, bringing what has been largely an
isolated research activity to be part of the general
imaging practice.
ACKNOWLEDGMENTS
The authors thank Vipulkumar Patel for assistance in
acquiring the MRI data. This work was supported by
NIH/NINDS grant R01 NS078244.
REFERENCES
Caramanos, Z., Francis, S. J., Narayanan, S., Lapierre, Y.
and Arnold, D. L. (2012) 'Large, nonplateauing
relationship between clinical disability and cerebral
white matter lesion load in patients with multiple
sclerosis', Archives of neurology, vol. 69, no. 1, p. 89.
Collignon, A., Maes, F., Delaere, D., Vandermeulen, D.,
Suetens, P. and Marchal, G. (1995) 'Automated multi-
modality image registration based on information
theory', Information processing in medical imaging,
263-274.
Datta, S. and Narayana, P. A. (2011) 'Automated brain
extraction from T2-weighted magnetic resonance
images', Journal of Magnetic Resonance Imaging, vol.
33, no. 4, pp. 822-829.
Datta, S. and Narayana, P.A. (2013) 'A comprehensive
approach to the segmentation of multichannel three-
dimensional MR brain images in multiple sclerosis',
NeuroImage: Clinical, vol. 2, pp. 184-196.
Datta, S., Sajja, B. R., He, R., Wolinsky, J. S., Gupta, R.
K. and Narayana, P.A. (2006) 'Segmentation and
quantification of black holes in multiple sclerosis',
Neuroimage, vol. 29, no. 2, p. 467.
Fisniku, L., Brex, P., Altmann, D., Miszkiel, K., Benton,
C., Lanyon, R., Thompson, A. and Miller, D. (2008)
'Disability and T2 MRI lesions: a 20-year follow-up of
patients with relapse onset of multiple sclerosis',
Brain, vol. 131, no. 3, pp. 808-817.
Karimaghaloo, Z., Shah, M., Francis, S. J., Arnold, D. L.,
Collins, D. and Arbel, T. (2012) 'Automatic detection
of Gadolinium-enhancing multiple sclerosis lesions in
OnlineBrainTissueClassificationinMultipleSclerosisusingaScanner-integratedImageAnalysisPipeline
109

brain MRI using conditional random fields', Medical
Imaging, IEEE Transactions on, vol. 31, no. 6, pp.
1181-1194.
Kobelt, G., Berg, J., Atherly, D. and Hadjimichael, O.
(2006) 'Costs and quality of life in multiple sclerosis A
cross-sectional study in the United States', Neurology,
vol. 66, no. 11, pp. 1696-1702.
Liguori, M., Meier, D. S., Hildenbrand, P., Healy, B. C.,
Chitnis, T., Baruch, N.F., Khoury, S.J., Weiner, H.L.,
Bakshi, R., Barkhof, F. and others (2011) 'One year
activity on subtraction MRI predicts subsequent 4 year
activity and progression in multiple sclerosis', Journal
of Neurology, Neurosurgery & Psychiatry, vol. 82, no.
10, pp. 1125-1131.
Milo, R. and Kahana, E. (2010) 'Multiple sclerosis:
geoepidemiology, genetics and the environment',
Autoimmunity reviews, vol. 9, no. 5, pp. A387--A394.
Popescu, V., Agosta, F., Hulst, H. E., Sluimer, I.C., Knol,
D.L., Sormani, M. P., Enzinger, C., Ropele, S.,
Alonso, J., Sastre-Garriga, J. and others (2013) 'Brain
atrophy and lesion load predict long term disability in
multiple sclerosis', Journal of Neurology,
Neurosurgery, and Psychiatry.
Pratx, G. and Xing, L. (2011) 'GPU computing in medical
physics: A review', Medical Physics, vol. 38, p. 2685.
Sahraian, M. A. and Eshaghi, A. (2010) 'Role of MRI in
diagnosis and treatment of multiple sclerosis', Clinical
neurology and neurosurgery, vol. 112, no. 7, pp. 609-
615.
Sajja, B. R., Datta, S., He, R., Mehta, M., Gupta, R. K. and
Wolinsky, J. S. (2006) 'Unified approach for multiple
sclerosis lesion segmentation on brain MRI', Annals of
biomedical engineering, vol. 34, no. 1, pp. 142-151.
Sweeney, E. M., Shinohara, R. T., Shiee, N., Mateen, F. J.,
Chudgar, A. A., Cuzzocreo, J. L., Calabresi, P. A.,
Pham, D. L., Reich, D. S. and Crainiceanu, C. M.
(2013) 'OASIS is Automated Statistical Inference for
Segmentation, with applications to multiple sclerosis
lesion segmentation in MRI', NeuroImage: Clinical.
Tustison, N. J., Avants, B. B., Cook, P. A., Zheng, Y.,
Egan, A., Yushkevich, P.A. and Gee, J.C. (2010)
'N4ITK: improved N3 bias correction', Medical
Imaging, IEEE Transactions on, vol. 29, no. 6, pp.
1310-1320.
VISAPP2014-InternationalConferenceonComputerVisionTheoryandApplications
110
