
Improved Pulse Detection from Head Motions using DCT
Ramin Irani, Kamal Nasrollahi and Thomas B. Moeslund
Visual Analysis of People Laboratory, Aalborg University (AAU), Sofiendalsvej 11, 9200 Aalborg, Denmark
Keywords: Heartbeat Rate, Head Motion Detection, Trajectory, Feature Point Tracker, Principle Component Analysis,
Discrete Cosine Transforms, Electrocardiogram.
Abstract: The heart pulsation sends out the blood throughout the body. The rate in which the heart performs this vital
task, heartbeat rate, is of curial importance to the body. Therefore, measuring heartbeat rate, a.k.a. pulse
detection, is very important in many applications, especially the medical ones. To measure it, physicians
traditionally, either sense the pulsations of some blood vessels or install some sensors on the body. In either
case, there is a need for a physical contact between the sensor and the body to obtain the heartbeat rate. This
might not be always feasible, for example, for applications like remote patient monitoring. In such cases,
contactless sensors, mostly based on computer vision techniques, are emerging as interesting alternatives.
This paper proposes such a system, in which the heartbeats (pulses) are detected by subtle motions that
appear on the face due to blood circulation. The proposed system has been tested in different facial
expressions. The experimental results show that the proposed system is correct and robust and outperforms
state-of-the-art.
1 INTRODUCTION
Heartbeat rate is obviously a vital sign of human
body's activity and its measurement is of great
importance in many applications, for instance,
fitness assessment, training programs and medical
diagnosis. For example, in fitness assessment during
the exercise, heartbeat rate is used as a crucial sign
that helps to assess the condition of cardiovascular
system. Here it can be used also for ensuring the
safety of the process. If the heartbeat rate goes
beyond the normal range, continuing the exercise is
not safe any longer.
Heartbeat rate is usually measured by devices
that take samples of heartbeats and compute the
beats per minute (bpm). Currently, one of the
popular non-invasive and standard devices for
measuring the heartbeat rate is electrocardiogram
(ECG). They are very accurate, but expensive. These
devices are electrode-based and therefore require
wearing adhesive gel patches or chest straps that
may cause skin irritation and slight pain.
Commercial pulse oximetry sensor is another
technique that is placed on specific parts of body
like fingertips or earlobe.
Though the above mentioned devices are
accurate, they are inconvenient as they need to have
physical contact with patient's body. Therefore,
developing contactless methods, which are based on
the patient's physiological signals, have recently
been considered as an interesting alternative for
measuring heartbeat rate. This technology would
also decrease the amount of cabling and clutter
related to Intensive Care Unit (ICU) monitoring,
long-term epilepsy monitoring, sleep studies, and
any continues heartbeat rate measurement (Poh,
2010). These contactless methods that are usually
based on computer vision techniques can be divided
into two groups. In the first group, known as
photoplethysmography (PPG) methods, usually a
red, or an infrared light is transmitted on the patients
(face or body) and the reflected light is sensed by the
system. The variations in the transmitted and the
reflected lights are then used to measure heartbeat
rate. Besides using dedicated light sources, the main
drawbacks of PPG systems are that they are
susceptible to motion artefact (Verkruysse, 2008);
(Humphreys, 2007); (Takano, 2007); (Hu, 2008);
(Wieringa, 2005).
In the second group of computer vision based
methods there is no need for a dedicated light
source. These methods assume that the periodic
circulation of the blood by the heart to the rest of the
body, including the head, generates some periodic
118
Irani R., Nasrollahi K. and Moeslund T..
Improved Pulse Detection from Head Motions using DCT.
DOI: 10.5220/0004669001180124
In Proceedings of the 9th International Conference on Computer Vision Theory and Applications (VISAPP-2014), pages 118-124
ISBN: 978-989-758-009-3
Copyright
c
2014 SCITEPRESS (Science and Technology Publications, Lda.)

subtle changes to the skin color of the face and also
generates some subtle head motions. These motions
are not usually visible to naked eyes but they can be
viewed by techniques like, for example, Eulerian
video magnification (Wu, 2012). These periodic
changes to the skin colors and head motions are then
utilized to measure heartbeat rate. For example, in
(Poh, 2010) periodic changes in the skin color of the
face has been used for this purpose. In this system
(Poh, 2010) face image of the subject is first found,
by a simple camera. Then, it is separated into its
colour channels and each channel is tracked
independently. For each of these tracked colour
channels, a trajectory is found. Then, all the
trajectories are fed to an Independent Component
Analysis (ICA) algorithm. The output of ICA,
presents independents sources that have caused
changes to the skin colour of the face. Then, it is
assumed that the most periodic output of ICA should
be generated by the most periodic source that is
present on the face, i.e., heartbeat. This system is
effective, but it suffers from sensitivity to skin color
and noise. It means, if the skin is not detected
properly, or if the captured facial video is noisy, the
system does not provide accurate results.
To overcome the sensitivity to noise and skin
detection of system (Poh, 2010), very recently in
(Balakrishnan, 2013) a motion-based contactless
system for measuring heartbeat rate was introduced.
As mentioned above, this method is based on the
fact that periodic circulation of the blood from the
heart to the body, including the head through the
aorta and carotid arteries, causes the head to move in
a cyclic motion (Wu, 2012). Similar to (Poh, 2010),
this system also uses a simple camera for recording
facial images of patients. Having detected the face,
they extracted vertical component of head motion by
tracking feature points, and generate some
trajectories for each feature point. These trajectories
are then filtered by a Butterworth filter to remove
the irrelevant frequencies. Next on the contrary
(Poh, 2010) they use Principle Component Analysis
(PCA) (instead of ICA) to decompose the filtered
trajectories into a set of source signals. Then, they
use the same assumption as (Poh, 2010), that the
most periodic signal is generated by the most
periodic source of the motion that is present in the
face, i.e., by heartbeat. To find the periodicity of the
outputs of PCA, they apply Fast Fourier Transform
(FFT) to the trajectories, and use the percentage of
total spectral power of the signal accounted for by
the frequency with the maximal power and its first
harmonic (Balakrishnan, 2013).
This method gives reasonable results when the
face is frontal and does not move. Our experiment
shows that involuntary motion and facial expression
causes dramatic effect on the accuracy of this
system. Furthermore, as mentioned above, this
system is based on using the frequency with
maximal power as the first harmonic of the
estimated heartbeat rate. But, this assumption is not
always true, especially when the facial expression is
changing. The proposed system in this paper
improves the system of (Balakrishnan, 2013) by
replacing the FFT with a Discrete Cosine Transform
(DCT). Furthermore, we show that involving a
moving average filter before the Butterworth filter
improves the results. It is shown that the proposed
system outperforms the system of (Balakrishnan,
2013), significantly.
The rest of this paper is organized as follows:
The clear problem statement and the contributions of
the proposed system are given in the next section.
Section 3 explains the employed methodology of the
proposed system. The experimental results are
reported in Section 4. Finally, the paper is concluded
in Section 5.
2 PROBLEM STATEMENT AND
MAIN CONTRIBUTION
The proposed system in this paper develops a vision-
based contactless algorithm for heartbeat rate
measurement using the assumption that periodic
blood circulation by the heart to the head generates
subtle periodic motion on the face. The proposed
system is based on the very recent work of
(Balakrishnan, 2013), but it advances this work by:
1) Replacing the FFT of the system of
(Balakrishnan, 2013) by a DCT, and
2) Using a moving average filter before the
Butterworth filter that is employed in
(Balakrishnan, 2013).
The proposed modifications are simple, but are
shown to be very effective. The results of the
proposed system are:
1) More correct compared to the results of the
system of (Balakrishnan, 2013) when they are
compared to the ground truth data.
2) More robust than the results of the system of
(Balakrishnan, 2013) when the face is moving or
facial expression is changing.
ImprovedPulseDetectionfromHeadMotionsusingDCT
119
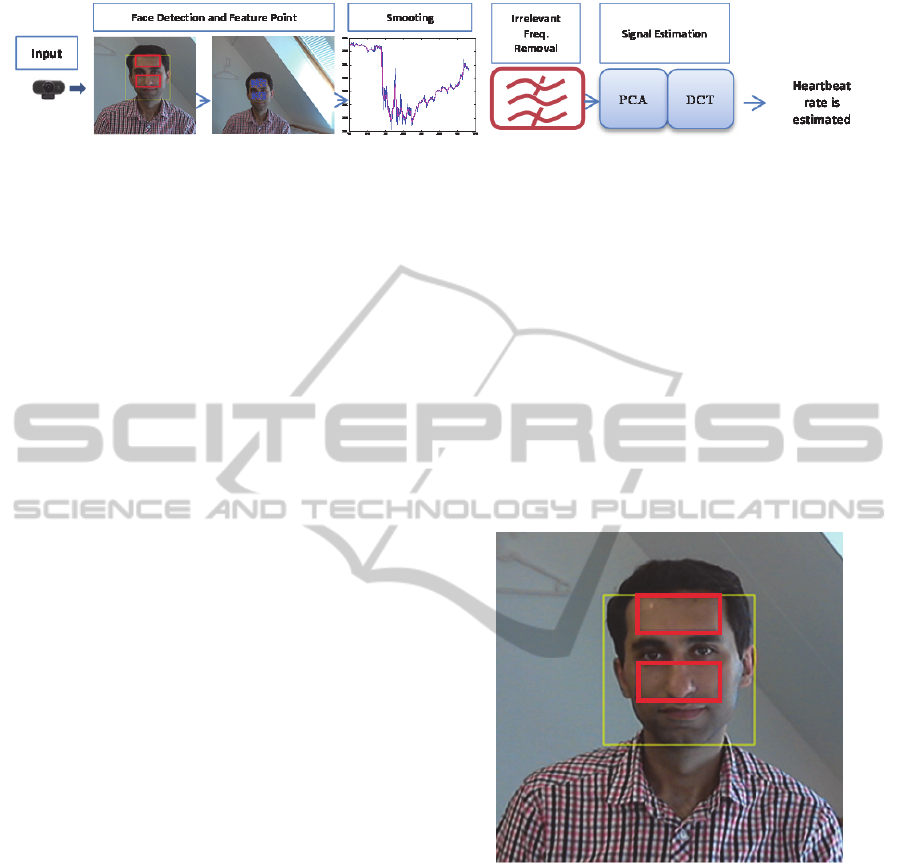
Figure 1: The block diagram of the proposed system.
3 METHODOLOGY
The block diagram of the proposed system is shown
in Figure 1. As it can be seen from this figure, the
subject is continuously filmed by a Logitech
webcam with a resolution of 640x480 pixels. Then,
the subject's face is detected by Viola and Jones
(Viola, 2001) face detector. From the detected faces,
the regions of interest of our system, and
consequently the feature points are extracted and
tracked by the Lucas Kanade’s algorithm (Bouguet,
2000). Then, a moving average filter and a band pass
filter are applied to the vertical component of the
trajectories of each feature point to remove
extraneous frequencies and involuntary head
motions. Then, the filtered trajectories are fed to
PCA to find the strongest independent components.
Among these components, the most periodic one
belongs to heartbeat. To find this most periodic one,
we apply DCT to all the components obtained by
PCA. Each of these sub-blocks is explained in the
following subsections.
3.1 Face Detection
Locating the face in the scene refers to identifying a
region containing a human face. Viola and Jones
algorithm (Viola, 2001) has been employed for this
purpose which is based on Haar-like rectangular
features that are extracted from integral images. This
detector is fast and efficient, but it fails to detect
rotated faces and those which are of poor quality.
However, it works fine for the purposes of the
proposed system.
The regions detected by the Viola and Jones
detector cannot be directly used in our system, as it
contains the areas of eyes and the mouth which are
not good for the purposes of our system. Because
these areas are the most changeable areas of the
face, and they may change very much by any
changes in facial expression, eye blinking, etc.
Therefore, the trajectories obtained from these
changeable will not reflect the motion caused by
heartbeat. Instead, they reflect the motion caused by
the changes in their own positions due to the
changes in the facial expression. Tracking these
sensitive regions therefore does not produce stable
results. The most stable parts of the face, which are
robust against changes in the facial expressions, are
the forehead and the area around the nose. To keep
these regions, we first keep 50% (experimentally
obtained) of the width and 70% (experimentally
obtained) of the height of the region that is detected
the Viola and Jones’s face detector. Then, in this
refined region we remove the area of the eyes, by
removing all the pixels that are located in the range
of 25% to 45% (experimentally obtained) of the
height of the refined region (Figure 2).
Figure 2: The yellow box is returned by the Viola and
Jones face detector and the red boxes are those that are of
the interest of the proposed system.
3.2 Feature Points Selection
Having detected the regions of interest in the
previous sub-block of the system, in this step they
are fed to the Good Feature Tracking algorithm of
(Shi, 1994) to select the feature points. This
algorithm is based on finding and tracking the
corners. To do so, it calculates the minimal
eigenvalue of every point in our previously kept
regions of the face and rejecting corners with
minimal eigenvalues. Then, it goes through the
strongest corners and removes those features that are
VISAPP2014-InternationalConferenceonComputerVisionTheoryandApplications
120

too close the stronger features (Shi, 1994). To
increase the efficiency of this system, it is suggested
in (Balakrishnan, 2013) to divide the sub-regions
obtained from Viola and Jones detector into smaller
areas to achieve uniform selected regions. Therefore,
we have adopted this idea here.
3.3 Trajectory Generation and
Smoothing
To extract the motion trajectory signals from the
selected feature points in the previous subsection,
we have used Lucas Kanade’s algorithm (Bouguet,
2000) to obtain x and y components of feature points
inside our previously extracted regions of interest in
each frame. Since the very tiny motions of the head,
which are the basis for calculating the heartbeat rate
in this work, are due to the blood circulation through
aorta towards head (obviously in a vertical
direction), we only consider the y components of the
trajectories of the feature points in each frame.
The head motions are not only due to heartbeats
(transferred to the head by aorta), but may appear for
several reasons, for example, respiration, vestibular
activity, facial expression, speaking and so on. To
decrease the effects of the other sources, which
cause quite large motions, a moving average filter is
applied to the trajectories to smooth it (Figure 3).
This will be further explained in the experimental
results.
Figure 3: The effect of the employed moving average filter
on the y components of the trajectory of one of the tracked
feature points of one of the test subjects. The red and the
blue signals are the original and the filtered signals, on the
x axis of the above graph is the time and on the y axis is
the y position of the tracked feature point over time.
Then, to remove the irrelevant frequencies (any
frequency which might not be generated by the
heartbeat) a pass band filter (an 8
th
order
Butterworth filter) with cutoff frequency interval of
[0.75 5] Hz has been applied to the obtained
trajectory (Balakrishnan, 2013).
3.4 Signal Estimation
As mentioned above, the head motions are orginated
from different sources and only the one casued by
the blood circulation through aorta is reflecting the
heartbeat rate. To separate the sources of head
motions, we have applied a PCA algorithm to the
obtained trajectories. PCA converts the given
trajectories into a set of linearlly uncorrelated basis,
i.e., the principal components.
Having separated the sources using PCA, the
next step is to find the signal that has been generated
by the heartbeat. Following (Balakrishnan, 2013)
such a signal will be the most periodic signal. To
quantify the signal periodicity we have utilized DCT
as opposed to the system of (Balakrishnan, 2013)
which have used FFT. Having applied DCT, we only
keep those DCT components that carry the most
significant power of the signal. To do so, we use the
following algorithm:
For the trajectory of the ith feature points,
i∈[1..N], S
i
:
o Calculate the DCT of the ith trajectory and
obtain SC
i
o Determine {K
j
}
i
which is the set of indexes
for {S
i
(t)} such that K
j
is the index of the M
first highest power components into SC
i
which consists 50% of power of S
i
,
j∈[1..M
i
]
(M
i
is number of components
which carry 50%of total power of S
i
)
o Determine {Kh
l
}
i
which is the set of the first 5
smallest index into {K
j
}
i
for each S
i
such that
2×Kh
l
be found on SC
i
l = 1:5.
o The periodicity of the signal can be obtained
by:
,2
/
S
i
with largest Q
i
is the heartbeat rate signal, and
the heartbeat rate can be obtained as: FFT(IDCT
(min{Kh
i
})) × 60 bpm
The effect of the above DCT-based algorithm for
finding the heartbeat rate and its advantage over the
FFT of (Balakrishnan, 2013) has been shown in the
experimental results.
4 EXPERIMENTAL RESULTS
The proposed approach has been implemented in
Matlab R2013a. To be able to compare our system
ImprovedPulseDetectionfromHeadMotionsusingDCT
121
against state-of-the-art Balakrishnan et al.’s work
(Balakrishnan, 2013) we have recorded the actual
heartbeat rates of the test subjects by a Shimmer
wireless ECG (Electrocardiogram) sensor. This
sensor records and sends the ECG signals, to a
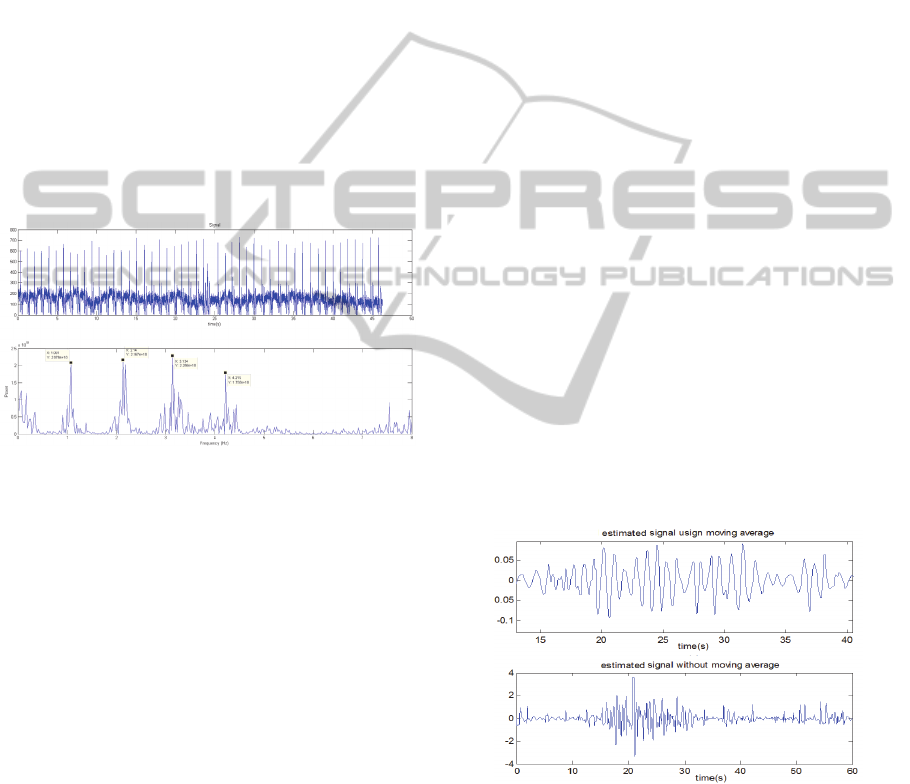
remote computer as a data file. Figure 4 (top) shows
a typical data that has been captured by this sensor.
The FFT of this signal is shown in Figure 4
(bottom). It can be seen from this figure, that the
FFT has 4 peaks on the frequencies 1.08, 2.14, 3.13,
and 4.22. These show that most of the power of the
recorded heartbeat signal is carried by these 4
component frequencies which seem to be
approximately integer multiple components of
1.08, as a fundamental frequency or first
harmonic. Therefore, we can conclude that period of
the heartbeat signal per minute is 1.08x60 = 64.8.
The numbers of pulses on Figure 4 (bottom) prove
this.
Figure 4: Recorded ECG signal and its FFT corresponding
signals which shows the periodicity of the ECG signal.
Having shown that the ECG signals obtained by
the employed sensor are indeed periodic (Figure 4),
we now first explain the testing scenarios in which
our data have been recorded. Then, we show the
effects of the modifications that we have applied to
the system of (Balakrishnan, 2013). Next, we give
the details of the comparison of our system against
the Balakrishnan et al.’s work (Balakrishnan, 2013).
4.1 Testing Scenarios
Five test subjects were asked to participate in testing
the systems from which 32 different videos were
recorded. These videos are recorded by a Logitech
webcam at a frame rate of 30 fps in different facial
expressions and head poses. These are the situations
in which the videos have been recorded in:
Subjects look directly into the camera without
changing their facial expressions (This is the
same imaging condition as the system of
(Balakrishnan, 2013)).
Subjects turn around their faces from left
(180
°
) to right (180
°
) and look at seven
different targets that are located at the same
distance from each other.
Subjects show smiling/laughing expression.
Subjects repeat a given sentence.
Subjects show angry expression.
The duration of each video is around 60 seconds.
4.2 The Moving Average Filter and
DCT
Before obtaining the periodicity of the selected
source signal (Figure 1 block diagram), the only
difference between our system and the work of
(Balakrishnan, 2013) is that we have introduced a
moving average filter. This does not have much
effect when the face is standing still, and is facing
the camera. But, as soon as the subject is changing
his/her head pose and/or facial expressions are
changing, there will be so many occlusions in the
tracking of the feature points, that without using a
moving average filter the results will be erroneous.
Comparing Figure 5 (top) to Figure 5 (bottom)
shows that including this moving average filter
causes the employed PCA to pick a much smoother
signal as the strongest component compared to the
case where such a filter has not been included
(Balakrishnan, 2013). This will gives us better
results, for estimating the heartbeat rates, in the final
step of the system.
Figure 5: Comparing the estimated heartbeat rate signal
when the moving average filter is used (top) and when it is
not used (bottom).
Besides introducing the moving averge filter for
smoothing the estimated signal, in our system we
have used DCT to estimate the periodicity of the
estimated signal. The effect of this decision and
comparing it with the FFT of (Balakrishnan, 2013) is
shown in Figure 6. In this figure (top and middle
VISAPP2014-InternationalConferenceonComputerVisionTheoryandApplications
122

parts) a signal and its FFT representation are shown.
The maximum power of this FFT (3.603) gives a
heartbeat rate of 3.603x60 = 216.18, while the actual
heartbeat rate in this case is 60 bpm which can be
estimated much better using the first harmonic
(1.001x60=60.06). Therefore, the total spectral
power of the signal and then using the maximal
power and its first harmonic as have been used in
(Balakrishnan, 2013) does not always produce the
desired results. Instead, by using DCT in Figure 6
(bottom) it can be seen that a much better result will
be obtained, if the component number 20 is selected
as the component which carries the power of pulse
frequency. Feeding this value of this component in
the algorithm of section 3.4 results in an estimated
beat rate of 60.88 bpm, which is very close to the
actual value.
Figure 6: Extracting the beat rate of the signal (top) using
the algorithm of (Balakrishnan, 2013) (middle) and our
employed DCT (bottom).
4.3 Detailed Experiments
The proposed system has been compared against the
state-of-the-art work of (Balakrishnan, 2013) using
the testing data that was recorded in the previously
explained testing scenarios. The results of
comparing these systems (the proposed system and
the work of (Balakrishnan, 2013) against the ground
truth data obtained by the Shimmer ECG sensor for
the case which the testing subjects are looking
directly into the camera are shown in Table 1. In this
table, (a) is the subject number, (b) is the ground
truth data read by a Shimmer ECG device, (c) is the
heartbeat rate estimated by the system of
(Balakrishnan, 2013), (d) is the error of the method
of (Balakrishnan, 2013), (e) is the heartbeat rate
estimated by our proposed method, (f) is the error of
our proposed method. It can be seen that the error of
our system is generally better than that of
(Balakrishnan, 2013).
Table 1: The proposed system against system of
(Balakrishnan, 2013), please see the text for descriptions
of the headings.
a b c d e f
S1-1 61.71 63.06 1.35 62.1 0.39
S1-2 66.67 67.04 0.37 67.03 0.36
S2-1 60 216.83 156.8 61.88 1.88
S2-2 59 61.06 2.06 59.10 0.1
S2-3 54.00 53.03 0.97 54.11 0.11
S3-1 66.65 69.05 2.40 67.63 0.98
S4-1 84.06 86.06 2.00 83.90 0.16
S5-1 47.62 48.03 0.41 46.17 1.45
The size of the window employed for the moving
average filter in the previous experiment is set to
one. It means, no moving average is applied to the
data obtained from the previous test. Because, the
signal is already smooth. But, when it comes to the
case where facial expressions and/or head pose are
changing, the effect of the moving average becomes
more visible. Table 2 shows the results of the
proposed system against the work of (Balakrishnan,
2013) and the ground truth. The descriptions of the
headings (a)-(f) are the same as those for Table 1.
The size of the moving average window changes
between 40-80 samples, for different testing
scenarios. It can be seen from this table that the
proposed system is more robust than the work of
(Balakrishnan, 2013) in most of the cases, when the
facial expression and/or head pose are changing.
5 CONCLUSIONS
Motivated by the fact that in many applications like,
e.g., remote patient monitoring, there is not a
possibility for installing a device on the body of the
patients, this paper has proposed a contactless
heartbeat rate measurement using computer vision
techniques. The system finds some robust feature
points inside the facial areas of the users and tracks
them over time to generate some trajectories of the
feature points. These trajectories are then smoothed
by a moving average filter. Then, the irrelevant
frequencies are removed from the trajectories. All of
these refined trajectories are then fed to a PCA
algorithm to find the strongest independent
component. This component is assumed to be the
estimated heart beat signal. To find the periodicity of
this estimated signal a DCT-based algorithm has
been used. Experimental results on several video
0 1 2 3 4 5 6 7 8 9 10
-0.5
0
0.5
time(s)
Signal
0 1 2 3 4 5 6 7 8
0
5000
X: 3.603
Y: 4068
Frequency (Hz)
Power
0 50 100 150 200 250 300 35
0
-0.2
0
0.2
X = 20
Y = -0.105
n
Magnitue
X = 40
Y = 0.0956
ImprovedPulseDetectionfromHeadMotionsusingDCT
123

Table 2: Comparing the results of the proposed system against the state-of-the-art work of (Balakrishnan, 2013) when the
facial expressions and/or head pose are changing. Please see the text for the descriptions of the headings.
The test subject is smiling! The test subject is speaking!
a b c d e f c d e f
S1-1 66.67 49.051 17.61 58.22 8.45 81.28 14.61 67.31 0.64
S2-1 59 48.02 10.98 59.35 0.35 75.09 16.09 58.41 0.59
S2-2 54.00 56.04 2.04 54.99 0.99 79.05 25.05 52.66 1.34
S3-1 66.65 48.04 18.61 56.77 9.88 51.03 15.62 66.50 0.15
S4-1 84.06 148.09 64.03 61.73 22.33 61.04 23.02 63.78 20.28
S5-1 47.62 47.03 0.59 48.44 0.82 46.72 0.9 48.14 0.52
The test subject is angry! The head pose is changing!
a b c d e f c d e f
S1-1 66.67 50.05 16.62 59.23 7.44 49.03 17.64 60.47 6.2
S2-1 59 63.04 4.04 59.86 0.86 48.02 10.98 59.69 0.69
S2-2 54.00 49.04 4.96 63.96 9.96 50.04 3.96 53.04 0.96
S3-1 66.65 49.05 17.60 59.92 6.73 50.05 16.6 58.87 7.78
S4-1 84.06 63.03 21.03 47.76 36.3 146.10 62.04 57.87 26.19
S5-1 47.62 50.05 2.43 59.23 11.61 51.05 3.43 45.90 1.72
sequences show that the estimated heartbeat rates in
different facial expressions and head poses are very
close to the ground truth. Furthermore, it is shown
that the proposed system outperforms state-of-the-
art.
REFERENCES
Balakrishnan, G., Durand, F. and Guttag, J., 2013,
Detecting Pulse from Head Motions in Video.
Computer Vision and Pattern Recognition,
Proceedings CVPR '13, 2013 IEEE Computer Society
Conference on.
Bouguet, J., 2000, ‘Pyramidal implementation of the
Lucas Kanade feature tracker’, Intel Corporation,
Microprocessor Research Labs, Technical Report.
Hu, S., Zheng, J., Chouliaras, V. and Summers, R., 2008,
‘Feasibility of imaging photoplethysmography’, in
Proceedings of IEEE Conference on Biomedical
Engineering and Informatics, pp. 72–75.
Humphreys, K., Ward, T. and Markham, C., 2007,
‘Noncontact simultaneous dual wavelength
photoplethysmography: a further step toward
noncontact pulse oximetry’, Rev. Sci. Instrum., vol.
78, Issue 4, pp. 853-857.
Poh, M., McDuff, D. and Picard, R., 2010, ‘Non-contact,
automated cardiac pulse measurements using video
imaging and blind source separation’, Optic express,
Optics Express, Vol. 18, Issue 10, pp.10762-10774.
Shi, J., Tomasi, C., ‘Good features to track,’ 1994,
Computer Vision and Pattern Recognition,
Proceedings CVPR '94., 1994 IEEE Computer Society
Conference on, pp.593-600.
Takano, C. and Ohta, Y.,2007, ‘Heart rate measurement
based on a time-lapse image’, Med. Eng. Phys. Vol.
29, Issue 8, pp. 853-857.
Verkruysse, W., Svaasand, L. and Nelson, J., 2008,
‘Remote plethysmographic imaging using ambient
light’, Opt. Express, Vol. 16, Issue 26, pp. 21434-
21445.
Viola, P. and Jones, M.,2001, ‘Rapid object detection
using a boosted cascade of simple features’, Computer
Vision and Pattern Recognition, Proceedings CVPR
'01., 2001 IEEE Computer Society Conference on, pp.
511-518.
Wieringa, F., Mastik, F. and van der Steen, A., 2005,
‘Contactless multiple wavelength
photoplethysmographic imaging: a first step toward
“SpO2 camera” technology’, Ann. Biomed. Eng. Vol.
33, Issue 8, pp.1034-1041.
Wu, H., Rubinstein, M., Shih, E., Guttag, J., Durand, F.
and Freeman, W., 2012 ‘Eulerian Video Magnification
for Revealing Subtle Changes in the World’, ACM
Transactions on Graphics, Proceedings SIGGRAPH
2012, Vol. 31, Issue 4, pp. 65-72.
VISAPP2014-InternationalConferenceonComputerVisionTheoryandApplications
124
