
Depth-Scale Method in 3D Registration of RGB-D Sensor Outputs
İsmail Bozkurt and Kemal Egemen Özden
Faculty of Engineering, Bahçeşehir University, İstanbul, Turkey
Keywords: 3D Registration, Kinect, Local Image Features and Matching.
Abstract: Automatic registration of 3D scans with RGB data is studied in this paper. In contrast to bulk of research in
the field which deploy 3D geometry consistency, local RGB image feature matches are used to solve the
unknown 3D rigid transformation. The key novelty in this work is the introduction of a new simple measure,
we call “Depthscale measure”, which logically represents the size of the local image features in 3D world,
thanks to the availability of the depth data from the sensor. Depending on the operating characteristics of the
target application, we show this measure can be useful and efficient in eliminating outliers through
experimental results. Also system level details are given to help scientists who want to build a similar
system.
1 INTRODUCTION
Registering 3D scans of the same rigid environment
from different vantage points is an old computer
vision problem which is still an active research field.
Various applications of such techniques include 3D
modeling, 3D model retrieval and robot navigation.
The research field got recently a new momentum
thanks to availability of cheap RGB-D sensors (e.g.
Microsoft Kinect). In this paper, we study a simple
3D registration system using data coming from
Kinect-like sensors.
Quite some active research in the field is
dedicated to registering and associating 3D scans
based on their global/partial 3D geometric
consistency. As a complementary approach, a
system using RGB local features has its own
advantages: (i) Environments which do not have
enough 3D geometric variation but color variation
can easily be registered. (ii) Partial matching of the
3D scans are naturally handled. (iii) Detection and
matching of local image features is a well-
understood problem and many opensource/free
feature detection libraries exist which makes
building such a system very easy. In an nutshell, our
system detect local image features in 3D scans,
match them and registers the 3D models into a
cumulative model by using 3-point 3D similarity
transformation estimation and RANSAC sampling
The key novelty in our approach is the use of a
new measure that we coined as “Depthscale”
measure which is easy to compute and gives extra
information about match-ability of the image
features. It is simply the multiplication of the
detected scale of image feature and the associated
depth. Assuming the internal camera parameters of
the sensor did not change during the scans, this
measure logically represents the size of the local
image feature in 3D space. Being a simple integer or
double value, it can be used efficiently to ignore
false matches, in contrast to (and additional to)
computing similarity measure of two full feature
description vector (e.g. 128 byte vectors in SIFT).
The operation characteristics of the target
application impose different constraints on the
system. For example a robotic navigation system
with limited computational power and real-time
mapping and localization requirements will desire
small number of matches with high inlier ratio for
minimal number of RANSAC iterations. Whereas
3D modelling applications running on workstations,
which would like to have good accuracy, may prefer
high number of matches even though inlier ratio is
low in order to get as many inliers as possible. We
will show the usefulness of Depthscale measure for
obtaining proper operation mode.
During experimental evaluation, we analyzed the
effect of Depthscale measure with respect to Lowe’s
second closest neighbor method. We also checked
results which combine two methods. As a novel
470
Bozkurt I. and Özden E..
Depth-Scale Method in 3D Registration of RGB-D Sensor Outputs.
DOI: 10.5220/0004673204700475
In Proceedings of the 9th International Conference on Computer Vision Theory and Applications (VISAPP-2014), pages 470-475
ISBN: 978-989-758-003-1
Copyright
c
2014 SCITEPRESS (Science and Technology Publications, Lda.)

approach, we cast the problem of outlier elimination
of a match-set as a binary classification problem.
Hence we could show the results as ROC (Receiver
Operating Characteristics) curves.
Even though the system is simple to construct,
considering the popularity of the Kinect platform,
implementation details to be presented will still be
useful for future developers of a similar system.
The paper will proceed as follows. First we will
give a brief mention of the related literature. Second,
we will summarize main concepts and methods we
deployed. Third, we will give the system details and
various ways of exploiting our Depthscale method.
Afterwards we will share our practical observations
during building such a system, especially relevant to
Kinect environment. Following the experiments
section, the paper is concluded.
2 LITERATURE
Matching and registering 3D models is an old
computer vision problem. A common approach
begins with creating a rough alignment, typically
using PCA or manually, than applies a variation of
Iterative Closest Point (ICP) (Besl and McKay,
1992) algorithm. A recent overall pipeline is
introduced by Microsoft for Kinect systems
(Shahram et. al., 2011). There are known problems
with such approaches. First of all, partial overlap
causes PCA based alignment problematic whereas
ICP requires good initial rough alignment. Also the
standard form of ICP is not immune to errors in the
geometry, though robust extensions to ICP exists
(Fitzgibbon, 2001). To overcome this problem,
people applied various 3D depth based local features
inspired by their RGB based sisters (Bronstein et.
al., 2010). However, all those approaches suffer in
case of degenerate surface geometry. For example in
a planar scene, all of the above approaches will fail.
A known method to stabilize degenerate
geometric configurations is to introduce RGB
information during registration, e.g. (Craciun et. al.,
2010). We build our system on local intensity
features which will introduce robustness against lack
of geometric variation and overlap while speeding
up the registration. Such local features have been
widely studied (Tuytelaars and Mikolajczyk, 2010)
which was initially popularized by (Lowe, 2004).
Work by (Wu et.al., 2008) uses depth information to
estimate 3D local image features which can be used
for 3D registration, however has the requirement of
rendering 3D model in different directions. Our
Depthscale method can be used in conjunction with
any available feature detection utility as long as they
give a invariant support area for the feature.
3 SYSTEM
The system follows the standard envelop which is
typically used in 2D image matching and mosaicing.
The following procedure is looped as many times till
all the 3D scans are registered to a global model.
Step 1: Detect local features in the RGB images
of two 3D scans.
Step 2: For each feature in first image, find knn
neighbours in the second image.
Step 3: Use Depthscale and/or Lowe’s second
nearest neighbour technique to decrease the false
matches.
Step 4: Use RANSAC and 3-point 3D
registration algorithm to robustly estimate 3D rigid
transformation.
Step 5: Apply the estimated transformation to the
second scan and merge it with the previous overall
3D model collected so far.
The system is bootstrapped with two 3D scans
and new 3D scans are added incrementally to the
current reconstruction. Currently it is assumed that
the 3D scans to be registered are ordered in a way
that consecutive shots overlap. For local features
SURF (Bay et. al., 2008) detector and descriptor
package and for knn search FLANN (Muja and
Lowe, 2009) library of (opencv, 2013) library is
used. Below describes the other sub-components
while leaving Depthscale method to the last since it
is the main novelty of the work.
3.1 RANSAC
RANSAC (Fischler and Bolles, 1981) is a classical
robust estimation technique which eliminates
outliers and keeps geometrically consistent data in
an over constrained setting. By sampling minimal
number of data elements to describe the target
parametric model, it reaches a stable solution which
gives the highest number of inliers. The classical
analysis states that the required number of iterations
to guarantee a good solution with a certain
probability depends on the inlier ratio of the data set.
However, knowing that data is noisy itself, for good
estimation we would like to have as many data
points as possible. Hence we prefer to keep both the
inlier ratio and number of inliers high in a system.
Depth-ScaleMethodin3DRegistrationofRGB-DSensorOutputs
471

3.2 3D Rigid Transformation
Estimation
The main parametric model we want to fit to our
data is 3D rigid transform which can minimally be
estimated with 3 points in 3D space. Since we know
the 3D location (with respect to local frame) of local
features that are detected in the images, we can
directly feed them into our transformation estimation
method. We used SVD-based method (Eggert, 1997)
to estimate this rigid motion. It is a flexible method
that can both estimate the minimal 3-point
configuration required by RANSAC and n-point
case.
3.3 Lowe’s Second Nearest Neighbour
Method
As described by (Lowe, 2004) due to repeating
patterns and various geometric deformations
different features may look like each other hence the
closest match is not always the right match. In order
to decrease the number of such outliers, after
computing knn (k=2) neighbours, he proposed to
check the similarity of second closest neighbour to
the first. It is expected that the second closest
neighbour must be far for correct matches. This
measure of “closeness” is actualized by a threshold
between 0 and 1. Thresholds which are slightly less
than 1 means that the system almost always take the
closest feature as a match, practically making the
measure ineffective. On the other hand thresholds
towards 0 result in a paranoid measure which almost
finds no match. From now on we will call this
method shortly Lowe’s measure.
3.4 Depthscale Method
This is the main contribution of the paper. Similar to
Lowe’s measure we propose a new method to
decrease the false matches in a match-set which is
simple to compute. Assuming the 3D scans are taken
from the same sensor, we can ignore the effects of
RGB cameras internal calibration matrix and state
that the following value:
ScaleDepthDS *
(1)
represents the scale of the feature’s support area in
3D world where feature’s depth info comes from
the 3D sensor and scale is the size of the support
area of the feature on the intensity image. The
equation directly results from inverse application of
perspective projection. The features that belong to
same 3D point can be considered to have same DS.
This measure can be applicable for many feature
detectors which returns a invariant support area. In
contrast to long feature descriptors (e.g. SIFT is a
128 byte vector), Depthscale can be represented with
a simple integer which makes it more efficient to
compare. Also since scale information it
encapsulates is not related to intensity based feature
descriptor, it gives extra information that can be
exploited during matching. However due to its
simplicity it would not be as descriptive as intensity
features.
Figure 1: Typical NDSD distribution for a test set.
4 EXPLOITING DEPTHSCALE
INFORMATION
Different mechanisms of deploying Depthscale
information for the purpose of more accurate feature
matching can be thought of. In the first following
subsection we will describe our basic approach to
compare DS values given a feature match. In the
second sub-section we will describe different ways
to combine it with intensity based descriptors.
4.1 Comparing Depthscale Values
Noise needs to be taken into account in any robust
vision system. Looking at Eq. 1, any error in number
of pixels in a fixed image scale will be multiplied by
the depth of the feature. Hence we must take into
account the magnitude of the Depthscale while
comparing differences. Considering high depths and
big scales will give higher errors due to
multiplication, we propose normalizing the DS
difference with average DS of the compared values
in a feature match would give stable results. Below
formulation describes the normalized Depthscale
distance (NDSD) between two features of a single
match:
21
21
DSDS
DSDS
NDSD
(2)
VISAPP2014-InternationalConferenceonComputerVisionTheoryandApplications
472

Equation 2 shows NDSD distribution of the inliers
taken from an experiment (without taking the
absolute value). Different test sets result in similar
histograms. As can be seen NDSD=0.15-0.2 seems
to be a good threshold to eliminate outliers.
4.2 Combining Depthscale and Lowe’s
Measure
In its simplest form Depthscale method can be a
simple efficient way to increase the quality of the
match-set. However it would be desirable to
combine Lowe’s measure and Depthscale method to
increase matching performance. Here we will focus
on simplest way of fusion, leaving the more
advanced approaches to another work. Since there
are already tools to find knn set for intensity
features, we introduce the Depthscale measure to
this pipeline. After finding the knn neighbourhood in
intensity feature space, we apply Depthscale
elimination for closest neighbours with a certain
threshold. After that Lowe’s measure is applied. In a
sense, we filter the match-set first with Depthscale
method, than Lowe’s measure, resulting in an
“AND” operation.
5 PRACTICAL OBSERVATIONS
Finding 3D locations of local feature points relative
to sensor coordinate system is fundamental in our
approach. However Kinect’s depth sensor and RGB
sensor are separated which requires a sort of
alignment between them. Microsoft Kinect SDK
provides a function that aligns the depth frame on
the rgb frame. However as empirically observed,
that function does not provide a robust alignment
(especially depth values which are less than 1
meter). Therefore we decided to map the all the x, y
and depth points on the depth frame through pre-
calculated calibration matrices. The transformation
requires applying inverse internal calibration matrix
of the depth camera, 3D rigid transformation
between two sensor frames, and internal calibration
matrix of the RGB sensor.
Kinect’s depth sensor’s noise character is worth
mentioning. It is basically a structured light
technique where the projector and the sensor is
separated with a fixed baseline. Hence one factor
affecting the noise is the distance of the target: as the
observed location is further from the sensor, depth
measurements have higher noise. Also Kinect
applies an interpolation technique for the points that
lie within the dark regions of the structured light
image. In combined with above, different geometric
and reflectance characteristics of surface may result
in very spiky errors. A 2 cm of RANSAC threshold
seems to suffice to deal with such outliers
6 EXPERIMENTS
As a novel approach we cast the problem of
removing outliers from a match-set as “binary
classification” problem, taken from machine
learning field. Indeed what Lowe’s measure does is,
given a candidate match, checking the second
nearest neighbour to mark it as inlier and outlier. In
order to analyze that way, ground truth information
is needed. Typically this is done manually in
machine learning problems. However since we can
have hundreds of matches given a pair of scans, we
approximated this procedure by using all the
candidate matches in an excessive RANSAC loop
and detected inliers/outliers. This procedure might
include one or two false positives or true negatives
in the resultant ground truth but such amounts would
have minimal effect.
We showed the effects of different thresholds for
Lowe’s measure, pure Depthscale method and
combined approach as a Receiver Operating
Characteristics (ROC) curve. ROC curve is classical
mechanism to show the performance (true positive
vs false positive) of a binary classifier for different
threshold parameters. In our case inliers and outliers
are labeled as positive and negative respectively.
However we must note that there is no training
happening here. The thresholds determine the
classifier directly.
We tried to take experiment data in environments
with different characteristics. Fig. 2 shows images
from 4 different test sets. Each test set has 5 (but
only 2 are used in the graphs) scans and they are
taken with a Kinect device from different angles and
distances. The top row specifically aims to represent
planar scenes, whereas the third row contains strong
non-planar human body.
The ROC curves in Fig. 3-6 show that pure
Depthscale measure gives better true positive ratio
for high false positive ratios. Which means that if we
would like to easily eliminate many outliers while
keeping almost all inliers, pure Depthscale would
give better results. For example a workstation based
modelling application would choose that operating
mode due to requirement of many inliers for better
accuracy. However for lower false positive ratios
Lowe’ approach gives higher positive ratios. This is
Depth-ScaleMethodin3DRegistrationofRGB-DSensorOutputs
473
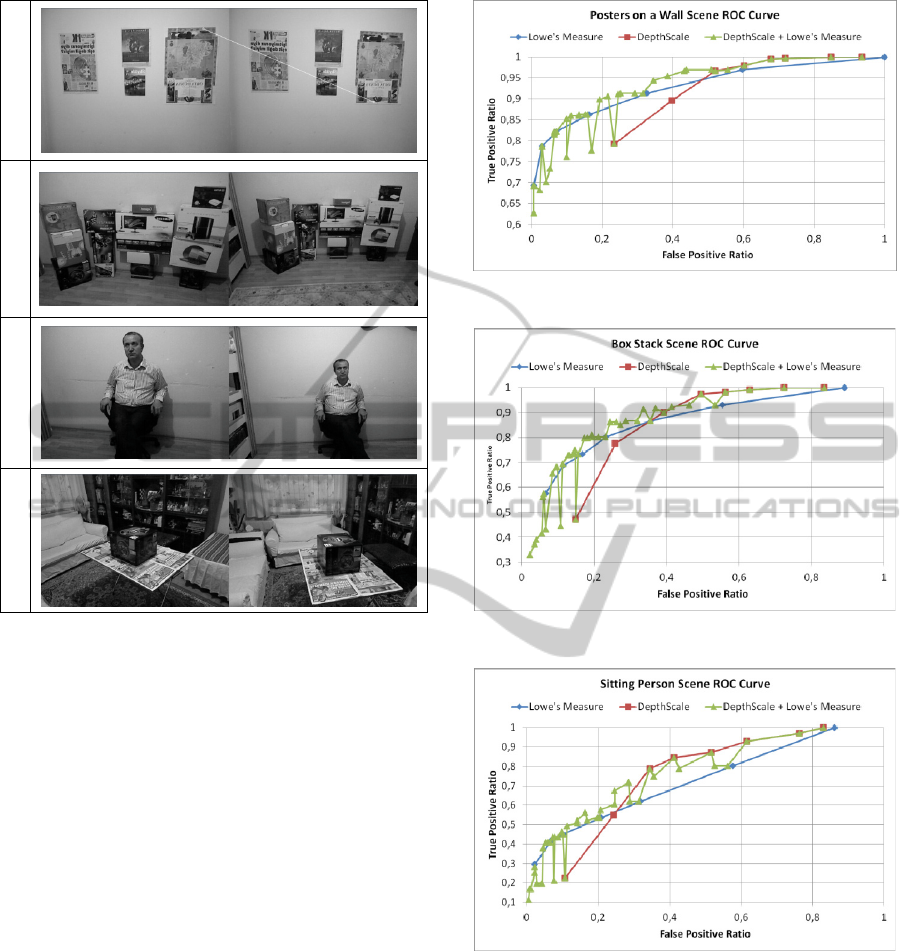
Posters on a wall Boxes Stack Sitting Person Living Room
Figure 2: Examined RGB Frames from 4 different data
sets.
more suitable for applications which cannot tolerate
high outliers in the data in order not to waste time in
many RANSAC iterations. A robotics localization
routine may opt for this operating mode. The
combined approach converges to the best individual
approach for different ends of the ROC curve,
sometimes even beating them. However for left ends
of the curve, it gives sporadic results for certain
thresholds and converges to the worse approach
occasionally. A deeper look shows that inferior
results are caused by unrealistically tight thresholds
for Depthscale such as 0.05. As a note, ROC figures
are created by sampling various thresholds (for
Lowe’s measure between 0,65 and 1,0 and for
Depthscale 0,05 and 0,6). Fig. 7 shows different
views of registration results for “Sitting Person”
experiment using all 5 frames. Note that no ICP like
refinement or surface reconstruction techniques are
utilized here.
7 CONCLUSIONS
We introduced a simple local image feature based
Figure 3: ROC curve of “Posters on a wall” experiment.
Figure 4: ROC curve of “Box Stack” experiment.
Figure 5: ROC curve of “Sitting Person” experiment.
3D registration system for Kinect-like sensor. It is
designed to be built on available open source
systems. We also introduced a new measure called
Depthscale measure to increase the matching
performance by exploiting the fact that depth
measurements are available for the detected features.
Experiments are presented to show the usefulness of
this new measure. Eliminating outliers from a match
set is cast as a classification problem and hence
analysis is done through familiar ROC curves.
VISAPP2014-InternationalConferenceonComputerVisionTheoryandApplications
474
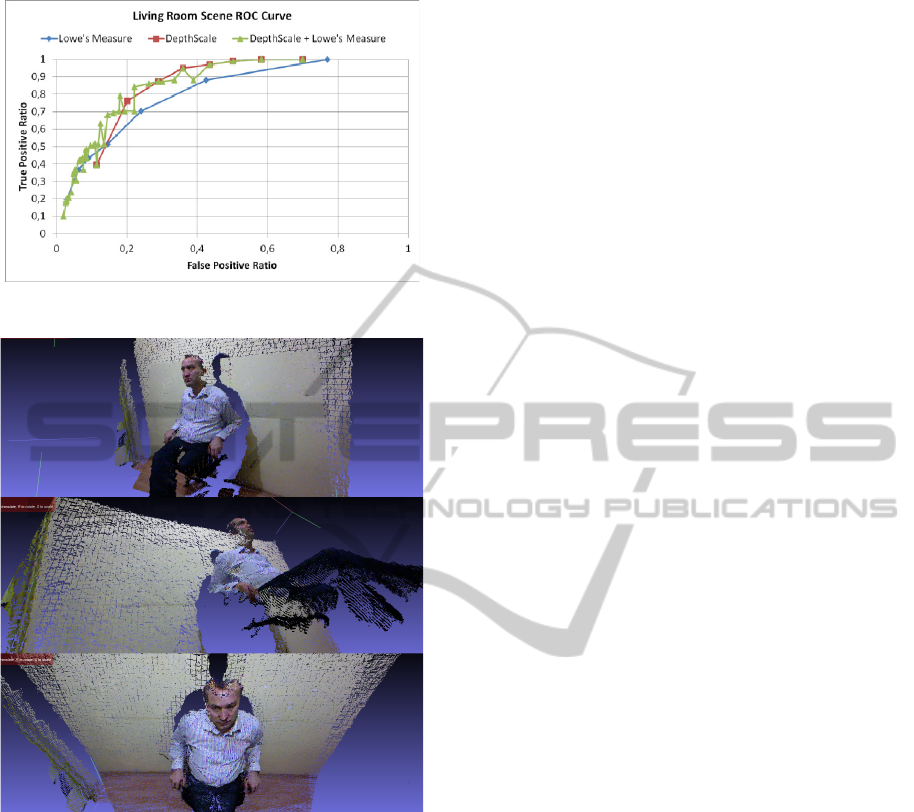
Figure 6: ROC curve of “Living Room” experiment.
Figure 7: The rendering of overall registered 3D model for
Sitting Person experiment from different angles.
REFERENCES
Besl, P. J., McKay, N. D., 1992. A Method for
Registration of 3-D Shapes. In IEEE PAMI 14, 2,
pp.239-256.
Shahram et al., 2011. KinectFusion: Real-time 3D
Reconstruction and Interaction Using a Moving Depth
Camera. In SIGGRAPH.
Fitzgibbon, A. W., 2001. Robust Registration of 2D and
3D Point Sets. In BMVC.
Bronstein et al., 2010. SHREC 2010: Robust Feature
Detection and Description Benchmark. In
Eurographics Workshop on 3D Object Retrieval.
Craciun, D., Paparoditis, N., Schmitt, F., 2010. Multi-view
Scans Alignment for 3D spherical Mosaicing in Large-
scale Unstructured Environments. In CVIU 114 pp.
1248–1263.
Tuytelaars, T., Mikolajczyk, K., 2010. Local Invariant
Feature Detectors: A Survey. In Foundations and
Trends® in Computer Graphics and Vision 3(3) pp.
177-280.
Lowe, D., G., 2004. Distinctive Image Features from
Scale-invariant Keypoints. In IJCV, 60( 2), pp. 91-
110.
Wu, C., Clipp, B., Li, X., Frahm, J-M, Pollefeys, M.,
2008. 3D Model Matching with Viewpoint Invariant
Patches (VIP). In CVPR.
Bay, H., Ess, A., Tuytelaars, T., Gool L.V., 2008.
Speeded-Up Robust Features (SURF). In CVIU 110,
pp.346–359.
Muja, M., Lowe, D. G., 2009. Fast Approximate Nearest
Neighbors With Automatic Algorithm Configuration.
In VISAPP.
Opencv, 2013. http://opencv.willowgarage.com.
Fischler M. A., Bolles, R. C., 1981. Random Sample
Consensus: A Paradigm for Model Fitting with
Applications to Image Analysis and Automated
Cartography. In Commun. ACM, 4(6) pp.381–395.
Eggert, D., W., Lorusso, A., Fisher, R. B., 1997.
Estimating 3-D rigid body transformations: a
comparison of four major algorithms. In Machine
Vision and Applications 9: 272–290.
Depth-ScaleMethodin3DRegistrationofRGB-DSensorOutputs
475
