
Approximate Image Matching using Strings of Bag-of-Visual Words
Representation
Hong Thinh Nguyen, Cecile Barat and Christophe Ducottet
Universit´e de Lyon, F-42023, Saint-
´
Etienne, France
CNRS, UMR 5516, Laboratoire Hubert Curien, F-42023, Saint-
´
Etienne, France
Universit´e de Saint-
´
Etienne, Jean-Monnet, F-42023, Saint-
´
Etienne, France
Keywords:
Edit Distance, String of Histograms, Bag-of-Visual Words, Image Classification.
Abstract:
The Spatial Pyramid Matching approach has become very popular to model images as sets of local bag-of-
words. The image comparison is then done region-by-region with an intersection kernel. Despite its success,
this model presents some limitations: the grid partitioning is predefined and identical for all images and the
matching is sensitive to intra- and inter-class variations. In this paper, we propose a novel approach based on
approximate string matching to overcome these limitations and improve the results. First, we introduce a new
image representation as strings of ordered bag-of-words. Second, we present a new edit distance specifically
adapted to strings of histograms in the context of image comparison. This distance identifies local alignments
between subregions and allows to remove sequences of similar subregions to better match two images. Ex-
periments on 15 Scenes and Caltech 101 show that the proposed approach outperforms the classical spatial
pyramid representation and most existing concurrent methods for classification presented in recent years.
1 INTRODUCTION
Local feature histograms are widely employed to rep-
resent visual contents in various areas of computer vi-
sion. In particular, histograms of visual words based
on SIFT features, in the well-known bag-of-words
model, have proven to be very powerful for image
classification or retrieval tasks (Sivic and Zisserman,
2003). However, such histograms only use a global
information and discard spatial distribution of fea-
tures. The trend in recent years is towards the use
of a set of local histograms rather than only one to en-
code spatial information and provide richer represen-
tations. An image is partitioned into regions, using
either a segmentation algorithm (Chen et al., 2009) or
a division according to a grid pattern (Lazebnik et al.,
2006; Battiato et al., 2009; Cao et al., 2010). Each re-
gion is then described with a local feature histogram.
In this context, the most significant work is
certainly the ”Spatial Pyramid Matching” approach
(SPM), which gave excellent classification results on
different image collections, as 15 Scenes and Caltech
101 (Lazebnik et al., 2006). SPM consists in divid-
ing an image into predefined regular grids of differ-
ent scales (1×1,2×2,4×4,..) and computing a bag-
of words histogram in each cell. The different his-
tograms are then ordered and combined with appro-
priate weights into a unique vector to form the final
image representation. Two images are then compared
using an intersection kernel. Since this approach was
very efficient, it has received great research attention.
The different aspects of the model have been investi-
gated for the purpose of improving performance lead-
ing to systems that reach state-of-the-art results in the
domain. For instance, some authors focus their atten-
tion on the coding of local visual features to improve
the local bag-of-words representation (Yang et al.,
2009a; de Avila et al., 2013). Sparse coding asso-
ciated with max pooling have shown good results in
(Yang et al., 2009a). Other works focus on optimiz-
ing the partitioning of images. In (Sharma and Jurie,
2011), Sharma et al. proposeto learn the best discrim-
inative grid splitting optimizing a given classification
task. In (Viitaniemiand Laaksonen, 2009), Viitaniemi
et al. compare techniques of soft tiling and hard tiling.
Furthermore, some works propose to learn or adapt
weights rather than using fixed ones, as in (Harada
et al., 2011). All these kinds of approaches often as-
sociate the definition of new kernels for image com-
parison (He et al., 2008; Viitaniemi and Laaksonen,
2009; Harada et al., 2011).
Most of these SPM-based methods perform well
345
Nguyen H., Barat C. and Ducottet C..
Approximate Image Matching using Strings of Bag-of-Visual Words Representation.
DOI: 10.5220/0004676803450353
In Proceedings of the 9th International Conference on Computer Vision Theory and Applications (VISAPP-2014), pages 345-353
ISBN: 978-989-758-004-8
Copyright
c
2014 SCITEPRESS (Science and Technology Publications, Lda.)
though they use rigid matching between correspond-
ing regions limiting their invariance to geometric
transformations. Indeed they assume that similar
parts of a scene or an object generally lay in simi-
lar regions of the space. In the case of two images
whose visual elements are located at different posi-
tions or have different extensions as on Figure 1, the
matching fails while the visual content is quite sim-
ilar. These methods actually compute an approxi-
mate global matching of the visual words among im-
ages. Our intuition is that computing an approximate
matching of the histograms would make the method
more robust.
One popular category of methods for approximate
matching uses the edit distance. The standard edit
distance is a string metric for measuring the differ-
ence between two sequences. It is defined as the min-
imum number of edit operations, i.e. insertion, dele-
tion, substitution, which are required to transform one
string to the other (Wagner and Fischer, 1974). It has
the advantage of providing the matching of symbols
located at different positions in the string taking into
account the order of these symbols and some costs af-
fected to each edit operation. Moreover, there exists
an efficient calculation algorithm based on dynamic
programming. In the image domain, this distance has
been successfully used for text recognition applica-
tions (Seni et al., 1996; Christodoulakis and Brey,
2009; Khurshid et al., 2009) or shape matching (Klein
et al., 2001). A key question is the representation of
the visual content as strings.
In this paper, we propose a new method to rep-
resent images as strings of histograms and, to com-
pare such representations, we introduce a string ker-
nel that uses an extended edit distance tailored to the
context of local histograms comparison. The his-
tograms can correspond to local SIFT bag-of-words
computed with recent developments as sparse cod-
ing. For each given pair of images, our distance not
only takes into account the similarity between pair-
wise regions (with the substitution cost) as in the
standard SPM model, but also integrates information
about similarity between neighbouring regions (with
the insertion/deletion cost). It allows to identify local
alignments between subregions or groups of similar
subregions in images. With the proposed approach,
the number of subregions for different images may
vary and is considered according to the visual con-
tent, which brings flexibility to the matching process
in comparison with previous mentioned methods. We
validate our approach on two well-knowndatasets: 15
Scenes and Caltech 101.
There has been some related work in the literature
aiming to take into account topological relationships
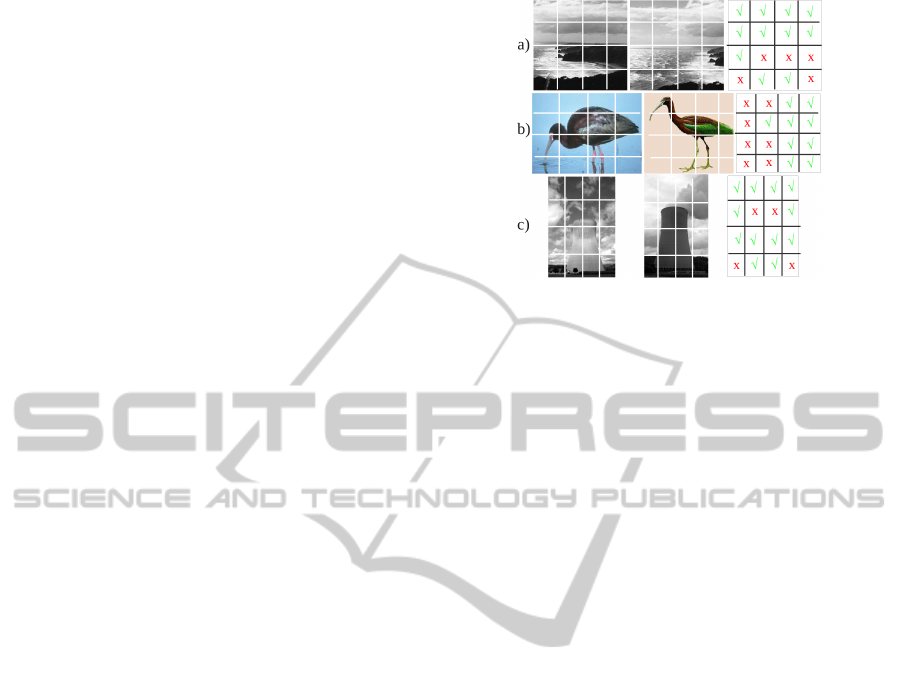
Figure 1: Examples of intra-class pairwise mismatches due
to changes in viewpoint and moves of a scene component:
(a) horizontal translation leading to additional sea regions
and removal of land regions (b) move of bird’s head lead-
ing to vertical displacement of similar regions on the left of
the image (c) scale variation leading to additional sky re-
gions replacing top chimney ones. Images are taken from
15 Scenes and Caltech 101 datasets.
between regions (Iovan et al., 2012; Sharma and Ju-
rie, 2011) or using an edit distance between strings
of bag-of-words (Ballan et al., 2010). The work of
(Yeh and Cheng, 2011) is the most similar to our ap-
proach. However,their representation is questionable.
They build strings from the 16 histograms of the sec-
ond level of a spatial pyramid, following a raster scan.
Thus, consecutive histograms in the strings may have
no spatial relationships. Moreover, they use fixed
costs for insertion/ deletion operations which does not
allow to adapt the image partitioning as we propose.
Also, they use a single level of the pyramid while we
combine different ones.
The remainder of this paper is organized as fol-
lows. In section 2, we discuss the limits of the SPM
model and present our model of images as strings of
histograms. In section 3, we develop the edit distance
adapted to strings of histograms and derive an edit
kernel. Section 4 describes experiments and results
of our edit distance on image classification tasks. We
conclude in Section 5.
2 IMAGE REPRESENTATION
In this section, we discuss the limitations of pairwise
matching using spatial pyramid scheme, then we in-
troduce our image representation model.
2.1 Pairwise Matching Limitations
In SPM-based methods, a similar grid partitioning
scheme is applied to all images. This approach is
VISAPP2014-InternationalConferenceonComputerVisionTheoryandApplications
346
not optimal to represent the image layout in two re-
spects. First, using a predefined partitioning pattern,
independently from the content, is sensitive to intra-
class variations. Figure 1 illustrates changes in view-
point, scale and a displacement of part of an image
with level 2 of the spatial pyramid. These changes
cause mismatches between pairwise regions due to
local misalignments between images, while contents
are quite similar. Note that such changes can often be
seen as adding (or removing) regions similar to their
neighbourood. For instance, in the case of Figure 1(a)
and Figure 1(c), sea regions replace coast regions and
sky regions replace the top of the nuclear chimney due
to landscape continuity.
Second, partitioning images similarly along both
directions may not always be the best strategy to de-
scribe the visual content. Indeed, in images, there ex-
ists a natural sequencing of objects or entities within
objects. It is possible to find a principal direction
along which the projection of local features may con-
vey information about the image context or capture
the essence of the form of an object. Intuitively, as
suggested in (Cao et al., 2010), in natural scenes, ver-
tical or horizontal directions can plausibly describe
relationships among local features. For instance, the
sky is above trees, and trees are above grass. For ur-
ban scenes, in (Iovanet al., 2012), the authors propose
similarly to replace the SPM grid division with divi-
sions along the vertical axis to better take into account
the composition of this kind of images. For object im-
ages, as proposed in (Tirilly et al., 2008), the major
axis of an object can be obtained from the first prin-
cipal component in a principal component analysis.
Distribution of local features along this major axis is
similar whatever the orientation or scale the object is.
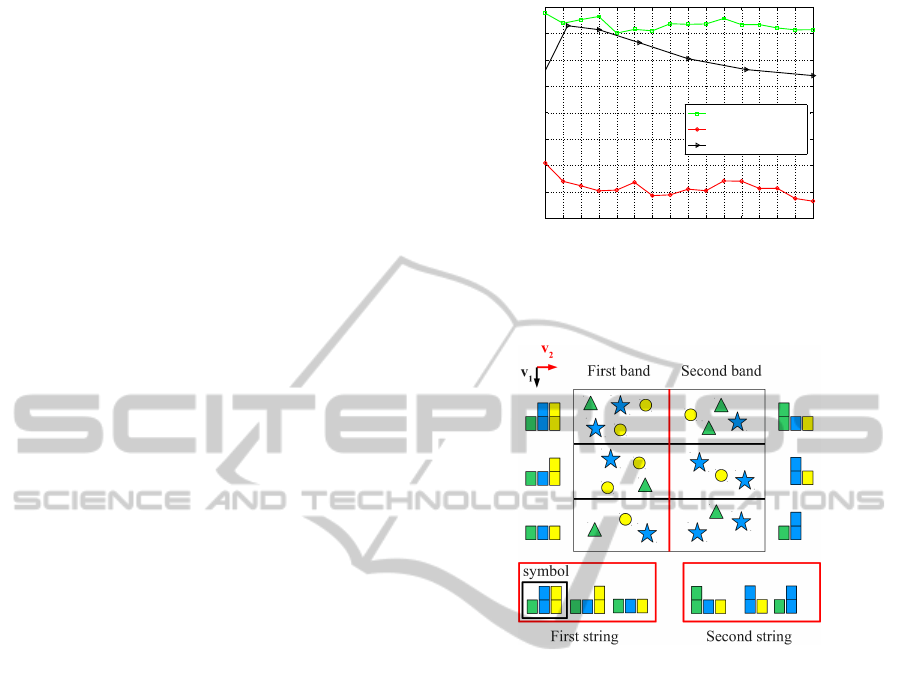
The graphs of Figure 2 highlight the two men-
tioned limitations of SPM on the 15 Scenes dataset.
The classification accuracy is plotted with respect to
the number of local regions, using either a grid par-
titioning or divisions along one axis, vertical or hor-
izontal. Each region is described with a SIFT bag-
of-words obtained following the protocol of (Lazeb-
nik et al., 2006) and a vocabulary of 100 words. The
classification accuracy was computed with intersec-
tion kernel SVM and 10-fold cross-validation. We
observe that increasing the number of regions first im-
proves the classification accuracy, but when the num-
ber of regions is too high, the accuracy decreases.
It is explained by the fact that the number of mis-
matches is all the greater that the number of regions
increases. Moreover, using a vertical directional par-
titioning gives higher results than a grid partitioning
for this dataset composed mainly of natural scenes.
4 8 12 16 20 24 28 32 36 40 44 48 52 56 60 64
73
74
75
76
77
78
79
80
81
Number of regions
Accuracy
Horizontal division
Vertical division
Grid
Figure 2: Classification accuracy versus number of local
regions for the 15 Scenes dataset using pairwise matching
and different partitioning schemes: grid, vertical divisions
or horizontal ones.
Figure 3: Example of an image representation as two strings
of histograms.
2.2 Defining Strings of Histograms
We propose a representation of images based on
strings of bag-of-words to better describe the intrin-
sic order of regions in a given direction. First, we
choose an orthogonal basis v
1
,v
2
that may best rep-
resent the image content. We divide an image into B
bands of same width along direction v
2
. Then, each
band is subdivided into N subregions of same size,
along direction v
1
. For each band, traveling along v
1
provides an ordered string of subregions. Figure 3 il-
lustrates the construction of the strings associated to a
two band case.
In this paper, we only consider the case of vertical
and horizontal axes. The vertical direction being re-
tained as the principal direction v
1
. Indeed, as shown
after several evaluations over different datatsets, we
found that the vertical direction always provides the
best results (see Section 4). However, the method can
be generalized to any other basis.
ApproximateImageMatchingusingStringsofBag-of-VisualWordsRepresentation
347

2.3 Pyramidal Strategy
In practice, the number of bands B and the number of
regions per band N is fixed for all images and deter-
mined according to the dataset used. Note that these
parameters do not play the same role. Parameter B
defines the main image partitioning and plays a simi-
lar role as the division parameters used in (Lazebnik
et al., 2006). Thus, we can choose either to fix its
value to a power of 2 (e.g. B = 1,2 or 4) or to use a
pyramidal strategy considering all the strings obtained
for several splittings obtained with B = 2
0
,... , 2
L−1
where L is the number of pyramid levels. Parameter
N defines the size of the strings. In our edit distance-
based approach, this parameter is not too sensitive if
it is large enough, as shown in Section 4.
3 AN EDIT DISTANCE FOR
STRINGS OF HISTOGRAMS
In this section, we present an extended edit distance
tailored to compensate for mismatches limiting per-
formances of rigid matching approaches, as explained
previously. We first recall the standard edit distance.
3.1 The Standard Edit Distance
The standard edit distance allows to compute the op-
timal alignment of two strings. In its simple form, the
edit distance between two strings X = x
1
x
2
... x
N
and
Y = y
1
y
2
... y
M
is defined as the minimum cost of all
sequences of edit operations which transform X into
Y. The permitted edit operations with their associated
cost functions are as follows:
• insertion of a symbol y
j
into X with cost c
ins
(y
j
)
• deletion of a symbol x
i
into X with cost c
del
(x
i
)
• substitution of a symbol x
i
with the symbol y
j
with cost c
sub
(x
i
,y
j
)
Computing this distance can be formulated as an
optimization problem and can be carried out with a
dynamic programmingalgorithm. The algorithm con-
sists in computing a D(N,M) matrix, where D(i, j)
represents the minimum cost of transforming X =
x
1
x
2
... x
i
into Y = y
1
y
2
... y
j
, with allowable edit op-
erations mentioned above. The computational com-
plexity is proportional to the product of the length of
the two strings, i.e. in O(N× M). The computation is
carried out using the following recurrence relation:
D
0,0
= 0
D
0, j
= D
0, j−1
+ c
ins
(y
j
), j = 1. . . N
D
i,0
= D
i−1,0
+ c
del
(x
i
), i = 1. . . M
D
i, j
= min
D
i−1, j
+ c
del
(x
i
),
D
i, j− 1
+ c
ins
(y
j
),
D
i−1, j−1
+ c
sub
(x
i
,y
j
)
,
i = 1. . . M, j = 1. . . M
(1)
3.2 A New String Matching Distance
In our approach, symbols are histograms of visual
words. Let us recall that our aim is to compute an
approximate matching between strings of histograms
in order to correct mismatches due to fixed grid parti-
tioning seen in Section 2.1. By definition, the edit dis-
tance aims to find the optimal alignment between two
strings, and thus allows naturally to correct local or
global misalignment due to translation of viewpoint
modifications between two images. An immediate
strategy is to use fixed costs for insertion and deletion
and a ground distance between histograms for substi-
tution. To go further, we propose to adapt insertion
and deletion costs to the local context. The goal is
to virtually adjust the grid partitioning during the im-
age comparison and compensate for mismatches that
occur with homogeneous parts of a scene or object
splitted in different regions. Our approach is to use
deletions and insertions to get rid of repetitions of
similar symbols respectively in the input string (dele-
tion) or in the output string (insertion), relatively to
the other string. More precisely, during the alignment
of the two strings, if one symbol is more similar to its
following than to the corresponding one in the other
string, it will be removed. Formally, this rule comes
to define costs functions as:
c
sub
(x
i
,y
j
) = d(x
i
,y
j
) (2)
c
del
(x
i
) = d(x
i
,x
i+1
) (3)
c
ins
(y
j
) = d(y
j
,y
j+1
) (4)
where d is any histogram distance. We use ℓ
1
distance
in the following.
The new edit distance is then computed by trans-
fering these specific cost functions into the original
dynamic programming algorithm.
3.3 Examples
We first illustrate our string matching distance with
a toy example (Figure 4). This example simulates
a viewpoint change similar to the real case of Fig-
ure 1(c). The distance matrix gives minimum dis-
VISAPP2014-InternationalConferenceonComputerVisionTheoryandApplications
348
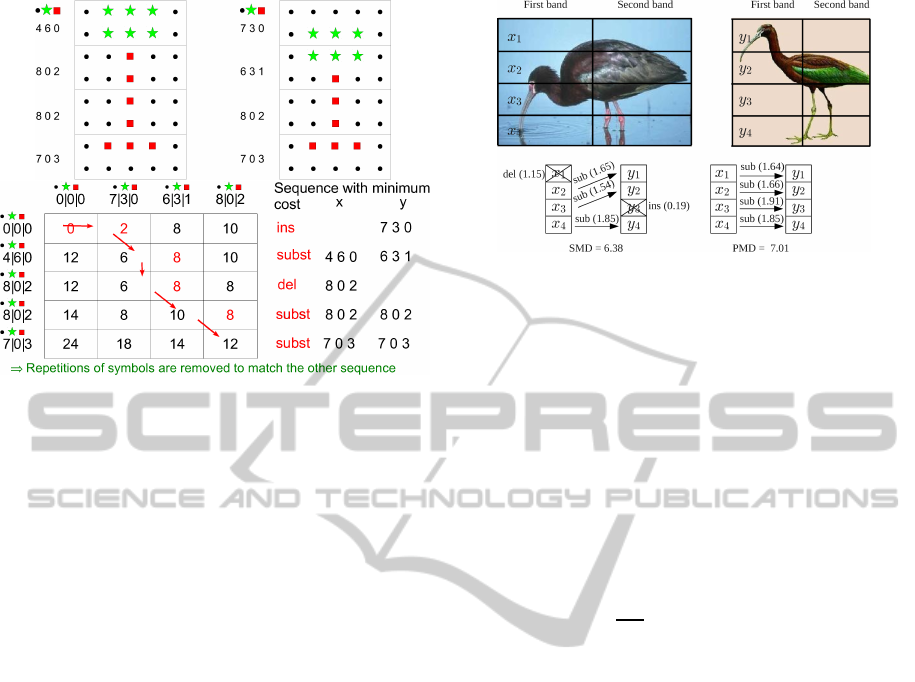
Figure 4: A toy example to illustrate the matching using
SMD for the single band case.
tances D
i, j
and arrows show the sequence with min-
imum cost, detailed on the right. To well under-
stand the values, we detail calculations of three cells.
First, the cell D
0,1
equal to 2 gives the insertion
cost of symbol 7|3|0, i.e. d(7|3|0,6|3|1), while the
cell D
1,0
is the deletion cost of symbol 4|6|0, i.e.
d(4|6|0, 8|0|2). The value of D
1,1
is the minimum
of D
0,1
+ d(4|6|0, 8|0|2), D
1,0
+ d(7|3|0, 6|3|1) and
D
0,0
+ d(4|6|0, 7|3|0), i.e. min{14,14, 6} = 6. As
for the computation of D
1,1
, each minimum distance
takes into account similarity between neighbouring
regions and direct pairwise similarity between corre-
sponding regions, allowing to remove repetitions of
symbols when necessary to adapt to the other string.
In our toy example, the resulting edit sequence comes
to consider the two similar regions 8|0|2 as a unique
one that matches the similar one in the second image.
We now give a real-case example seen in Figure 1(b).
As shown on Figure 5, two bands of four regions are
used. The string matching sequence obtained for the
first band is given showing a better alignment than
with direct pairwise matching. Here, insertions and
deletions enable to deal with a change of position of
the head of the bird. In each case, region matchings
that we have drawn correspond to the real computed
edit scripts. These examples confirm the interest of
our approach to better deal with possible changes in
object size, position or shape in the direction of the
string.
3.4 Image Comparison Kernel
To be able to use a standard Support Vector Machine
(SVM) algorithm for image classification, we define
two kernels for measuring the similarity of two im-
Figure 5: Real example of SMD matching for a two-band
case.
ages with our edit distance: one for the single level
image representation and one for the pyramidal one.
When considering one level of a pyramid with B
bands of N symbols, the comparison of two images
amounts to compute the distance between every 2-by-
2 corresponding strings and sum the B distance re-
sults. This distance is denoted d
B
SMD
. In the pyramidal
case, several levels of splitting are combined using a
weighted sum of d
B
SMD
distances leading to the L lev-
els pyramidal SMD distance d
P(L)
SMD
. Formally, these
distances between two images I and J are given by:
d
B
SMD
(I ,J ) =
1
BN
B
∑
b=1
d
SMD
(x
B
b
(N),y
B
b
(N)) (5)
d
P(L)
SMD
(I ,J ) =
∑
B∈{2
0
,...,2
L−1
}
α
B
d
B
SMD
(I ,J ) (6)
where x
B
b
(N) (resp. y
B
b
(N)) represents the bth string
of the B bands splitting of image I (resp. image J )
and α
B
are the weighting coefficients, chosen to be
here those proposed by (Lazebnik et al., 2006).
Applying these two distances in the classical
string edit kernel (Li and Jiang, 2005) leads to the fol-
lowing kernels:
K
B
SMD
(I ,J ) = e
−γd
B
SMD
(I ,J )
(7)
K
P(L)
SMD
(I ,J ) = e
−γd
P(L)
SMD
(I ,J )
(8)
where γ is a scaling coefficient chosen to ensure the
admissibility of the kernel for a given dataset.
4 RESULTS
In this section, we report experimental results on
two popular datasets: 15 Scenes and Caltech 101.
The motivation of these experiments is twofold: first
we study the influence of the parameters of our im-
age representation model on the classification accu-
racy. Second, we evaluate our edit matching method
ApproximateImageMatchingusingStringsofBag-of-VisualWordsRepresentation
349
1 2 3 4 5 6 7 8 9 10 11 12 13 14 15 16
72
74
76
78
80
82
84
Number of regions
Accuracy
B=1,Horizontal
B=1,Vertical
B=2,Horizontal
B=2,Vertical
B=4,Horizontal ...
B=4,Vertical
Pyramidal
(a) 15-scene
1 2 3 4 5 6 7 8 9 10 11 12 13 14 15 16
40
45
50
55
60
65
70
Number of regions
Accuracy
B=1,Horizontal
B=1,Vertical
B=2,Horizontal
B=2,Vertical
B=4,Horizontal ...
B=4,Vertical
Pyramidal
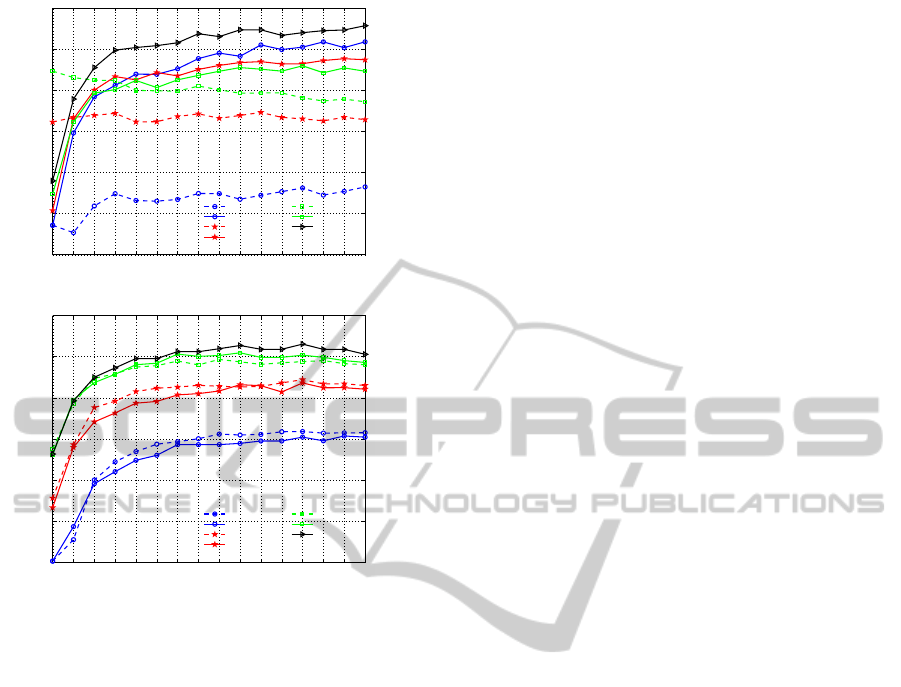
(b) Caltech-101
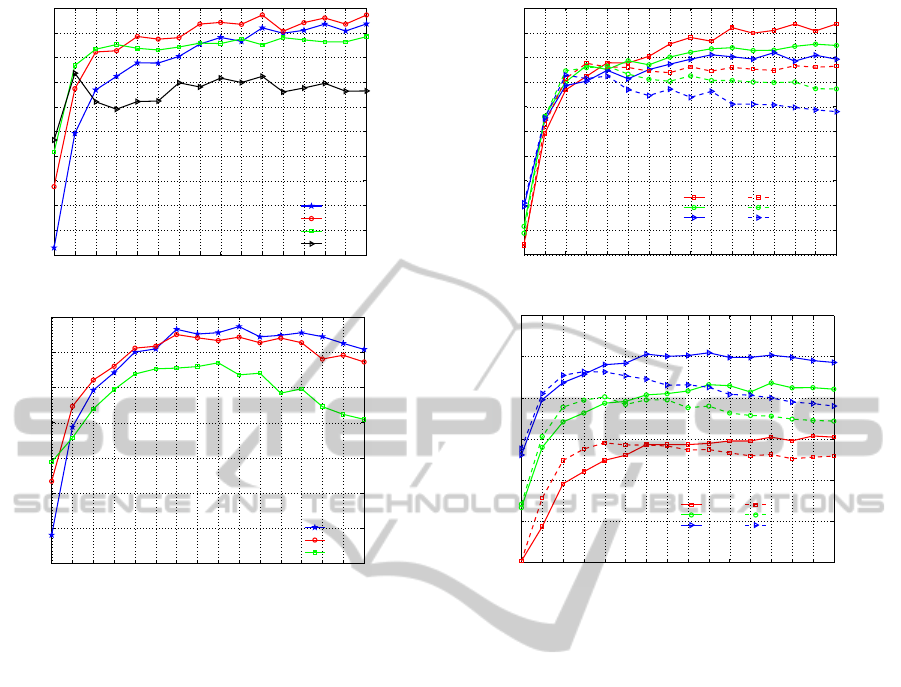
Figure 6: Classification performances for 15 Scenes and
Caltech 101 datasets with SMD under different number of
regions, number of bands and scanning directions.
against the pairwise matching approach, spatial pyra-
mid matching and other concurrent methods.
As mentioned previously, in experiments, the local
bag-of-words are computed as in (Lazebnik et al.,
2006). For classification, we apply a SVM classifier
using libSVM in a one-vs-all setting. Kernel matrices
are computed either with our edit kernels presented in
Section 3.4 or the histogram intersection kernel for
comparison purpose. With Caltech 101, we chose
randomly 30 images per class for training and up to 50
images per class for testing. With 15 Scenes, we train
on 100 random images per class and test on remain-
ing ones. Each experiment was repeated 10 times
with randomly selected training and testing sets. The
performance of all experiments are evaluated by the
mean accuracy over the 10 runs.
4.1 Influence of String Parameters
In our string based representation model, several pa-
rameters have to be set to compute classification re-
sults: the number of bands and the scanning direction,
the number of regions and the size of the vocabulary.
In this section, we study the influence of these param-
eters.
The classification accuracy is first computed with re-
spect to the number of regions per band from 1 to
16, varying the number of bands (B = 1, B = 2 and
B = 4) and the scanning direction (vertical or hori-
zontal). The vocabulary is then fixed to 100 words.
Results are presented on Figure 6.
Scanning Direction. The results for the two data sets
are different. For 15 Scenes dataset, all vertical case
graphs are above horizontal case ones. These results
confirm the intuition that the vertical direction in nat-
ural scenes provides a better characterization of the
image structure than the horizontal one, as discussed
in Section 2.2. For Caltech 101 dataset, differences
between the horizontal and vertical case graphs are
not that significant. It can be explained by the speci-
ficity of this collection where the objects of interest
take up most of the image and are approximately cen-
tered. Comparing objects along one or the other di-
rection does not really matter. Since on the overall
the vertical direction performs better, we keep this di-
rection in all subsequent experiments.
Number of Bands. Again, the results depend on the
collection. Indeed, considering the 1, 2 and 4 bands
cases, the results behave inversely. For 15 Scenes, re-
sults decrease as the number of bands increase, i.e.
one band is enough to get the best results while for
Caltech 101, it is preferable to use four bands. As pre-
viously, it is inherent to the type of images. Observing
a natural scene from top to bottom allows to identify
the content. Using two parallel vertical bands does
not conveymuch information. It even introduces con-
fusion because of redundancybetween bands, leading
to worst results. For objects, a finer look at the differ-
ent parts is necessary to identify them correctly.
It is worth noticing that for both datasets, a 2-level
pyramid approach clearly outperforms single level
splitting cases. This strategy is suitable to get the best
results at the cost of a higher dimension representa-
tion.
Number of Regions. Considering the influence of the
number of regions, the global evolution of all curves
is similar: the accuracy is almost monotonically in-
creasing with a stabilization for N = 8 for Caltech 101
and N = 10 for 15 Scenes. From this value, the re-
sults remain roughly constant or slightly better. The
highest accuracy is 66.53 % achieved with N = 13 for
Caltech 101, and 83.16 % with N = 16 for 15 Scenes.
But since performances were quite similar with lower
number of regions, it is preferable to use N = 8 or
N = 10 to reduce the computation time.
Vocabulary Size. To investigate the effect of the vo-
cabulary size, we fix the number of bands to the opti-
mal values obtained previously, i.e. B = 4 for Caltech
VISAPP2014-InternationalConferenceonComputerVisionTheoryandApplications
350
1 2 3 4 5 6 7 8 9 10 11 12 13 14 15 16
73
74
75
76
77
78
79
80
81
82
83
Number of regions
Accuracy
K=100
K=200
K=400
K=1000
(a) 15-scene
1 2 3 4 5 6 7 8 9 10 11 12 13 14 15 16
52
54
56
58
60
62
64
66
Number of regions
Accuracy
K=100
K=200
K=400
(b) Caltech-101
Figure 7: Influence of the vocabulary size.
101 and B = 1 for 15 Scenes. Figure 7 shows the
classification results for three vocabulary sizes 100,
200 and 400 as a function of N. For Caltech 101, the
best results are obtained with the smallest vocabulary
(k = 100) and we note that the accuracy is decreasing
over N for k = 200 or k = 400. For 15 Scenes, the
influence of the vocabulary size is low and the results
are slightly better for k = 200, but they are very close
to k = 100 for a large N. Obtaining the best results
for small vocabularies is unusual in the BoVW con-
text. This very interesting behavior is due to the prop-
erties of the edit distance: to benefit from insertions
and deletions, we must have enough similar symbols
and thus no too large histograms. Thus, a clear advan-
tage of our string based approach is to provide a more
compact representation capable to exploit the spatial
distribution of the visual information. In the follow-
ing experiments, we will keep a vocabulary of 100
visual words.
4.2 Spatial vs Pairwise Matching
Here, experiments are to verify the performance im-
provement by our string matching approach (SMD)
over a classic pairwise matching approach (PMD)
1 2 3 4 5 6 7 8 9 10 11 12 13 14 15 16
73
74
75
76
77
78
79
80
81
82
83
Number of regions
Accuracy
SMD, B=1
SMD, B=2
SMD, B=4
PMD, B=1
PMD, B=2
PMD, B=4
(a) 15-scene
1 2 3 4 5 6 7 8 9 10 11 12 13 14 15 16
40
45
50
55
60
65
70
Number of regions
Accuracy
SMD, B=1
SMD, B=2
SMD, B=4
PMD, B=1
PMD, B=2
PMD, B=4
(b) Caltech-101
Figure 8: Performance of SMD vs PMD.
when using a same partitioning. Figure 8 presents the
results, still keeping the optimal number of bands for
each dataset.
First, it is obvious that for both datasets, SMD is
always above PMD for N > 5 and any given split-
ting. As seen in Section 2.1, the greater the number of
regions, the greater the number of local mismatches,
leading to a decrease of performances of a pairwise
matching approach. With SMD, for large N, the accu-
racy stabilizes (Caltech 101) or slightly increases (15
Scenes). It proves that SMD naturally compensates
the local mismatches.
Note that our method SMD achieves better results
than those reported by Lazebnik et al (Lazebnik et al.,
2006) for the same datasets. Indeed, for a 200 vocabu-
lary size, we get 65.1 vs 64.6 for Caltech 101 and 82.0
vs 81.1 for 15 Scenes. These results are obtained re-
spectively for N = 7 and N = 14 with only 100 visual
words which gives a much more compact representa-
tion. Again, the matching is improved thanks to the
proposed insertion and deletion operations used in our
string edit distance.
ApproximateImageMatchingusingStringsofBag-of-VisualWordsRepresentation
351

4.3 Comparison with Existing Methods
In Table 1, the proposed method is first compared with
the concurrent techniques that use a single SIFT de-
scriptor and the original BoVW coding, i.e. BoVW
histogram (sum pooling) with a hard assignment for
visual words for fair comparison. These methods
are the original SPM method, SPM + co-occurrence
(combination of SPM and the spatial relationship in-
formation between visual words inside each image
(Yang and Newsam, 2011), sequence matching (Yang
et al., 2009b) and optimal spatial partitioning (Sharma
and Jurie, 2011). The table shows that for both
datasets, our approach clearly outperforms all other
methods. It is important to note that the best result is
obtained with the smallest vocabulary of 100 words.
Also, to compare SMD with recent works based
on sparse coding to create the vocabulary, we have in-
tegrated sparse coding in our method. For this, we use
the Matlab code ScSPM from authors of (Yang et al.,
2009b) , and following (Boureau et al., 2010), we use
the max pooling to compute local BoVW due to it bet-
ter performance than average pooling. We compare
to methods Sc-SPM (Yang et al., 2009b) and Kernel
Sparse Representation (KSR-SPM) (Gao et al., 2010).
The Sc-SPM approach can be treated as spatial pyra-
mid matching method using sparse coding. The KSR-
SPM approach is the combination of SPM with a ker-
nel sparse representation technique. Our method def-
initely outperforms both of them.
Table 1: Comparison of our approach over concurrent meth-
ods based on SIFT and k-means. The size of the codebook
is given in brackets. We report the highest values obtained
in pyramidal case only. − means there is no result available.
Method Caltech 101 15 Scenes
SPM (pyr., K=100) 63.2 [100] 80.1 [100]
SPM (best pyr. result) 64.6 [200] 81.4 [400]
SPM+co-occurrence - 82.51 [200]
Sequence matching - 80.9 [200]
SPM+ spatial - 80.1 [1000]
partition learning
SMD 66.5 [100] 83.2 [100]
Table 2: Comparison with sparse coding based methods. −
means there is no result available.
Method Caltech 101 15 Scenes
ScSPM [1024] 73.2 ± 0.5 80.28 ± 0.9
KSR-SPM [1024] - 83.68 ± 0.61
SMD [100] 73.44 ± 1.1 84.59 ± 0.7
5 CONCLUSIONS
In this paper, our contribution is twofold. First, we
describe a novel image representation as strings of
histograms which encodes spatial information, each
histogram being a BoVW model of a subregion. Sec-
ond, we introduce a new edit distance able to automat-
ically identify local alignments between subregions
and the removal of sequences of similar subregions.
This characteristic makes our method more robust to
translation or scale variations of objects in images
than SPM-based approaches that compare rigidly cor-
responding parts of images.
The experiments confirm that our model is able to
take into account spatial relationships between local
BoVW and leads to a clear improvement of perfor-
mance in the context of scene and image classifica-
tion compared to the classical spatial pyramid repre-
sentation. It is worth noticing that to the best of our
knowledge, it is the first time that results better than
SPR are reported with the standard BoVW coding and
a lower dimension for the representation. Moreover,
the proposed approach obtain similar or better accura-
cies than other recent methods trying to infuse spatial
relationships into the original BoVW model with the
great advantage of using a small codebook and a com-
pact representation. In the future, we are interested
in extending our edit distance to other data structures
such as trees. Trees are indeed often used to represent
image content, and some edit distances already exist.
REFERENCES
Ballan, L., Bertini, M., Del Bimbo, A., and Serra, G.(2010).
Video event classification using string kernels. Multi-
media Tools and Applications, 48(1):69–87.
Battiato, S., Farinella, G., Gallo, G., and Rav`ı, D. (2009).
Spatial hierarchy of textons distributions for scene
classification. In Proceedings of the 15th Interna-
tional Multimedia Modeling Conference on Advances
in Multimedia Modeling, MMM ’09, pages 333–343,
Berlin, Heidelberg. Springer-Verlag.
Boureau, Y.-L., Bach, F., LeCun, Y., and Ponce, J. (2010).
Learning mid-level features for recognition. In Com-
puter Vision and Pattern Recognition (CVPR), 2010
IEEE Conference on, pages 2559–2566. IEEE.
Cao, Y., Wang, C., Li, Z., Zhang, L., and Zhang, L. (2010).
Spatial-bag-of-features. In Computer Vision and Pat-
tern Recognition (CVPR), 2010 IEEE Conference on,
pages 3352–3359. IEEE.
Chen, X., Hu, X., and Shen, X. (2009). Spatial weighting
for bag-of-visual-words and its application in content-
based image retrieval. In Proceedings of the 13th
Pacific-Asia Conference on Advances in Knowledge
Discovery and Data Mining, PAKDD ’09, pages 867–
874, Berlin, Heidelberg. Springer-Verlag.
VISAPP2014-InternationalConferenceonComputerVisionTheoryandApplications
352

Christodoulakis, M. and Brey, G. (2009). Edit distance
with combinations and splits and its applications in
ocr name matching. International Journal of Founda-
tions of Computer Science, 20(06):1047–1068.
de Avila, S. E. F., Thome, N., Cord, M., Valle, E., and de Al-
buquerque Ara´ujo, A. (2013). Pooling in image rep-
resentation: The visual codeword point of view. Com-
puter Vision and Image Understanding, 117(5):453–
465.
Gao, S., Tsang, I. W.-H., and Chia, L.-T. (2010). Kernel
sparse representation for image classification and face
recognition. In Computer Vision–ECCV 2010, pages
1–14. Springer.
Harada, T., Ushiku, Y., Yamashita, Y., and Kuniyoshi, Y.
(2011). Discriminative spatial pyramid. In CVPR,
pages 1617–1624. IEEE.
He, J., Chang, S.-F., and Xie, L. (2008). Fast kernel learning
for spatial pyramid matching. In CVPR. IEEE Com-
puter Society.
Iovan, C., Picard, D., Thome, N., and Cord, M. (2012).
Classification of Urban Scenes from Geo-referenced
Images in Urban Street-View Context. In Machine
Learning and Applications (ICMLA), 2012 11th In-
ternational Conference on, volume 2, pages 339–344,
´
Etats-Unis.
Khurshid, K., Faure, C., and Vincent, N. (2009). A novel
approach for word spotting using merge-split edit dis-
tance. In Computer Analysis of Images and Patterns,
pages 213–220. Springer.
Klein, P. N., Sebastian, T. B., and Kimia, B. B. (2001).
Shape matching using edit-distance: an implementa-
tion. In Proceedings of the twelfth annual ACM-SIAM
symposium on Discrete algorithms, pages 781–790.
Society for Industrial and Applied Mathematics.
Lazebnik, S., Schmid, C., and Ponce, J. (2006). Beyond
bags of features: Spatial pyramid matching for rec-
ognizing natural scene categories. In CVPR 2006,
IEEE Computer SocietyConference on Computer Vi-
sion and Pattern Recognition, volume 2, pages 2169–
2178. IEEE.
Li, H. and Jiang, T. (2005). A class of edit kernels for svms
to predict translation initiation sites in eukaryotic mr-
nas. Journal of Computational Biology, 12(6):702–
718.
Seni, G., Kripasundar, V., and Srihari, R. K. (1996). Gener-
alizing edit distance to incorporate domain informa-
tion: Handwritten text recognition as a case study.
Pattern Recognition, 29(3):405–414.
Sharma, G. and Jurie, F. (2011). Learning discriminative
spatial representation for image classification. In Jesse
Hoey, Stephen McKenna and Emanuele Trucco, Pro-
ceedings of the British Machine Vision Conference,
pages, pages 6–1.
Sivic, J. and Zisserman, A. (2003). Video Google: A text
retrieval approach to object matching in videos. In
Proceedings of the International Conference on Com-
puter Vision, volume 2, pages 1470–1477.
Tirilly, P., Claveau, V., and Gros, P. (2008). Language mod-
eling for bag-of-visual words image categorization. In
Proceedings of the 2008 international conference on
Content-based image and video retrieval, CIVR ’08,
pages 249–258, New York, NY, USA. ACM.
Viitaniemi, V. and Laaksonen, J. (2009). Spatial extensions
to bag of visual words. In CIVR.
Wagner, R. and Fischer, M. (1974). The string-to-string
correction problem. J. ACM, 21(1):168–173.
Yang, J., Yu, K., Gong, Y., and Huang, T. (2009a). Lin-
ear spatial pyramid matching using sparse coding for
image classification. In Computer Vision and Pattern
Recognition, 2009. CVPR 2009. IEEE Conference on,
pages 1794–1801. IEEE.
Yang, J., Yu, K., Gong, Y., and Huang, T. (2009b). Lin-
ear spatial pyramid matching using sparse coding for
image classification. In Computer Vision and Pattern
Recognition, 2009. CVPR 2009. IEEE Conference on,
pages 1794–1801. IEEE.
Yang, Y. and Newsam, S. (2011). Spatial pyramid co-
occurrence for image classification. In Computer Vi-
sion (ICCV), 2011 IEEE International Conference on,
pages 1465–1472. IEEE.
Yeh, M.-C. and Cheng, K.-T. (2011). Fast visual retrieval
using accelerated sequence matching. Multimedia,
IEEE Transactions on, 13(2):320–329.
ApproximateImageMatchingusingStringsofBag-of-VisualWordsRepresentation
353
