Collaborative Vision Network for Personalized Office Ergonomics
Tommi M
¨
a
¨
att
¨
a
1
, Chih-Wei Chen
3,4
, Aki H
¨
arm
¨
a
2
and Hamid Aghajan
3,4
1
Department of Electrical Engineering, Eindhoven University of Technology, Eindhoven, Netherlands
2
Digital Signal Processing group, Philips Research Laboratories, Eindhoven, Netherlands
3
Ambient Intelligence Research (AIR) Lab, Stanford University, Stanford, U.S.A.
4
Gent University, Gent, Belgium
Keywords:
Multiple Cameras, Movement Analysis, Sensor Fusion, Office Ergonomics.
Abstract:
This paper proposes a collaborative vision network that leverages a personal webcam and cameras of the
workplace to provide feedback relating to an office-worker’s adherence to ergonomic guidelines. This can
lead to increased well-being for the individual and better productivity in their work. The proposed system is
evaluated with a recorded multi-camera dataset from a regular office environment. First, analysis results on
various ergonomic issues are presented based on personal webcams of the two workers. Second, both personal
and ambient cameras are used through sensor fusion to infer the mobility state of one of the workers. Results
for various fusion approaches are shown and their impact on vision network design is briefly discussed.
1 INTRODUCTION
The importance of proper ergonomics for the health
and wellbeing of office workers is increasingly pro-
moted by federal agencies such as OSHA (Occu-
pational Safety and Health Administration) (OSHA,
2012) and NIOSH (National Institute for Occupa-
tional Safety and Health). However, it is up to the in-
dividual workers to adhere to the proper ergonomics.
1.1 Application Background
Working long hours in front of a computer has be-
come unavoidable for many people working in of-
fices. However, the extended use of computers poses
health risks including eye strain, and neck and shoul-
der pain. In response, ergonomic experts have devel-
oped guidelines that are designed to mitigate the risk
of such workplace related injuries. In order to follow
these guidelines, workers have to gain a measure of
self-awareness of their bad habits, and be encouraged
to correct them. The field of personal informatics has
focused on providing tools to do just so.
In this study a set of cameras are used to col-
lect personal information relevant to workplace er-
gonomics. Given both close-by and ambient cameras,
the estimate of the condition of the worker is both re-
fined and given over a wider range of locations. By
visualizing the processed information to the user we
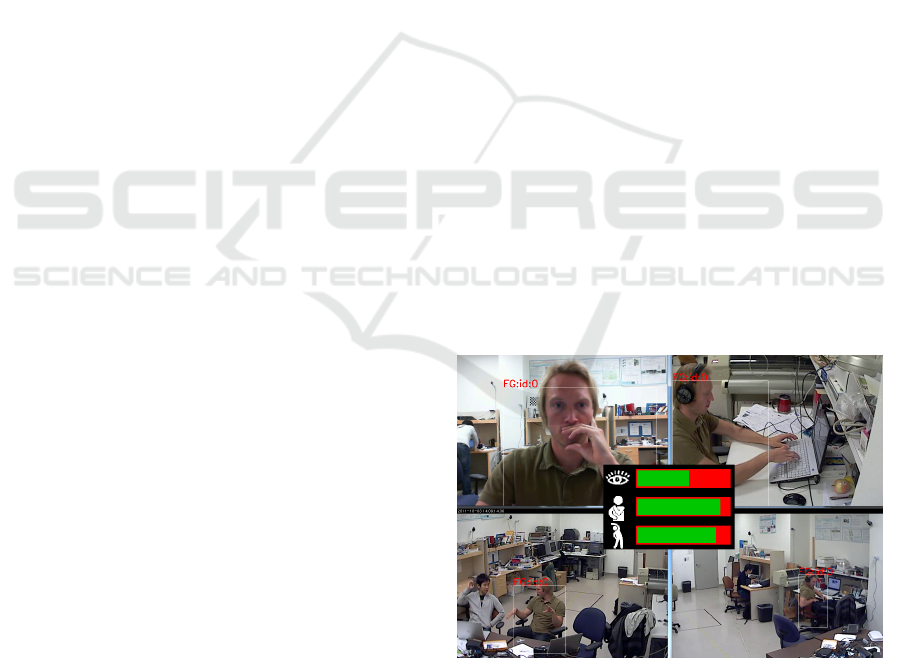
Figure 1: Personalized Ergonomics: A multi-camera sys-
tem monitors worker’s daily activities around the office.
Based on context-aware observations measures on attention,
posture and mobility are computed. The personal data is
aggregated based on which guidelines are personalized and
feedback is given to the user.
hope to increase the workers’ awareness of their own
condition related to the general guidelines. Figure 1
shows an example of a graphical feedback given by
an application. Reminders for eye breaks, neck and
shoulders exercises, and rest breaks can be sent to
the user when the respective green bar is depleted.
With contextual information the measurements can be
correlated with different tasks, providing insights on
changes in worker behavior.
403
Määttä T., Chen C., Härmä A. and Aghajan H..
Collaborative Vision Network for Personalized Office Ergonomics.
DOI: 10.5220/0004683604030410
In Proceedings of the 9th International Conference on Computer Vision Theory and Applications (VISAPP-2014), pages 403-410
ISBN: 978-989-758-004-8
Copyright
c
2014 SCITEPRESS (Science and Technology Publications, Lda.)

1.2 Paper Outline
This paper starts by introducing the related work in
person tracking and personal informatics in section 2.
The application for office ergonomics and the pro-
posed vision system are defined in section 3. The
multi-camera recording setup and the data used in
the experiments are presented in section 4. Section 5
presents the results on single-camera ergonomics
analysis and on fusion experiments on general mobil-
ity. The paper concludes with discussion in section 6.
2 RELATED WORK
Gaze tracking has been used for many applications
from analyzing the impact of advertisements for mar-
keting studies, to developing innovative interfaces for
HCI (Hansen and Ji, 2010). Most widely used meth-
ods are based on video-devices, because they are un-
obtrusive and cheap. Much work has been done to im-
prove the performance, e.g., by using prior knowledge
about the scene under a saliency framework (Valenti
et al., 2012), or by incorporating multiple cameras
(Chen and Aghajan, 2011). In this paper the esti-
mation of gaze was simplified into a common head
tracking problem.
For eye blinking detection, (Chau and Betke,
2005) proposed an approach in which eye location is
detected from a temporal difference image when the
user blinks, and templates for open eyes are created
on-line. Local template matching tracks the eye loca-
tion, and blinks are detected by thresholding the cor-
relation score. A blink detector using GPU based on
SIFT tracking was proposed in (Lalonde et al., 2007).
In this paper the eye locations are given by the tracked
head, and blinks are adaptively detected based on the
accumulated pixel differencies of the estimated loca-
tions.
The detection and tracking of people is a necessity
for many applications, but they do oppose challeng-
ing problems due to the cluttered environments with
occlusions, moving background objects, and multi-
ple people. For example, a framework that exploits
both detection and tracking methods for an articulated
body model for tracking multiple people has been
proposed in (Andriluka et al., 2008). In this paper
we’ve applied a combination method of image seg-
mentation and template matching, because the inter-
est is not in the specific posture of a person, but in
the mobility of the tracked person. Person tracking
can help to leviate privacy concerns by focusing the
analysis on the specific person only, and thus ignor-
ing individuals who want to remain anonymous.
Gathering comprehensive personal information
has been made possible recently with the advent of
ubiquitous sensors and computing power. A survey
about how personal information is collected through
ubiquitous sensors and reflected upon can be found
in (Li et al., 2010). For example, the generation of
a daily activity summary for triggering bad posture
alarms was proposed in (Jaimes, 2005). In this paper
we are interested in gathering specific properties re-
lated to office ergonomics, such as head mobility and
rest breaks.
Detection of body posture and interactions with
other people, are essential for improving wellbeing.
A 20-year study (Shirom et al., ) found a strong link
between higher level of peer social support and low-
ered risk of mortality. (Chen and Aghajan, 2011) de-
scribed methods for estimating the locations and head
orientations of multiple users. Based on these two at-
tributes, an interaction detector was trained to identify
social events. The influence of these social events on
behavior was studied in (Chen et al., 2011). In this
paper we suggest to compare the inferred office be-
havior to the official ergonomic guidelines, and use
these comparisons to drive the adaptive recommenda-
tion system.
3 PROPOSED VISION SYSTEM
In the proposed vision system, there are two main cat-
egories of cameras; the personal webcam and the am-
bient cameras. Additionally, an ambient camera that
observes only the area of a person’s desk is referred
to as a dedicated camera.
3.1 Application to Office Ergonomics
Ergonomics guidelines usually only provide high-
level recommendations that are general for specific
industry or task, but do not take into account per-
sonal preferences and habits. Therefore, warnings
that strictly adhere to the guidelines might become an-
noying to the users, and could even jeopardize work
efficiency and productivity. To address this problem,
a multi-camera supported system that learns personal
habits and preferences is proposed. The overview of
the discussed system is illustrated in Figure 2.
The frontal personal camera above the user’s com-
puter screen extracts ergonomics related attributes.
The ambient cameras monitor the entire office and
record how multiple users utilize the office space.
Data extracted by these cameras is sent to a central
processing unit. The attributes are first combined
by a data fusion process and then used to learn the
VISAPP2014-InternationalConferenceonComputerVisionTheoryandApplications
404
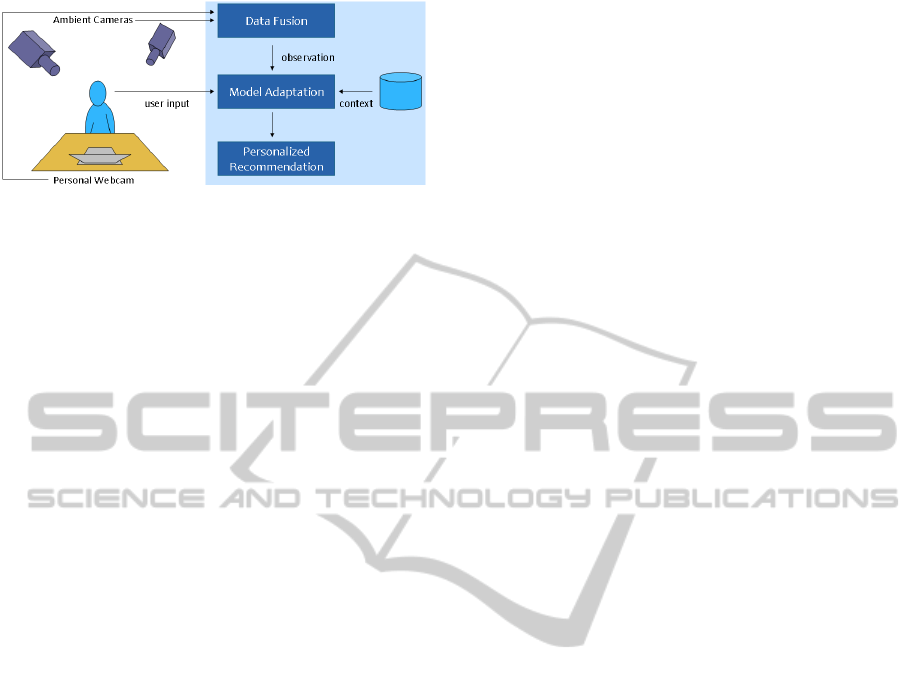
Figure 2: System Diagram for providing personalized er-
gonomics based on multi-camera observations.
worker’s profile. The model adapts to the visual ob-
servations, available user feedback and given contex-
tual information. User may provide feedback, e.g., by
penalizing unwanted reminders or by providing the
type of the task. Contextual information, e.g., on the
common breaks and meetings can be gained by ac-
cessing worker’s agenda. Personalized recommenda-
tions according to the modified user model can then
be provided to the user.
3.2 Enabling Vision Techniques
The analysis of worker behavior relies on four differ-
ent computer vision techniques.
Face and Person Tracking. The faceAPI from See-
ing Machines (Seeing Machines, 2013) was used to
track faces. FaceAPI is capable of tracking faces un-
der a wide range of head rotations, which is critical for
the proposed system since workers are not expected
to look directly into the monitor while performing
various tasks at their desk. The faceAPI returns a
6 degrees of freedom estimate of the head’s pose at
moment t: the 3D head location and the yaw, pitch,
and roll of head pose, which are expressed as a posi-
tion vector x
t
and a Euler angle vector θ
t
respectively,
x
t
=
X
t
,Y
t
,Z
t
,θ
t
=
α
t
,β
t
,γ
t
.
The faces are difficult to robustly detect from
longer distances. In order to detect and keep a
track on a person also when he/she is situated fur-
ther away from any observing camera, a HOG-
SVM based pedestrian template matching (Dalal and
Triggs, 2005) was used. The pedestrian detector re-
turns the location and size on image plane (x,y) of any
shape in the image that resembles the shape template
of a pedestrian.
Silhouette Segmentation. The faceAPI gives an es-
timate of the position of any face in personal cam-
era. With personal cameras, after performing a tra-
ditional GMM-based background subtraction and ob-
taining a foreground mask, the head position is used
to refine the foreground mask. Morphological opera-
tions are applied to remove small holes in foreground
and the largest connected silhouette component that
overlaps with detected face is defined as the worker’s
silhouette. With ambient cameras, similar refinement
on silhouette is performed based on the histogram-
of-gradient (HOG) pedestrian template matching by
Support Vector Machine (SVM).
Motion History Images. Motion history im-
ages (MHI) compute the difference between consec-
utive frames and mark the pixels with large differ-
ence values as one of the motion pixels h
i, j
. In the
experiments the motion frames were added together
over a period of 8 seconds, 120 frames captured at
15fps. This formed an accumulated MHI-frame, that
was used to compute MHI-based measures.
3.3 Measures for Ergonomics
The three techniques described before enable the
computation of informative measures capable of de-
termining worker’s ergonomic situation.
User Attention. For the proposed system, it is sat-
isfactory to extract the approximate gaze of the user
by assuming the head orientation is aligned with gaze
direction. This is a coarse approximation, but it al-
lows the use of the face tracking data in estimating
what the user focuses on. Therefore, gaze direction is
defined by the head position and orientation. The esti-
mated gaze vector is projected onto the plane spanned
by the monitor for obtaining an attention heatmap.
Distance to Screen. It is important to maintain a
proper distance between a user and a computer screen
to avoid eye strain (OSHA, 2012). Using the face
tracking data and initial calibration, the distance be-
tween the user and the screen is extracted.
Head Motion. Sitting in front of the computer can
cause excess muscle tension in the neck, shoulder, and
back. Stretching and short exercise can effectively re-
lieve affected muscles and prevent strains from accu-
mulating. Head motion can be derived from the face
tracker data. In particular, the motion m
t
of the user
at time t is defined as the weighted sum of the tracked
head displacement x and rotation θ:
m
t
= w
d
× |x
t
− x
t−1
| + w
r
× |θ
t
− θ
t−1
| (1)
where w
d
and w
r
are the corresponding weights.
CollaborativeVisionNetworkforPersonalizedOfficeErgonomics
405

Work Periods and Breaks. Taking regular breaks
during sedentary work is another important activ-
ity recommended by ergonomic experts to promote
health and well-being by reducing fatigue. The pres-
ence of a user in the view is used to determine if the
user is working or on a break. The raw presence data
provided by hits by faceAPI is processed by first find-
ing gaps in the presence. The detected breaks that are
shorter than a threshold are filtered out as not signifi-
cant absences. For the experiments a threshold of 10
seconds was used. From the starting and ending times
of the work breaks, the system computes the durations
and distributions of the work periods of the user.
Blinks. The blink detector was built upon the face
tracker, utilizing the tracked head and estimated eye
locations. Given an observed video frame, the face
tracker provides an estimate of the eye locations. Two
local regions centered on these estimated locations
are used to compute the accumulated pixel differences
within a running time window, and a binary decision
on blinking is provided based on the blinking proba-
bility.
General Mobility. A study in this paper classifies
a person’s state as one of the three classes: regular,
mobile and in-transit based on a general mobility fea-
ture. The feature is computed within a ROI, which
is the rectangular region within an image that covers
the visible part of the person. ROI updates it’s posi-
tion and size automatically based on the foreground
pixels f
i, j
or face/person tracking. The feature f
mob
is
defined as the ratio of MHI-pixels to silhouette pixels:
f
mob
=
∑
ROI
h
i, j
/
∑
ROI
f
i, j
(2)
Person is regular when engages in focused working,
thus only minor adjustments to hands, head and body
are taking place. Person is considered mobile with
larger rotations to body and displacements. In-transit
includes cases when person stands up or moves across
the office. A simple thresholding is used to declare the
state. The thresholds are defined by minimizing the
overlap of the feature distribution between the three
classes. Threshold values of 0.075 and 0.7 are used.
3.4 Fusion of Camera Data
As multiple cameras provide their observations on the
user’s general mobility, great opportunities emerge
for exploiting fusion in order to increase certainty and
visibility (M
¨
a
¨
att
¨
a, 2013).
Fusion Architecture. The manner in which data
is gathered is defined by the fusion architecture;
we studied centralized and hierarchical architectures.
Centralized architecture combines directly all the data
in a central unit, whereas hierarchical first performs
fusion for subgroups of cameras and sends the results
to a central unit for the final fusion.
Fusion Level. It is common to define the type of
data to be combined as the fusion level. This level is
commonly separated into data, features and decisions
(Dasarathy, 1997). There are three types of combin-
able data within a uncalibrated vision network. Fea-
tures can be combined into a single feature-value.
Both class probabilities and class labels can similarly
be combined into a single estimate. We considered
hybrid fusion as a fourth level, in which all the result-
ing decisions from each of the previously mentioned
levels are combined into a hybrid decision.
Fusion Method. The algorithm used to combine the
data is defined by the fusion method. Many methods
have been developed, each addressing usually a cer-
tain fusion level (Sanderson and Paliwal, 2004). We
studied two method approaches; first approach relies
on the common opinion between the cameras, the sec-
ond is sensitive to detection of the classes of higher
mobility.
In the common opinion approach, the features are
combined by taking the average. The class probabili-
ties are combined by choosing the class with the high-
est overall probability. The class labels are merged by
selecting the class with the largest amount of votes.
In the sensitive approach, the features are com-
bined by selecting the maximum feature. The class
probabilities are combined by choosing the class of
highest mobility, that has been given the highest prob-
ability by at least one of the cameras. Similarly, the
class of highest mobility that has at least one vote, is
chosen as the combined decision based on votes.
4 EXPERIMENT DATA
Two researchers recorded their daily activities in a lab
using their webcam and the IP-cameras, see the layout
in Figure 4.
Recordings started in mid-September and lasted
for a month. Video was captured every weekday
between 2pm and 4pm using both the laptop web-
cams and six IP-cameras. Webcams were recorded
on the respective laptops, whereas ambient videos
were gathered over cabel IP-network on another lap-
top. In overall, 40 hours of video from each camera
VISAPP2014-InternationalConferenceonComputerVisionTheoryandApplications
406
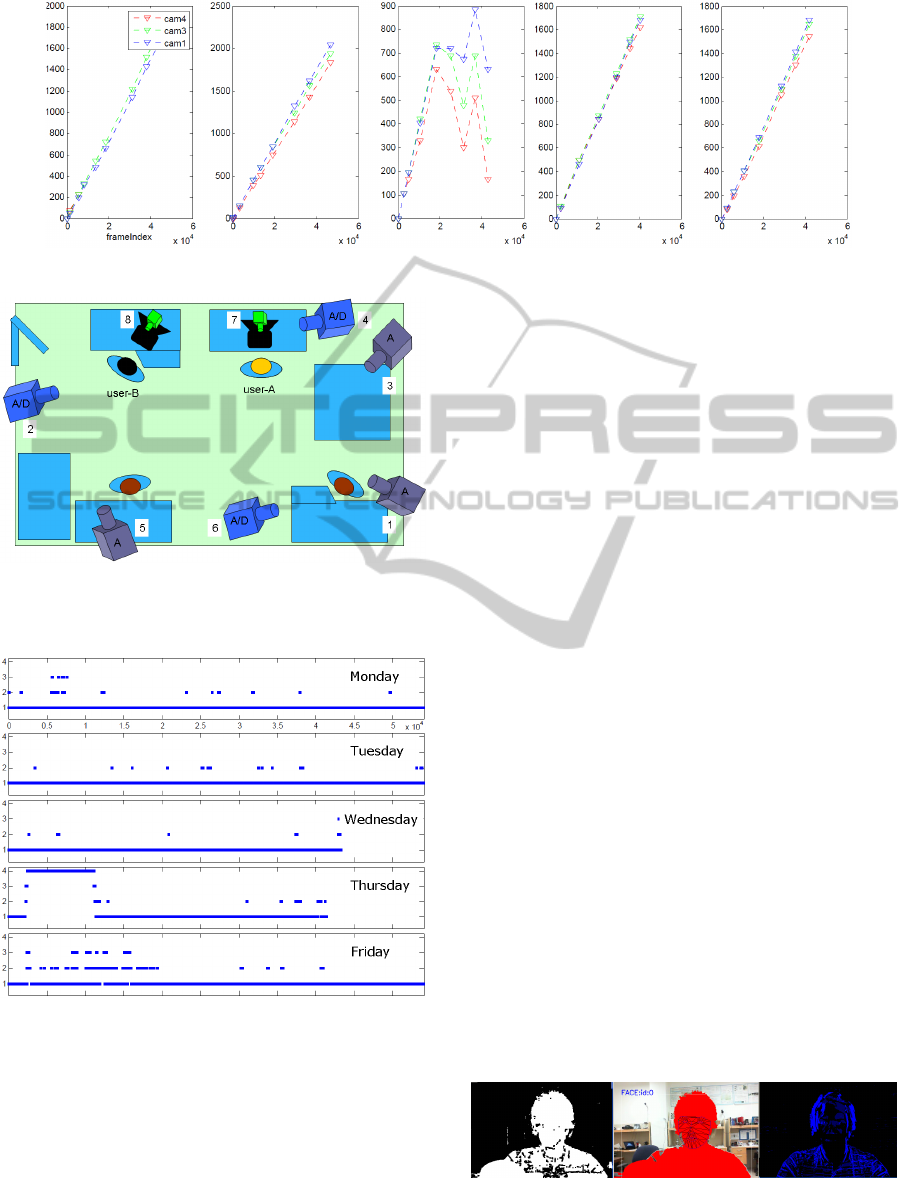
Figure 3: Shift in frames of the IP-cameras w.r.t. the personal webcam, camera-7, starting from left for Oct 3rd-7th.
Figure 4: Illustration of the recordings setup observing the
two users with ambient (1-6), dedicated (2,4,6) and personal
cameras (7,8) labeled accordingly.
Figure 5: Data labels over the entire sequence, starting from
top for Oct 3rd-7th; label value 1 as regular, 2 as mobile, 3
as in-transit, and 4 as away.
was recorded at 640 × 480 resolution at 15 fps. The
annotated data on general mobility within the office is
shown in Figure 5.
4.1 Image Processing Challenges
MHI reacts to motion observed over time. Therefore
there is a trail of motion, even after person has seated
or left the office. This trail will introduce remnant
motion pixels for the duration of the motion buffer.
Image segmentation by background subtraction
has two major challenges: initialization and update of
the background model. All objects in the scene will
be considered as part of the background, unless an
initialization step ensures no users are considered as
part of the background. Additionally the timing and
the area-of update can be controlled. Otherwise, any
changes to scene illumination or camera-gain deterio-
rate image segmentation. In the reported experiments,
segmentation was provided an image with no persons
in it for the specific day, no changes to lighting was
allowed, and cameras were set with fixed manual set-
tings. Any passers-by will also be detected as part of
the foreground as they too are new to the background
model. By only considering the 8-connected fore-
ground (FG) pixels that partly overlap with the de-
tected face/hog-template as belonging to the person’s
silhouette, robustness to separate background move-
ments is achieved. Figure 6 illustrates the suppression
of false FG pixels.
Three issues caused significant synchronization
problems for the recorded video-streams. First, cam-
eras dropped frames while capturing. Second, some
data packets and hence some frames get lost in trans-
mission. Third, some frames are dropped during the
recordings by the laptop as it fails to write all the
frames from all six IP-video streams. Figure 3 il-
lustrates how much three of the IP-cameras fell be-
hind of the personal webcam (camera-7). Because
Oct 5th had significant fluctuations, and thus compli-
Figure 6: Examples of the three used vision techniques: im-
age segmentation, face-tracking aided foreground segmen-
tation, and MHI. Presented here for a personal webcamera.
CollaborativeVisionNetworkforPersonalizedOfficeErgonomics
407
cated to compensate shift by linear approximation, it
was omitted from general mobility experiments.
5 EXPERIMENTS
Analysis of ergonomics by the desk was performed by
examining the working styles of two individuals dur-
ing two of the recorded days based only on their per-
sonal webcams. Whereas, general mobility of user-A
within office was studied with his webcam and three
IP-cameras over four days. These two studies are used
in our preliminary work to assess the applicability of
the described computer vision techniques to person-
alized office ergonomics.
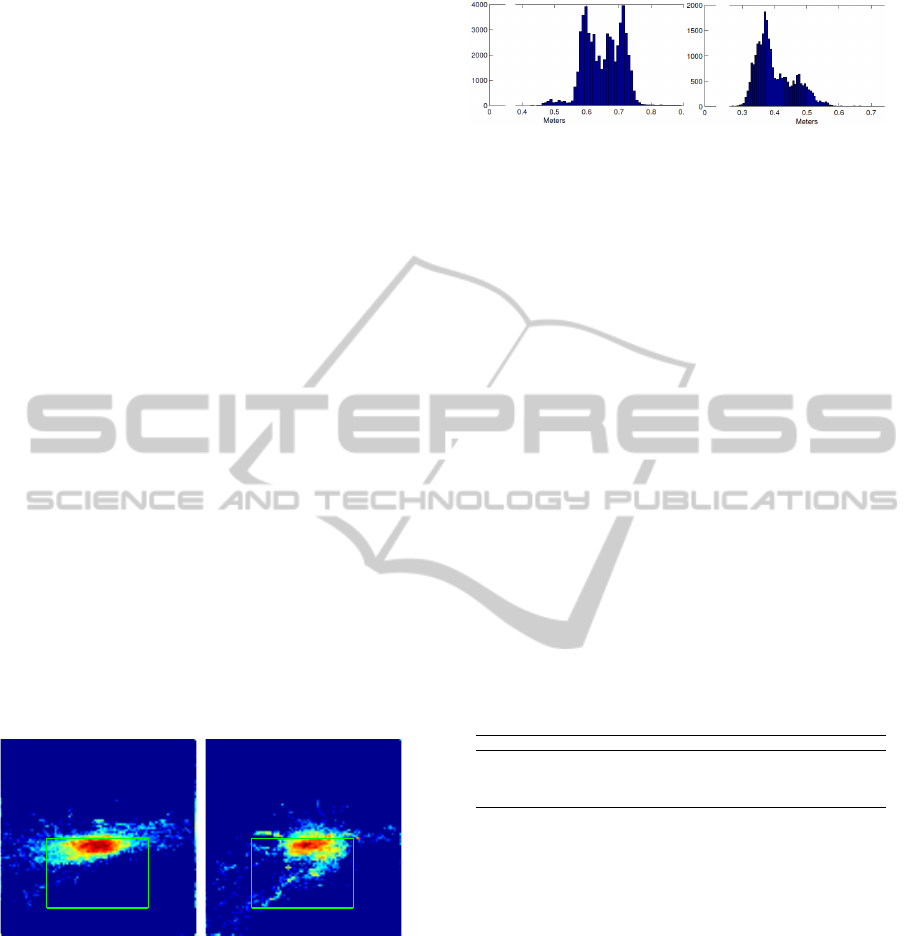
User Attention. Heat maps indicating areas of fo-
cus were obtained from the user gaze analysis, see
Figure 7. The majority of the time was spent looking
directly at the computer screen. The elongated pattern
in the horizontal direction is due to the user panning
their head side to side. Both users frequently look
away from their computer screens, thus decreasing
eye fatigue. User B’s heat map also indicates frequent
patterns of looking down and toward the side, which
correlates to the user reading a document placed flat
on his desk. User B should place his documents closer
to the same plane with the screen (OSHA, 2012). Ad-
ditionally, both heatmaps indicate a proper monitor
placement, as the centroid of the heat map is approx-
imately at eye level.
(a) user A (b) user B
Figure 7: Gaze Attention with green boxes indicating ap-
proximate screen locations: (a) mainly focused on objects
at eye level, (b) focused on both screen and objects on desk.
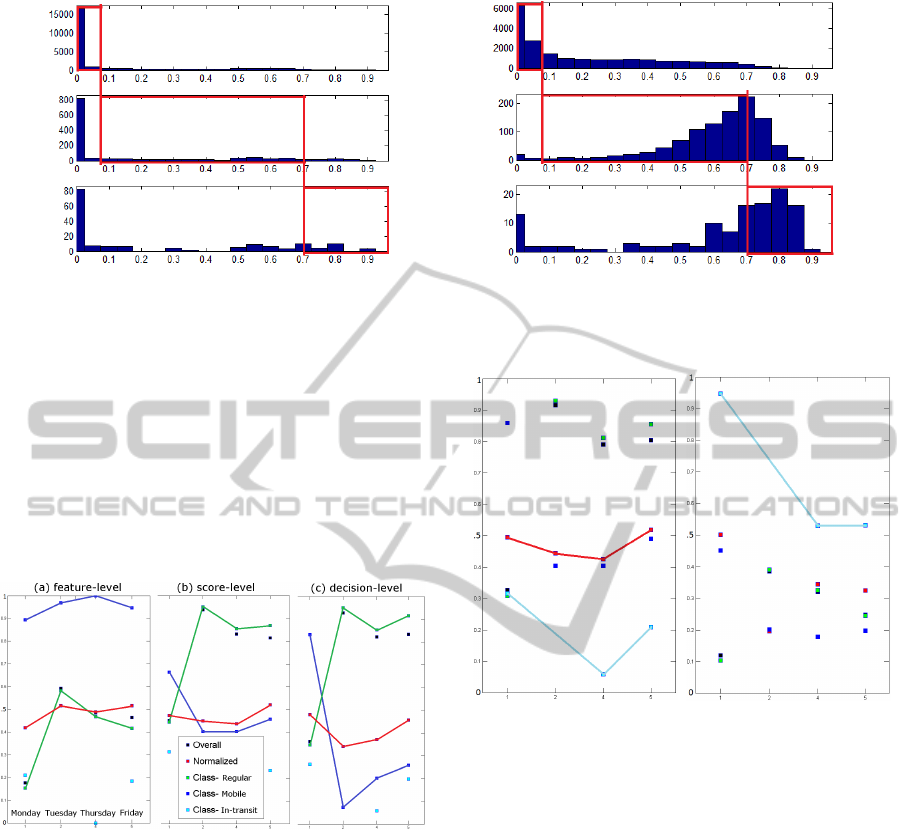
Screen Distance. The histograms of the screen
viewing distance for the two test users, for the times
their face was successfully tracked, are shown in Fig-
ure 8. Two distinct viewing patterns are observed.
User A’s viewing pattern is highly bi-modal and the
viewing distances are greater compared to User B’s
pattern, which feature a long tail.
(a) user A (b) user B
Figure 8: Histograms of screen distances: (a) features a dis-
tinctive bi-modal distribution, (b) the distance distribution
features a large tail, possibly indicating work not involving
a computer.
Head Mobility, Blinks and Duration. To infer the
state of head mobility, the displacement weight w
d
in
Eqn. 1 was set to 1 and rotation weight w
r
to 0.3, mea-
suring x in centimeters and θ in degrees. A person was
labeled mobile at time t, if m
t
> T
m
, with T
m
as 10.
Table 1 shows example statistics of two users
highlighting differences between the user’s habits
from blink rate to average work period. Using con-
textual data for User B, it can be seen that computer
usage patterns change with the type of job being per-
formed. For example, when reading a paper doc-
ument, User B switches between the paper and the
computer frequently, and therefore has higher blink
rate and head motion. Whereas programming causes
focused attention, reduced head motion and increased
time between breaks.
Table 1: Example statistics of user A/B activity on different
days shown in different contexts.
Break Interval Presence Mobility Blinks
A Mon Avg 55 m. 40 sec. 82.1% 6.2% 8.4/m.
B
Mon Avg 33 m. 42 sec. 78.6 % 10.2% 14.3/m.
Fri Avg 28 m. 34 sec. 61.4 % 12.9% 26.5/m.
Reading 16 m. 15 sec. - 14.4% 23.6/m.
Coding 42 m. 27 sec. - 4.8% 17.7/m.
General Mobility. The mobility feature f
mob
for the
ambient (1,3) and close-by cameras (4,7) is shown in
Figure 9. Near-zero feature-values are evident with
each camera and class, because of the synchroniza-
tion problem, as non-mobile moments have been in-
cluded in the mobile classes. The mobile and in-
transit classes with ambient cameras largely overlap,
due to viewpoint limitation in computing the feature.
Both ambient and close-by cameras are used
jointly to infer the mobility state of the person for
each observation. Each decision is compared to the
annotated label and only matching decisions count
as correct. All the following figures show cor-
rect classification-ratios per each class, for all sam-
ples (overall), and averaged across the classes (nor-
malized). Same legend and axis-notation apply to
Figures 10-12. Colored lines highlight the values dis-
cussed in text in %.
VISAPP2014-InternationalConferenceonComputerVisionTheoryandApplications
408
(a) Ambient Cameras 1&3
(b) Close-By Cameras
Figure 9: The histograms of the mobility feature f
mob
per each class starting from top: regular, mobile and in-transit. The
threshold-region of values for the specific class is presented within each red rectangle.
Fusion Level. The centralized common opinion fu-
sion at each of the basic fusion levels is shown in Fig-
ure 10. Fusion of features gives better results for mo-
bile (in blue) than for regular (in green) class, con-
trary to fusion of scores or decisions. Fusion at the
feature-level (far-left) is slightly better (49%) than
score (47%) or decision (41%), when considering the
normalized accuracy (in red).
Figure 10: Classification results of Centralized Fusion with
Common Opinion methods for the three Fusion Levels.
Fusion Method. The accuracy of mobility infer-
ence with the centralized fusion at the hybrid-level
with both fusion method approaches are given in Fig-
ure 11. With the sensitive approach, in-transit (in
cyan) class is detected much better, but the detection
of the other two classes suffers.
Correspondingly, the hybrid results of both ambi-
ent and close-by cameras with common opinion ap-
proach are shown in Figure 12. Ambient cameras can
reach normalized accuracy of 54% and close-by 55%,
which on average (54.5%) is better than the central-
ized with 47%. By combining the decisions from both
the camera groups, better overall system accuracy can
be achieved.
(a) Common Opinion
(b) Sensitive
Figure 11: Classification results of Centralized Hybrid.
6 CONCLUSIONS
Video-based analysis can provide much beneficial in-
formation about working habits. As it is shown in
this paper, with a webcam descriptive measures on
ergonomics by the desk can be extracted. By adding
more cameras the range of analysis can be increased,
but often the quality and comparability of data suffers
as problems, e.g., in data synchronization and image
processing emerge.
Fusion of data can help in providing certainty and
visibility. By grouping cameras with similar measure-
ments, more stability in data is achieved and better
results from fusion can be expected. By applying fu-
sion methods that are sensitive to rare activities, their
detection can be enhanced, regardless of the level of
data and the manner in which it is gathered.
Having tools to analyze working behavior enables
the use of personalized recommendation systems that
CollaborativeVisionNetworkforPersonalizedOfficeErgonomics
409
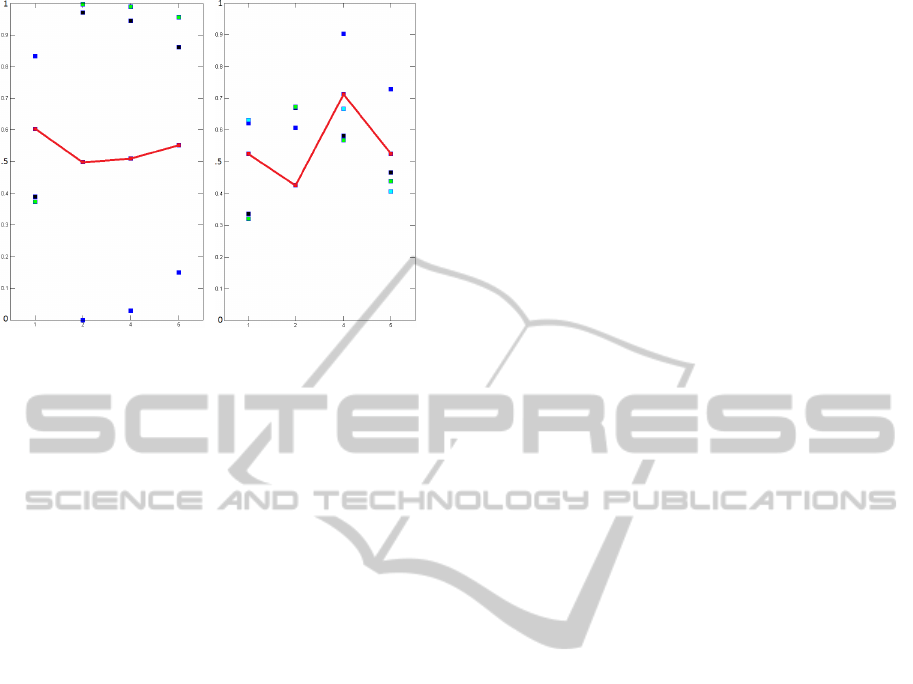
(a) Ambient Cameras 1&3
(b) Close-By Cameras
Figure 12: Classification results of Hierachical Hybrids of
the Common Opinion method.
can provide the suggestions specifically to the partic-
ular worker according to his agenda and activities. In
this preliminary work we studied the applicability of
four vision techniques and basic fusion approaches to
applied empathic computing. In future work, larger
datasets and user tests can be used to further validate
the accuracy of these techniques.
REFERENCES
Andriluka, M., Roth, S., and Schiele, B. (2008).
People-tracking-by-detection and people-detection-
by-tracking. In IEEE Conference on Computer Vision
and Pattern Recognition, pages 1–8.
Chau, M. and Betke, M. (2005). Real time eye tracking and
blink detection with usb cameras. Technical report,
Boston University.
Chen, C.-W. and Aghajan, H. (2011). Multiview social be-
havior analysis in work environments. In ACM/IEEE
International Conference on Distributed Smart Cam-
eras (ICDSC), Ghent, Belgium.
Chen, C.-W., Aztiria, A., Ben Allouch, S., and Aghajan,
H. (2011). Understanding the influence of social in-
teractions on individual’s behavior pattern in a work
environment. In Proceedings of the Second interna-
tional conference on Human Behavior Unterstanding,
pages 146–157, Berlin, Heidelberg. Springer-Verlag.
Dalal, N. and Triggs, B. (2005). Histograms of oriented gra-
dients for human detection. In IEEE Computer Society
Conference on Computer Vision and Pattern Recogni-
tion (CVPR), volume 1, pages 886–893.
Dasarathy, B. V. (1997). Sensor fusion potential exploita-
tion - innovative architectures and illustrative applica-
tions. Proceedings of the IEEE, 85:24–38.
Hansen, D. and Ji, Q. (2010). In the eye of the beholder:
A survey of models for eyes and gaze. IEEE Trans-
actions on Pattern Analysis and Machine Intelligence,
32(3).
Jaimes, A. (2005). Sit straight (and tell me what i did to-
day): a human posture alarm and activity summariza-
tion system. In Proceedings of the 2nd ACM workshop
on Continuous archival and retrieval of personal ex-
periences, CARPE ’05, pages 23–34, New York, NY,
USA. ACM.
Lalonde, M., Byrns, D., Gagnon, L., Teasdale, N., and Lau-
rendeau, D. (2007). Real-time eye blink detection
with gpu-based sift tracking. In Proceedings of the
Fourth Canadian Conference on Computer and Robot
Vision, pages 481–487, Washington, DC, USA. IEEE
Computer Society.
Li, I., Dey, A., and Forlizzi, J. (2010). A stage-based model
of personal informatics systems. In Proceedings of
the 28th international conference on Human factors
in computing systems, CHI ’10, pages 557–566, New
York, NY, USA. ACM.
M
¨
a
¨
att
¨
a, T. T. (2013). Sensor fusion in smart camera net-
works for ambient intelligence. PhD thesis, Technis-
che Universiteit Eindhoven.
OSHA (2012). Laboratory safety ergonomics for the
prevention of musculoskeletal disorders in lab-
oratories. www.osha.gov/Publications/laboratory/
OSHAfactsheet-laboratory-safety-ergonomics.pdf.
Sanderson, C. and Paliwal, K. K. (2004). Identity verifica-
tion using speech and face information. Digital Signal
Processing, pages 449–480.
Seeing Machines (2013). faceapi.
www.seeingmachines.com/product/faceapi/.
Shirom, A., Toker, S., Alkaly, Y., Jacobson, O., and Bal-
icer, R. Work-based predictors of mortality: A 20-year
follow-up of healthy employees. Health Psychology,
(3):268–275.
Valenti, R., Sebe, N., and Gevers, T. (2012). What are you
looking at? - improving visual gaze estimation by
saliency. International Journal of Computer Vision,
98(3):324–334.
VISAPP2014-InternationalConferenceonComputerVisionTheoryandApplications
410
