
SVM-based Video Segmentation and Annotation of Lectures and
Conferences
Stefano Masneri and Oliver Schreer
Image Processing Department, Fraunhofer Heinrich Hertz Institut, Einsteinufer 37, 10587 Berlin, Germany
Keywords: Semantic Annotation, Classification, Video Segmentation, Video Understanding, Supervised Learning.
Abstract: This paper presents a classification system for video lectures and conferences based on Support Vector
Machines (SVM). The aim is to classify videos into four different classes (talk, presentation, blackboard,
mix). On top of this, the system further analyses presentation segments to detect slide transitions,
animations and dynamic content such as video inside the presentation. The developed approach uses various
colour and facial features from two different datasets of several hundred hours of video to train an SVM
classifier. The system performs the classification on frame-by-frame basis and does not require pre-
computed shotcut information. To avoid over-segmentation and to take advantage of the temporal
correlation of succeeding frames, the results are merged every 50 frames into a single class. The presented
results prove the robustness and accuracy of the algorithm. Given the generality of the approach, the system
can be easily adapted to other lecture datasets.
1 INTRODUCTION
Video classification is the first step towards
multimedia content understanding. Being able to
classify video data into semantically meaningful
classes is paramount for many different applications,
such as video browsing and summarization, creation
of a video-based recommendation system or search
and retrieval of video segments.
In the last few years, with the advent of Massive
Open Online Course (MOOC) like Coursera, MIT
OpenCourseWare and Udacity or the creation of
websites like TED.com or VideoLectures.net, the
amount of conferences and video lectures has grown
exponentially and it is often hard to perform basic
tasks like browsing the content of a particular video,
extracting the slides shown during the presentation
or searching specific parts of a video, for example
the segments in which the lecturer is writing on a
blackboard.
This paper describes an automatic classification
system able to perform a temporal segmentation of
the video based on semantic concepts. The system
segments the video and classifies each segment into
one of four different classes: Talk, Presentation,
Blackboard and Mix (when both the lecturer and the
slides from the presentation are shown). The
classification is performed on a frame-by-frame
basis and is thus independent from the segmentation
of video into shots. The results of the frame-based
classification are merged into a single class every 50
frames to avoid the problem of over-segmentation
and, at the same time, exploit the fact that
consecutive frames are likely to belong to the same
class. The system has been tested on two different
datasets, extracted from the TED talks (TED, 2013)
and VideoLectures (VideoLectures, 2013) website.
The approach used to create the classifier is highly
generic and can be extended with minor
modifications to different datasets.
The paper is organized as follows. In section 2, a
short survey of the literature is presented,
highlighting the differences between the proposed
approach and previous work. Section 3 presents the
dataset for development and evaluation. Section 4
describes the features used to perform the
classification. In section 5 details of the system are
discussed focusing on the implementation of the
classifier. Section 6 describes a sample application
of the automatic video classifier, namely a tool for
detecting animations and dynamic content inside
presentation segments. Experimental results are
presented in section 7 followed by a conclusion
outlook for future work.
425
Masneri S. and Schreer O..
SVM-based Video Segmentation and Annotation of Lectures and Conferences.
DOI: 10.5220/0004686004250432
In Proceedings of the 9th International Conference on Computer Vision Theory and Applications (VISAPP-2014), pages 425-432
ISBN: 978-989-758-004-8
Copyright
c
2014 SCITEPRESS (Science and Technology Publications, Lda.)

2 RELATED WORK
Automatic video classification is an active and
important area of research and many approaches
have been used to perform this task. An overview of
the different methods available in literature is
presented in (Brezeale and Cook, 2007).
There are many ways to distinguish between
automatic video classifiers. One can differentiate
based on
The features extracted: colour, audio, textual,
motion, multimodal
The type of classification performed: on the
whole video, shot-based or frame-based
The classifier used: SVM, Bayes, Gaussian
Mixture Models (GMM), Hidden Markov
Models (HMM)
The generality of the system, i.e. the possibility
to apply it to different datasets or just to a
specific one.
Text-only and audio-only approaches are
relatively rare compared to video-only based
classifiers since text and audio features are normally
used in conjunction with visual features to create a
more robust classifier. The most common text
features are transcripts of the dialogues (Robson,
2004) or the words extracted from the frames using
Optical Character Recognition (OCR) systems
(Kobla et al., 2000). Commonly used audio features
are the root mean square of the signal energy, the
zero crossing rate, the frequency centroid, the pitch
and the Mel-frequency cepstral coefficients.
Examples of audio-only classifiers are (Pan and
Faloutsos, 2002), which distinguishes between
videos of news and commercials and (Moncrieff et
al., 2003), which classifies movies as horror or non-
horror.
Most of the approaches in literature rely, as
expected, also on visual features and not just audio
or text information.
Many visual-based approach use shots (defined
as a sequence of consecutive frames within a single
camera action) to perform the classification,
essentially for two reasons. First, because a shot is a
natural way to segment a video and each shot may
represent a higher-level concept. Second, shots can
be represented by a single frame, the so-called key
frame. Perform the shot classification analysing just
that frame significantly reduces processing time. A
video-only approach that exploits shot information
to perform video classification is described in
(Kalaiselvi Geetha, 2009).
The different visual features used to perform
classification tasks can be grouped into five major
categories (Brezeale and Cook, 2007):
Colour-based features, such as colour
histograms, texture and edge information
Shot-based information, such as shot length and
transition type
Object-based features, such as faces or text boxes
MPEG features, usually DCT coefficients and
motion vectors
Motion-based features, such as optical flow,
frame difference, motion vectors
Audio, text and visual information are also
exploited all together to improve the results on the
single classifier, while the different features can be
combined in various ways. One approach is to use
the output of different Hidden Markov Models as the
input of a multi-layer perceptron Neural Network
(Huang J. et al, 1999). Another approach makes use
of a Gaussian mixture model to classify a linear
combination of the conditional probabilities of audio
and visual features (Roach et al., 2002). A simpler
idea is to concatenate different features into a single
vector that will be used to train an SVM, as for
example described in (Lin and Hauptmann, 2002).
Regarding the classification of lectures and
conferences previous work rely mostly on audio and
textual information. (Yamamoto et al., 2003)
describes a method that uses a speech recognition
system to split the content of a lecture into its
different topics, matching different parts of the talk
with different chapters of the textbook used in the
lecture. (Malioutov and Barzilay, 2006) exploits the
text transcription of a lecture to perform
unsupervised segmentation based on the normalized-
cut criterion. In (Ngo et al., 2003) text extracted
from the slides of the lecture and audio cues are
combined to detect the most interesting parts of the
video, but no attempt has been made in classifying
the content. In (Chau et al., 2004) the segmentation
into different topics is performed using only the
transcribed speech text, but the system requires
manual hand-tuning of the algorithm parameters. A
video-only approach to segment the video is
described in (Mukhopadhyay and Smith, 1999), but
in that case no semantic meaning is assigned to the
segments. (Friedland and Rojas, 2008) describes a
system to automatically select lectures segments
where a blackboard appears, but the aim in that case
is just to remove the figure of the lecturer from the
video.
SVM has been increasingly used to perform
classification task. A non-exhaustive list of video
VISAPP2014-InternationalConferenceonComputerVisionTheoryandApplications
426
classification based on support vector machines
includes (Subashini et al., 2011), which classifies
video shots into four different categories.
(Vakkalanka et al., 2004) extracts colour, shape and
motion features to classify 20 seconds long
fragments of TV content. In (Hauptmann et al.,
2002) an SVM classifier is used to classify shots for
the 2002 TREC Video Retrieval Track run.
To the best of our knowledge, the system
described here is the first one to perform fully
automatic frame-based video segmentation and
classification using only visual features. The system
doesn’t make any assumptions on the type of
content, so it can easily be applied to other video
recordings of lecture material.
3 INPUT DATASET
The videos used for the experiments are a subset of
the TED.com and VideoLectures.net database. The
content of the videos is semantically similar (both
datasets are about lectures and conference talks), but
they have different visual properties. The videos
crawled from the TED website (
Figure 1
) have good
visual quality (bitrate of 980 kb/s for videos with
854x480 resolution), feature only hard-cut shot
transition e.g. from the lecturer to a full screen view
of the presentation and vice versa. The videos are
usually quite short with an average video length of
16 minutes. Every video from the TED dataset also
has a short intro segment as well as final segment,
possibly containing a commercial. Since their
content isn’t related to the lecture content, the
system automatically detects and discards them in a
pre-processing step.
Figure 1: Sample snapshots from TED videos.
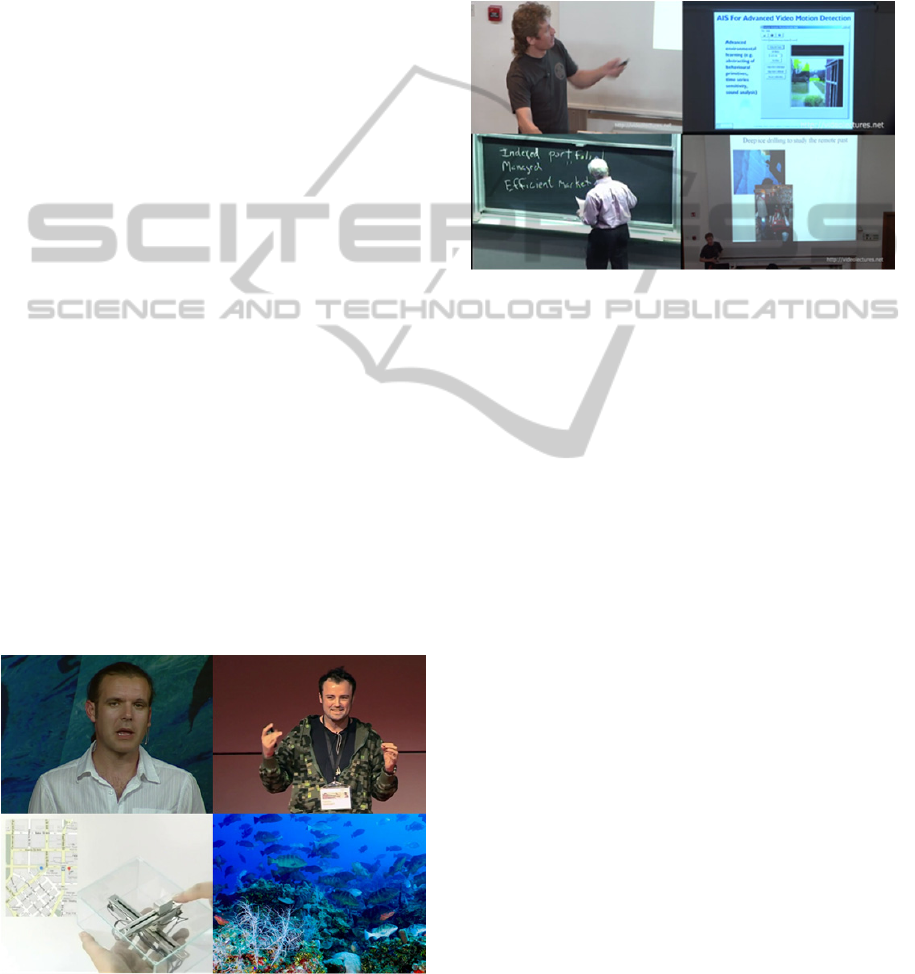
On the other hand, videos from
VideoLectures.net (
Figure 2
) are much longer with
an average length of little bit more than an hour. The
videos are usually recorded at a poorer quality.
Besides, there are almost no shot transitions (the
only ones being usually dissolvence or fades) and
there is no clear separation between the segments,
where the lecturer is talking and the ones, where the
slides are shown.
Figure 2: Sample snapshots from VideoLectures videos:
Talk, Presentation, Blackboard and Mix.
The system classifies the video content into four
different classes:
TALK, where only the lecturer is shown
PRESENTATION, when just the slides are
shown, either because the camera focuses on the
images projected on the wall (as in the
VideoLectures content) or because the input
changes to VGA data (as in the TED dataset)
BLACKBOARD, when the lecturer is writing on
a blackboard.
MIX, when both the lecturer and the slides are
shown.
The database used for training and testing the
classifier consists of 40 videos, 20 from
VideoLectures.net and 20 from Ted.com, for a total
of 26 hours of video content.
4 FEATURE EXTRACTION
Two types of features were extracted: face-based
and colour-based features. The choice of extracting
facial information is obvious: the distinction
between TALK and PRESENTATION segments
could be based only on the detection of faces in the
video frame.
Extraction of colour information is sensible, too.
Different classes have different colour properties For
example; BLACKBOARD segments are associated
SVM-basedVideoSegmentationandAnnotationofLecturesandConferences
427

with dark colours, while TALK segments will
feature a lot of pink colour in the region around the
lecturer face.
The system extracts 3 facial and 48 colour
features, leading to a 51-dimensional feature vector
computed at each frame.
4.1 Face Detection
To extract the required facial features, a software
library called “Shore” (Kueblbeck, 2006) has been
used. The “Shore”-Library provides a face detector
that allows robust frontal and profile face detection
and tracking for a large variety of faces. This library
is commercially used in many image and video
annotation tools as well as in security. The library
provides a number of information for each detected
face in each frame such as the position, the size and
other properties (eyes, mouth and nose position, face
type, age range and so on).
The system stores three properties, which are the
number of faces detected in the frame (it actually
uses only three values: “zero”, “one”, “more than
one”), the size of the biggest face (normalized with
respect to the frame width) and the horizontal
position of the face centre. If no faces are found, all
of these values are set to zero. The rationale behind
the choice of these features is that the presence of a
face is the single most useful information to
distinguish between TALK and PRESENTATION
segments. Adding size and position information also
allows distinguishing between MIX and TALK
segments, since when both the slides and the lecturer
are present, the latter is usually on the side of the
screen and the size of the face is small compared to
the size of the video frame.
4.2 Colour Histogram
The second set of features is based on colour
information. At each frame, a 16-bins histogram is
computed for each channel in the RGB colour space.
Using only 16 bins allows reducing the
dimensionality of the feature vector without losing
too much information. The choice of the colour
histograms arises naturally considering the data
analysed, since different classes have usually a very
different colour distribution.
Another advantage of using colour histograms is
that they can also be used to quickly detect shot-
cuts. The video segmentation implemented in our
system is not shot-based but the start of a new shot is
nonetheless valuable information and is used in the
post-processing stage to check the correctness of the
segmentation.
The method used to detect the beginning of a
new shot is based on the computation of colour
histogram differences, as described in (Zhang et al.,
1993). For each frame, the colour histogram
difference for frame i is defined as
, 1
,
,
1
(1)
where
,
represents the k-th value for the j-
th colour component of the histogram of frame i. In
this implementation, the RGB colorspace was used.
The colour histogram difference value is then
normalized with respect to the total number of pixels
in the frame. If the normalized value is above
threshold τ (in our case τ = 0.65), then the current
frame marks the beginning of a new shot.
5 VIDEO SEGMENTATION
Almost all video segmentation and classification
approaches are based on shot detection and
classification of related key frames in the shots. Our
approach performs in the opposite way as we define
the shot boundaries after classification of the video
frames and post-processing of the classification
result. For this purpose, a standard Support Vector
Machine (SVM) based classification scheme has
been implemented.
5.1 Training SVM Classifiers
The presented approach consists on classifier based
on Support Vector Machines (Vapnik, 2000) using
the features described in the previous section.
In its most basic form, an SVM is a non-
probabilistic binary linear classifier. A support
vector machine constructs the optimal n-dimensional
hyper plane (where n is the number of features
considered) that separates training points belonging
to different classes. The hyper plane is optimal in the
sense that it maximises the distance between itself
and the closest data points of the two classes. More
formally, given a set of n data points D of the form
,
|
∈
,
∈1,1
(2)
The points x which lie in the hyper plane satisfy
∙0, where w is normal to the hyper plane,
|
|‖
‖⁄
is the perpendicular distance from the
hyperplane to the origin and
‖
‖
is the Euclidean
norm of w (see
Figure 3). If
and
are the
shortest distances from the hyperplane to the closest
positive and negative points in D, the margin of the
VISAPP2014-InternationalConferenceonComputerVisionTheoryandApplications
428
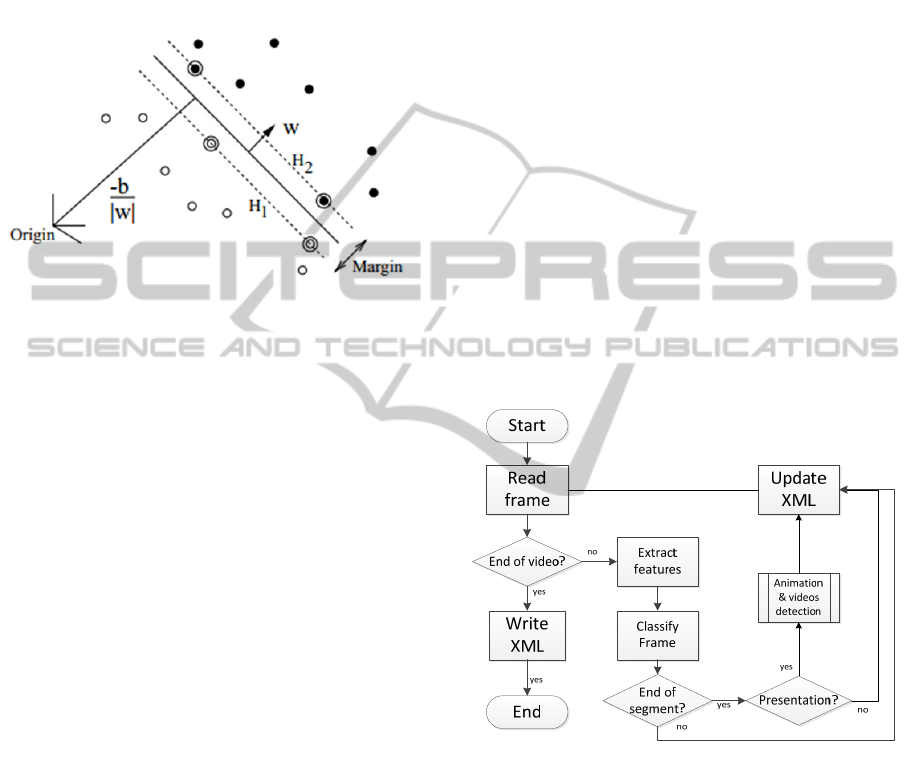
hyper plane can be defined as
. The two
closest points are called the support vectors and the
SVM algorithm looks for the hyper plane with the
largest margin. The hyper plane hence must satisfy
the following constraint:
∙10∀
(3)
Figure 3: Separating hyperplane in a 2-D feature space.
The support vectors are circled.
Over the course of the years, several extensions
to the original algorithm have been developed. The
most important ones are:
The soft-margin method, which defines a new
maximum margin idea that allows for
mislabelled training samples.
Multi-label classification, implemented reducing
the single multiclass problem into multiple
binary classification problems
The usage of decision function, which is not a
linear function of the data, implemented with the
so-called kernel trick.
More details on SVM and its extensions can be
found in (Cortes and Vapnik, 1995).
The system developed is based on libSVM (Lin,
2011) and the SVMs selected are C-SVM with a
radial basis function kernel, since those were the
ones which gave the best cross-validation accuracy
values on the training data. This SVM applied to
classify videos from the VideoLectures dataset has
been trained using 12.000 manually labelled feature
vectors (FVs). Each one of the 51-dimensional FV
was computed from frames extracted from the first
10 minutes of each video in the dataset. The cross-
validation of the training data gave an accuracy rate
of 95.8%.
For the classification of TED videos, a much
smaller training set was used. From 15 out of the 20
videos of the TED dataset, 40 frames were randomly
selected and used to compute the feature vectors,
giving a total number of 600 FVs. In this case, cross-
validation gave an accuracy rate of 98.4%.
5.2 System Implementation
Once the classifiers have been created, the system
applied them to classify each frame of the test
videos.
Figure 4
shows the block diagram of the
algorithm implemented. Face and colour features are
extracted at each frame and combined in a 51-
dimensional feature vector (FV). This FV is then
given as input to the SVM classifier that will assign
a class to the frame.
To avoid over-segmentation, the classifier
merges the results obtained every 50 frames using a
simple majority rule. It assigns the same class to the
whole bunch of frames, and the class chosen is the
one which was assigned the most during the single
frame classification step. This step improves the
performance of the system by taking into account
the temporal correlation in the video, since the
probability that a frame belongs to the same class as
its predecessor is much higher than the probability
that it belongs to a different class.
Figure 4: Block diagram of the system.
On the other hand, classifying group of frames
this way has the disadvantage that it may introduce
an offset in the detection of the start of a new
segment. This proved not to be a problem, for two
reasons. First, because the time offset has been
calculated to be less than one second and hence can
be ignored in most applications; second, because the
detection of shot cut as described in section 3.2
allows adjusting the time discrepancy whenever the
start of a new segment coincides with the start of a
new shot. If the end of a segment is detected, and the
segment is labelled as PRESENTATION, a
SVM-basedVideoSegmentationandAnnotationofLecturesandConferences
429

subroutine for detecting animations and dynamic
content inside of the presentation starts. This module
will be described in detail in the next section.
Whenever the end of a segment is detected, the
system updates an xml file. This file stores the start
and end time of each segment as well as the class
assigned to it.
On a PC with standard configuration (Quad-core
Xeon, 2.53 GHz and 4 GB of memory) the
algorithms processes 51 frames per second, making
it roughly twice as fast as real time. The analysis of
the presentation content runs on separate threads and
therefore does not impact the run-time.
6 ANALYSIS OF PRESENTATION
SEGMENTS
One possible application of semantic segmentation
of video lectures is the further analysis of the
presentation content. Extracting data from the
presentation can be useful in the context of video
summarization, indexing and browsing and allows
users to get a grasp of the video content without
actually watching it.
The analysis of the presentation segments consist
in the detection of
Slide changes (both abrupt and soft transition)
Horizontal and vertical animations in some
spatial regions of the slide
Dynamic content (such as videos inside the
presentation)
Figure 5 shows an example of animation and
dynamic content inside a presentation.
Figure 5: Horizontal animation (top) and video content
(bottom) inside a presentation segment.
The detection of slide transitions and dynamic
content follows the same approach: at every frame n,
the difference image I
n
is computed as the L
1
distance between the current frame F
n
and the
previous one:
|
|
(4)
After that, the system counts the number P
n
of pixels
above zero in the difference image and, if the value
of P
n
is above threshold, the state of the frame is set
to “moving”.
The detection of slide transition and videos
inside the presentation is then based on the number
of consecutive frames marked as moving: a dynamic
content is detected whenever there is a span of 50
(i.e. 2 seconds) or more consecutive frames marked
as moving while a soft slide transition is detected
when the span is between 3 and 50 frames.
The detection of animations is based on the
analysis of local changes in the difference image I
n
.
To look for horizontal animation the algorithm
counts the number of pixels greater than zero in each
column of I
n
. That is, defining M as the number of
rows in the image, it is computed for each column i
,
0
(5)
where f(
) is a function returning 1 if its argument
is true and 0 otherwise.
If one or more values of the function H (i.e. the
number of pixels above zero in one or more columns
of the difference image) are above threshold, the
current frame is marked as having horizontal
motion. If an interval of two or more consecutive
frames has horizontal motion, a horizontal animation
is detected. The same method holds for the detection
of vertical animations. Finally, hard slide transitions
are detected using the colour histogram difference
described in section 3.2.
7 EXPERIMENTAL RESULTS
To the authors’ knowledge, there is no previous
work done on segmenting and classifying lectures
videos which are not shot-based. In order to test the
system, a subset of the dataset has been used as
ground truth. The system is composed by 5 videos
from the TED dataset and 2 videos from the
VideoLectures dataset, for a total of around 4 hours
of video content. The videos were manually
annotated and the comparison between ground truth
and automatic annotation was performed on a per-
frame basis.
Table 1 shows the results of the classification of
the TED videos, while Table 2 shows the results of
the classification for the VideoLectures videos.
The average accuracy for the videos in the TED
dataset is 92.1%, while for the VideoLectures
dataset the average accuracy is 82.3%. This is
VISAPP2014-InternationalConferenceonComputerVisionTheoryandApplications
430

Table 1: Classification results on TED videos.
Video name
correct
frames
total
frames
accuracy
DAgus2009 36581 42585 85.9%
DLibeskind2009 25979 26763 97.1%
AMullins1998 37404 37404 100.0%
ASharkand2009 8650 10809 80.0%
NTurok2008 32433 35601 91.1%
Table 2: Classification results on VideoLectures videos.
Video ID
correct
frames
total
frames
accuracy
geanakoplos_lec18 85496 108125 79.1%
ekaykin_drilling 70000 80835 86.6%
somehow strange, given that the SVM used for the
latter used much more training samples.
The explanation for this odd behaviour lies in the
fact that TED content is easier to annotate because
of the presence of hard cuts (which help selecting
the correct start and end time of each segment) and
because the TED videos are inherently easier to
classify, since TALK segments have similar colour
properties among the whole dataset and there are
very few MIX and BLACKBOARD segments,
which are more difficult to classify.
Table 3 shows the confusion matrix for the 2 test
videos from the VideoLectures dataset.
Table 3: Confusion matrix for VideoLectures videos.
Confusion PRES MIX TALK BBOARD
PRES 99.6% 0.1% 0% 0.3%
MIX 2.7% 71.0% 0.1% 26.2%
TALK 0% 0.2% 86.3% 13.5%
BBOARD 0.5% 15% 0% 84.5%
Accuracy = 82.3 %
It can be immediately noticed that the biggest
source of error is the misclassification of MIX
segments (the ones where both the lecturer and the
presentation are shown) as BLACKBOARD. The
annotation of PRESENTATION segments, on the
other hand, is almost flawless.
7.1 Annotation of Presentations
Three videos from the TED dataset were manually
annotated, labelling each frame in presentation
segments where an animation, a slide transition or
dynamic content occurred. The ground truth was
then compared with the detection results obtained by
the system.
Table 4 summarizes the results, showing the
number of animations and slide transition detected
by the system compared with the ground truth, as
well as the values of precision, recall and accuracy
obtained for the detection of dynamic content.
The algorithm proved to be particularly effective
in the detection of animation and slide transition,
with no false detection and just 3 slide transitions
and 1 animation missed. The detection of dynamic
content also performed well, with the lower recall
value caused by two missed detections. The reason
for these false negatives in this case is due to the fact
that the video content inside the presentation varies
too slowly and the algorithm is not sensitive enough
to detect such amount of change.
Table 4: Performance of the presentation segments
analysis algorithm.
Detected Missed Total
Transition 96.3% 3.7% 100%
Animation 96.1% 3.9% 100%
Precision Recall Accuracy
Dyn. Content 88.4% 61.2% 92.9%
8 CONCLUSIONS
A new system for semantic video segmentation and
classification based on SVM has been developed. A
tool to detect animation and dynamic content inside
presentation segments was also described. The main
difference to previous approaches is that no shot cut
detection is required. The classification is performed
on frame basis followed by a post-processing step to
merge clusters of same classes. This allows content
based video annotation, if no clear shot boundaries
are present in the video.
The system was tested on videos from two
datasets and the results of the classification and of
the presentation segments analysis are promising.
There are several ways to further improve the
system. The first idea is to extend the system
extracting other features (e.g. via the implementation
of an OCR module, which could improve the
classification of BLACKBOARD segments) and re-
train the classifiers. Another option is to add new
classes (like Q&A or AUDIENCE, for example) to
further extend the segmentation with different
semantic concepts.
Finally, the aim is to extend the system to
provide video browsing capabilities, as well as a
recommender system.
SVM-basedVideoSegmentationandAnnotationofLecturesandConferences
431

ACKNOWLEDGEMENTS
This work was supported by the European Union
(Networked Media and Search Systems) under the
inEvent project (Accessing Dynamic Networked
Multimedia Events), contract number ICT-287872
(http://www.inevent-project.eu).
REFERENCES
Brezeale D., Cook D. J., Automatic Video Classification:
A Survey of the Literature, Systems, Man, and
Cybernetics, Part C: Applications and Reviews, IEEE
Transactions, vol. 38, issue 3, 2007.
Carrato I. K., Video Segmentation: A Survey. Signal
Processing: Image Communication, 477-500, 2001.
Cortes C., Vapnik V., Support-vector networks. Machine
Learning, 273-297, 1995.
Chau M., Jay F., Nunamaker Jr., Ming L., Chen H.,
Segmentation of Lecture Videos Based on Text: A
Method Combining Multiple Linguistic Features,
Proceedings of the 37th Hawaii International
Conference on System Sciences. Hawaii, USA, 2004.
Friedland G., Rojas R.: Anthropocentric Video
Segmentation for Lecture Webcasts. EURASIP
Journal on Image and Video Processing, Volume
2008, Hindawi Publishing Corporation, 2008.
Hauptmann A., Yan R., Qi Y., Jin R., Christel M.,
Derthick M., Chen M.-Y., Baron R., Lin W.-H., Ng
T.D., Video classification and retrieval with the
informedia digital video library system, Text Retrieval
Conf. (TREC 2002), pp. 119-127, Gaithersburg, MD.
Huang J. et al., Integration of multimodal features for
video scene classification based on HMM, Multimedia
Signal Processing, 1999 IEEE 3rd Workshop on.
IEEE, 1999.
Kalaiselvi Geetha M., Palanivel S., Ramalingam V., A
novel block intensity comparison code for video
classification and retrieval, Expert Systems with
Applications, Volume 36, Issue 3, Part 2, April 2009,
Pages 6415-6420,
Kobla V., DeMenthon D., Doermann D., Identifying
sports videos using replay, text, and camera motion
features, Proc. SPIE Conf. Storage Retrieval Media
Databases, 2000, pp. 332–343.
Kueblbeck C., A. E. (2006). Face detection and tracking in
video sequences using the modified census
transformation. Journal on Image and Vision
Computing, vol. 24, issue 6, pp. 564-572.
http://www.iis.fraunhofer.de/bf/bsy/fue/isyst.
Lin, C.-C. C.-J. (2011). LIBSVM : a library for support
vector machines. ACM Transactions on Intelligent
Systems and Technology, S. 1-27.
Lin W.-H., Hauptmann A., News video classification
using SVM-based multimodal classifiers and
combination strategies, Proceedings of the tenth ACM
international conference on Multimedia
(MULTIMEDIA '02). ACM, New York, NY, USA,
323-326.
Malioutov M., Barzilay R., 2006. Minimum cut model for
spoken lecture segmentation, Proceedings of the 21st
International Conference on Computational
Linguistics and the 44th annual meeting of the
Association for Computational Linguistics., pp. 25-32.
Moncrieff S., Venkatesh S., Dorai C., Horror film genre
typing and scene labeling via audio analysis, Proc.
Int. Conf. Multimedia Expo (ICME 2003), vol. 1, pp.
193–196.
Mukhopadhyay S., Smith B., Passive capture and
structuring of lectures. Proceedings of the seventh
ACM international conference on Multimedia (Part 1)
(MULTIMEDIA '99). ACM, New York, NY, USA,
477-487.
Ngo C.-W., Wang F., Pong T.-C., Structuring Lecture
Videos for Distance Learning Applications, Proc.
Multimedia Software Eng., pp. 215-222, 2003.
Pan J.-Y., Faloutsos C., Videocube: A novel tool for
video mining and classification, Int. Conf. Asian Digit.
Libr., Singapore, 2002.
Roach M., Mason J., Xu L.-Q., Video genre verification
using both acoustic and visual modes, Multimedia
Signal Processing, 2002 IEEE Workshop on. IEEE,
2002.
Robson G. D., The Closed Captioning Handbook.
Burlington, MA. Focal Press, 2004.
Subashini, K., Palanivel , S. and Ramalingam , V. , Audio-
Video Based Classification Using SVM. The IUP
Journal of Science & Technology, Vol. 7, No. 1, pp.
44-53, March 2011.
Vakkalanka S., Krishna Mohan, C., Kumara Swamy, R.,
Yegnanarayana, B., Content-Based Video
Classification Using Support Vector Machines.
ICONIP 2004: 726-731.
Vapnik, V.N. The Nature of Statistical Learning Theory.
2
nd
ed. Springer, New York, 2000.
Yamamoto N., Ogata J., Ariki Y., Topic segmentation and
retrieval system for lecture videos based on
spontaneous speech recognition, Proc. Eurospeech,
2003, pp. 961–964.
Zhang H., Kankanhalli A., Smoliar, S.W., Automatic
partitioning of full-motion video. Multimedia Syst.,
1(1):10–28, Jan. 1993.
TED, http://www.ted.com/, last checked on July 2013.
VideoLectures, http://videolectures.net/, last checked on
July 2013.
VISAPP2014-InternationalConferenceonComputerVisionTheoryandApplications
432
