
Image Compensation for Improving Extraction of Driver’s
Facial Features
Jung-Ming Wang
1
, Han-Ping Chou
2
, Sei-Wang Chen
1
and Chiou-Shann Fuh
3
1
Department of Computer Science and Information Engineering, National Taiwan Normal University, Taipei, Taiwan
2
Department of Information Management, Chung-Hua University, Hsinchu, Taiwan
3
Department of Computer Science and Information Engineering, National Taiwan University, Taipei, Taiwan
Keywords: Vision System, Face Detection, Facial Feature Detection, Image Compensation, Specified Histogram
Equalization.
Abstract: Extracting driver’s facial feature helps to identify the vigilance level of a driver. Some research about facial
feature extraction also has been developed for controlled interface of vehicle. To acquire facial feature of
drivers, research using various visual sensors have been reported. However, potential challenges to such a
work include rapid illumination variation resulting from ambient lights, abrupt lighting change (e.g.,
entering/exiting tunnels and sunshine/shadow), and partial occlusion. In this paper, we propose an image
compensation method for improve extraction of a driver’s facial features. This method has the advantages of
fast processing and high adaptation. Our experiments show that the extraction of driver’s facial features can
be improved significantly.
1 INTRODUCTION
Extracting driver’s face features plays an important
role to know the driver’s attention level. Some facial
expression approach (Hayami et al., 2002), (Jabon et
al., 2011), (Ji et al., 2004), (Lalonde et al., 2007),
(McCall et al., 2007), (Park et al., 2006), (Smith et
al., 2003), is primarily motivated by the human
visual system that can effortlessly identify the
vigilance level of a person based on his/her facial
expressions. Facial expressions convey inward
feelings, including both psychological (e.g., cheer,
anger, delight, disgust, fear, and surprise) and
physiological (e.g., vitality, fatigue, drowsiness,
alertness, distraction, attention, drunkenness, and
illness) reactions. The associated facial expressions
include eye blinking, gaze fixation, yawn, and head
nodding.
A driver may drop the attention on road while
setting the equipment (e.g., radio, navigation system,
or air conditioner) of the vehicle. To avoid such
problem, some research about facial feature
extraction has been developed for controlling
interface (Ohno, 1998). This system could be
controlled by head orientation (Hongo et al., 1997),
eyeball orientation (Oh and Kwak, 2012), and facial
expression (Lyons, 2004). The correctness of the
facial feature extraction plays an important role for
this area. Some companies, such as Seeing
Machines, SmartEye, or Attention Technology Inc.,
have provided the systems of facial feature
extraction. Most of them work well in the
environment under control, but cannot tolerate the
various illuminations in the real driving.
Using camera to capture the facial feature of the
driver has many advantages: First, cameras are easy
to set up and easy to maintain. Second, it would not
influence the people's driving. Third, monitoring
image could provide more information, such as the
face orientation (Zhang and Gang, 2011), than the
other systems. However, very few works (McCall et
al., 2007), (Smith et al., 2003), and (Takai et al.,
2003), considered the facial feature detection of
drivers from their color videos inside vehicles.
Potential challenges to such a work include video
instability due to moving vehicles, rapid illumination
variation resulting from ambient lights, abrupt
lighting change (e.g., entering/exiting tunnels and
sunshine/shadow), and partial occlusion.
To acquire facial expressions of drivers under
rapid illumination variation, various visual sensors
have been reported. In (Hayami et al., 2002), they
incorporated a CCD camera, a mirror, and an
infrared LED in a headgear for detecting and
329
Wang J., Chou H., Chen S. and Fuh C..
Image Compensation for Improving Extraction of Driver’s Facial Features.
DOI: 10.5220/0004690003290338
In Proceedings of the 9th International Conference on Computer Vision Theory and Applications (VISAPP-2014), pages 329-338
ISBN: 978-989-758-003-1
Copyright
c
2014 SCITEPRESS (Science and Technology Publications, Lda.)

tracking driver’s eye. The headgear with its own
light source and a special configuration between the
camera and the mirror successfully avoids the
disturbances of ambient lights. In (Lalonde et al.,
2007), they used a near-infrared (NIR) source to
illuminate the driver’s face, which is then captured
by an ordinary black/white camera. Facial features
manifesting relatively low contrasts in the images
increase their reliability of detection. In (Park,
2006), they projected an infrared (IR) light in a
pulsed form onto the driver’s face, which is next
captured by a CCD camera in synchronization with
the IR pulse. Face images produced by this way can
remain stable over a large range of illumination
variation. In (Ji et al., 2004), they built an
illuminator consisting of two sets of IR LEDs. These
two sets of LEDs were synchronized so that the sub-
images formed from the even and odd fields of an
image acquired using a narrow-angle CCD camera
contain bright and dark pupils, respectively. Taking
difference between these two sub-images, pupils
were highlighted in the resulting image.
Both IR and NIR illuminators can work well
under controlled environments but they suffer from
strong lights, dynamic backgrounds, and limited
ranges of distance. Another drawback with the IR
and NIR illuminators is their restricted spectral
bands. This forces their accompanying visual
sensors to overlook the other spectral information.
However, it has been known that color information
provides important cues for object detection,
tracking and recognition (Lukac and Plataniotis,
2007). There have been a larger number of face
detection researches based on chromatic evidences
(Cooray and O’Connor, 2005), (Heishman and
Duric, 2007), (Sugimoto et al., 2005), (Takai et al.,
2003), (Zhang and Gang, 2006).
In this study, we develop an image compensation
method for an in-vehicle vision system for extracting
facial features including eyes, mouth, and head
orientation. The driver’s face is first located to
reduce the processing range. A face model is defined
here for locating the facial features. Image
compensation is designed to help the system to
tolerate the rapid illumination variation while
driving. The extracting results help to compute the
facial parameters and to estimate the degree of
drowsiness (Kao et al., 2010) or controlled interface
using facial features (Lyons, 2004).
The rest of this paper is organized as follows.
Section 2 outlines the proposed system, including its
configuration and workflow. Section 3 describes our
image compensation. Section 4 summarizes the
implementations of face locating and facial features
locating. Section 5 demonstrates the feasibility of
the proposed system. Concluding remarks and future
work are given in Section 6.
2 FACIAL FEATURE
EXTRACTION SYSTEM
In this section, the configuration and workflow of
the proposed system are described.
2.1 System Configuration
The system is composed of three major components:
a video camera, a host computer, and a warning
device. Of these, the camera plays the most
important role in determining the technique and
workflow of the system. Proper installation of the
camera can reduce the degrees of difficulty. Takai et
al. (Takai et al., 2003) mounted their video camera
on the rearview mirror. As drivers usually adjust the
rearview mirror before driving, by appropriately
configuring the camera and the mirror, the driver’s
face can always be captured by the camera.
However, since the rearview mirror is located
around the middle of the front windshield, a camera
mounted on the mirror gives rise to side-view
images of the driver. Consequently, the facial
features of the driver are easily occluded when the
driver slightly turns their head. In this study, we
place a video camera on the top of the dashboard
directly behind the steering wheel (see Figure 1(a)).
The camera has a tilt angle of approximately 30
degrees and is pointing at the driver’s face. Figure
1(b) shows an image taken by the video camera of a
driver.
Figure 1: (a) Installation of the video camera and (b)
example image.
2.2 System Workflow
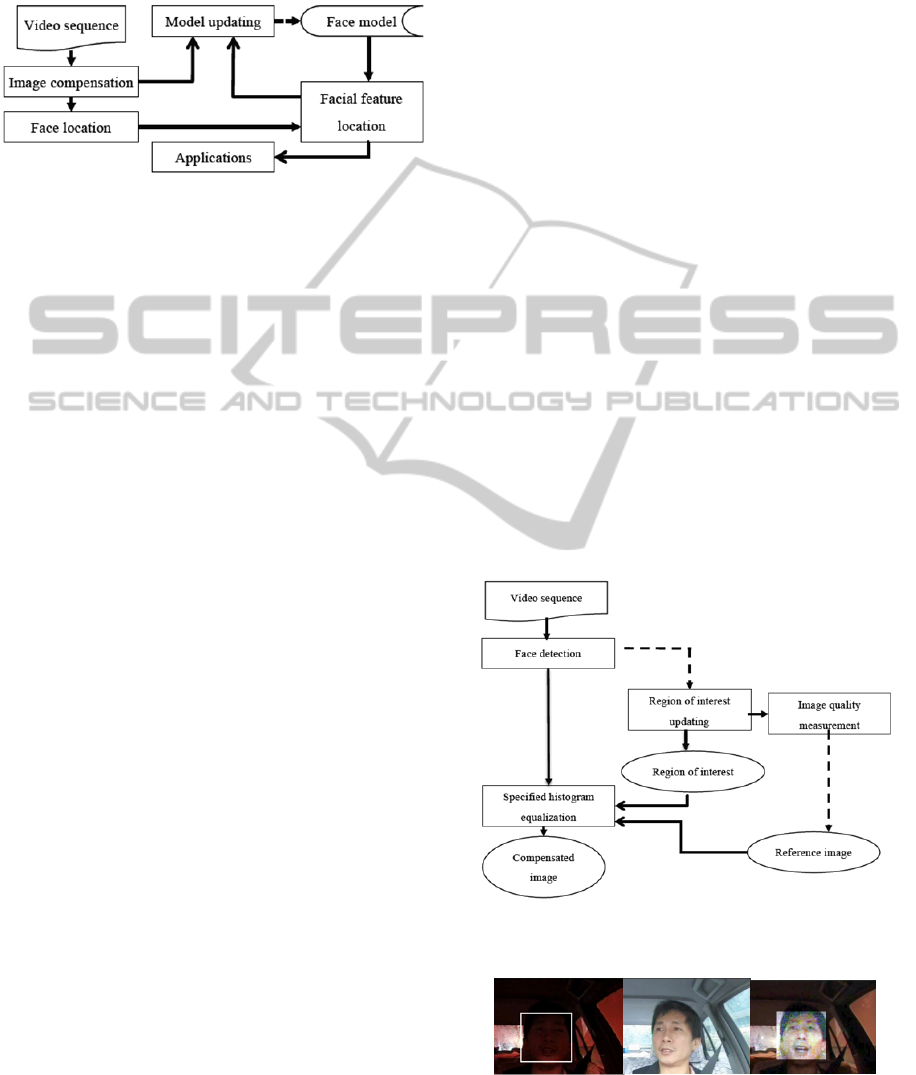
Figure 2 shows a block diagram for the proposed
facial feature extraction system. There are four
major blocks involved in the diagram, listed as
image compensation, face location, facial feature
location, and model updating. We will address the
VISAPP2014-InternationalConferenceonComputerVisionTheoryandApplications
330
final block—applications, such as reasoning—in
future work. Each block corresponds to an essential
step of the system and will be discussed later in this
paper.
Figure 2 Block diagram for the proposed facial feature
extraction system.
In relation to an input video sequence, image
compensation is designed to handle the various
illuminations in the environment. The driver’s face
is then located in the video image. Next, facial
features, including the eyes and mouth, are located
within the located face region with the aid of a
predefined face model. Three detectors have been
trained by AdaBoost to detect face, eye and mouth
features in images. The system updates the face
model according to the detected facial features to
preserve their most recent structure for later use. The
dashed arrow shows that the face model is updated
occasionally.
3 IMAGE COMPENSATION
When a vehicle moves on the road, it may be subject
to many different kinds of illumination, such as in a
tunnel, under a shadow, in the sun, or under clouds.
Capturing a video sequence under different
illumination conditions will obtain monitoring
images with different contrasts and colors. Since the
Viola–Jones-like detector mainly relies on the
contrast of an image, changes in illumination can
vary the effectiveness of the detector. In an
environment with low illumination, the contrast of
the monitoring image may be too low to detect facial
features.
Similar issues can occur in the tracking step.
Most tracking processes rely on consistency in the
target’s appearance. However, a vehicle moving
through different environments may be subject to
changes in illumination conditions. Some
illumination-invariant features, such as edges, can be
applied when developing a tracking algorithm
adapting to the changes in illumination. However,
these algorithms still cannot adapt to various
changes in real-world applications. In comparison to
a robust tracking algorithm, image compensation
requires less effort and has good performance. This
is the key motivation for developing image
compensation techniques.
Our image compensation technique includes
illumination and color compensation, as shown in
the flowchart in Figure 3. First, we apply a Viola–
Jones-like detector for face detection (Viola and
Jones, 2002) that is available in OpenCV
(Reimondo, 2010). Since the driver’s face often
appears in a particular region, we define this as our
region of interest (ROI). If any face is detected, the
face region is used to update the ROI. We show this
consideration as dashed arrow in Figure 3, and
Figure 4(a) shows an example of an ROI.
Additionally, an image with a face in it indicates
that the image is good enough for facial feature
extraction. This image is considered a candidate for
the reference image. The quality of the candidate is
measured and selected as the reference image if its
quality is higher than the current one. Such
consideration is also shown as dashed line in Figure
3. The first frame in the video sequence is set as the
reference image when the system is initialized.
Regardless of whether a face is detected from the
input image, each image is compensated using a
histogram equalization that matches the desired
histogram specified from the reference image in the
Figure 3: Flowchart for our image compensation
technique.
Figure 4: (a) The region of interest (marked by the
square), (b) The reference image, and (c) The
compensated image.
ImageCompensationforImprovingExtractionofDriver'sFacialFeatures
331

ROI. Figures 4(b) and (c) show the reference image
and the compensated image, respectively. In the
following subsections, we detail the main processes.
3.1 Updating the Region of Interest
The driver’s face often appears in a particular
region, and this region is set as the ROI for image
compensation. It is represented by a square with two
pairs of random variables: the central location (X, Y)
and region size (W, H) (width and height). A
Gaussian distribution G
A
(μ
A
, σ
A
) with mean μ
A
and
standard deviation σ
A
is assumed to be the
probability distribution, p
A
, that associates each
outcome of the random variable, A = X, Y, W, or H,
with a probability.
The corresponding parameters μ
A
and σ
A
are
updated using the following equations with a
learning rate α:
(1)
where μ
A,t
and σ
A,t
refer to the mean and standard
deviation values of G
A
at time t, and A(t) is the
function of parameter values, location (x, y) and size
(w, h), of the face region detected in the current
instance. These equations mean that we can update
the ROI by updating its parameters (X, Y, W, and H)
according to the current face region.
Since the ROI’s center is assumed to have a
normal distribution, there is an approximately 95%
probability that the ROI’s center is located in the
square region given by the coordinates
(μ
X
− 2σ
X
, μ
Y
− 2σ
Y
) for the top-left corner and
(μ
X
+ 2σ
X
, μ
Y
+ 2σ
Y
) for the bottom-right corner.
Similarly, with reference to the cumulative normal
distribution function, there is an approximately 84%
probability that the ROI’s width and height are less
than μ
W
+ σ
W
and μ
H
+ σ
H
, respectively. Let us define
a square region R given by the coordinates
(μ
X
− 2σ
X
− μ
W
− σ
W
, μ
Y
− 2σ
Y
− μ
H
− σ
H
) for the top-
left corner and (μ
X
+ 2σ
X
+ μ
W
+ σ
W
,
μ
Y
+ 2σ
Y
+ μ
H
+ σ
H
) for the bottom-right corner.
Then, the probable proportion of the region of the
driver’s face enclosed by R will be
1−(1−95%)(1−84%) = 99%. Thus, finding the
driver’s face in this region can be guaranteed.
3.2 Image Quality Measurement
Some research has been proposed for assessing an
image’s quality (Ke et al., 2006). A higher quality
image typically has higher contrast. Several features,
such as distribution of edges, color distribution, or
hue count, have been used to measure contrast. In
this study, we measure the quality using the values
of six test attributes, which are denoted by A
1
to A
6
,
and defined as follows:
1. A
1
is the brightness level, which is computed by
the average of the intensity values. In most cases, an
image captured in a brighter environment will have
better quality. This attribute helps us to select those
images captured under high illumination.
2. A
2
is the standard deviation of the intensity
values. This concept comes from histogram
equalization, which is a well-known method for
increasing the global contrast of an image. Since an
image with histogram equalization has a higher
standard deviation of intensity values, we can
assume that an image with higher standard deviation
will have higher contrast.
3. A
3
is the standard deviation of hue values. An
image captured under sunshine would be more
colorful than one captured under clouds or in a
tunnel. A colorful image is assumed to have a high
standard deviation of hue values.
4. A
4
is the number of pixels with skin color. Since
the majority of a driver’s face is skin, we assume
that a larger region of skin color implies that the
vehicle is exposed to normal light.
5. A
5
is the number of edge points. High-frequency
edges of an image not only show the contrast of the
image, but also indicate that there are subjects in it.
6. A
6
is computed in the frequency domain. After
representing the image in a frequency domain, such
as via a Fourier transform, we count the number of
points with a high-frequency value.
Generally speaking, an image with higher
attribute values can be selected as the reference
image. However, considering only one attribute
value in the selection of a reference image may
cause a bias problem. For example, using A
1
for
selection may lead to an image with over-exposure.
Alternatively, using A
6
may lead to the selection of
an image with high noise. Combining multiple
attributes for consideration may help to reduce the
influence of bias. Let us denote the set of attribute
values as S = {A
i
| i = 1, …, 6}. Then, the
possibilities for combination can be defined as the
power set of S, 2
S
, with elements {S
0,
…, S
63
}, where
S
k
contains the elements {A
i
| i-th bit of k in a binary
representation is 1.}.
To decide the best combination of attributes,
each set of attributes is applied for selecting the
reference image, and the compensated image based
on the selected reference image is evaluated by the
Viola–Jones-like detector. We compute the attribute
values in S
k
for the input image, and set the image as
A,t
(1
)
A,t1
A(t)
A,t
2
(1
)
A,t1
2
(A(t)
A,t
)
T
(A(t)
A,t
)
VISAPP2014-InternationalConferenceonComputerVisionTheoryandApplications
332
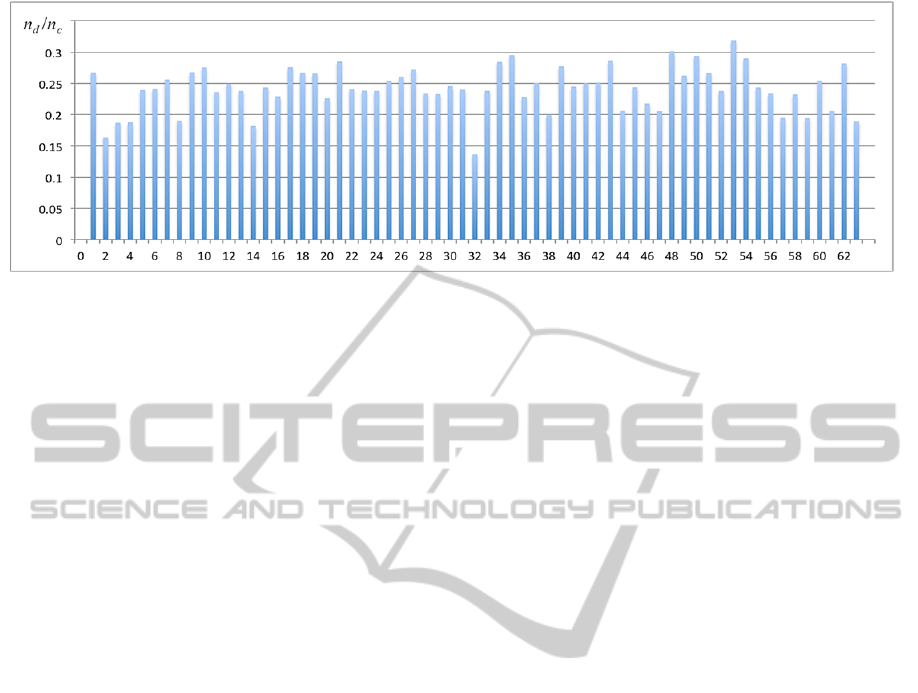
Figure 5: The success detection rate given different sets of attributes (x-axis).
the reference image if those values are larger than
the corresponding attribute values of the original
reference image. Viola–Jones-like detectors for
facial features (face, eyes, and mouth) are applied to
test the input and compensated image. In the entire
video sequence, let n
c
be the number of frames
(images) in which we cannot detect all facial
features. Among those frames, n
d
is the number of
frames in which we can detect all facial features
after compensating. After ten trials for the same
video sequence, we average n
c
and n
d
to compute the
success rate n
d
/ n
c
. Figure 5 shows the success rate
given different sets of attributes.
After testing S
k
, we found that there were no
significant differences between the success rates. In
other words, we can use any one of the attributes to
decide our reference image. However, since the
reference image decided according to S
53
= {A
1
, A
3
,
A
5
, A
6
} was the best performer, these attributes are
applied in the image quality measurement step to
select the reference image.
3.3 Specified Histogram Equalization
After we have the reference image, each frame of
the video sequence is enhanced using histogram
equalization, matching the desired histogram created
from the reference image in the ROI. Let p
r
(x) and
p
z
(x) be the original and desired histograms created
from the current frame and the reference image,
respectively. Their cumulative histograms T(x) and
G(x) are given by and
Each pixel with value x′ is then replaced with the
new value G
−1
(T(x′)), where G
−1
is the inverse
process of G. The above process is a well-known
image enhancement method, which is described in
more detail by Gonzalez and Woods. (Gonzalez and
Woods, 2007).
To avoid creating the histogram of the reference
image at each frame time, the histogram can be
normalized according to the size of the ROI. That is,
when the reference image is decided, a normalized
G(x) is created according to the ROI at that time. In
the following compensation for the image frame,
only T(x) needs to be created and normalized
simultaneously. Figure 4(c) shows an example of
image compensation. Unfortunately, the ratio of
light signal to noise is often small in an image
captured in low illumination. Increasing the intensity
of an image also increases noise. After
compensating the image, we cannot avoid obtaining
a noisy image such as that captured by a camera
with a high ISO speed.
4 FACE AND FACIAL FEATURE
LOCATING
We use the method proposed in (Wang, 2011) to
locate the facial features of a driver. In this method,
the face region is first located to reduce the region
for searching for facial features. A brief introduction
is given in the following sub-sections.
4.1 Face Locating
Face location can be divided into preprocessing and
main processing. In the preprocessing stage, we try
to locate the driver’s face without a priori
knowledge. This process consists of two steps:
motion detection and face detection. Motion
detection is designed to reduce the processing range,
while face detection is designed to locate the
driver’s face in the range. In motion detection, we
compare two successive frames to obtain the
differences. The differences between two frames are
usually caused by object motion and illumination
T(x) p
r
(i)
i
0
x
G(x) p
z
(i)
i
0
x
ImageCompensationforImprovingExtractionofDriver'sFacialFeatures
333

change. We can assume that the illumination does
not have a significant change in a short time, so the
differences are due to the object moving. In the
monitoring range, most motion would be related to
the driver’s face.
The motion part obtained here is treated as a
mask image. We detect the driver’s face using the
Viola–Jones-like face detector among the
accumulated motion region. This will reduce the
processing time and limit the searching results in the
motion sections to avoid false alarms. After we have
the face region, we apply a tracking technique
instead of motion detection to the following frames
to obtain the expected face location. The tracking
result helps us to predict the face location and to
reduce the ROI in the following step. Mean-shift
(Cheng, 1995) is used for tracking here for two
reasons. First, we can suppose that the illumination
would not undergo significant change in two
successive image frames after image compensation,
so the faces in two frames would have a similar
color. We also suppose that the driver’s face could
not suddenly move while driving, so the face
position in the current image fame will be close to
that in the previous frame.
4.2 Facial Feature Locating
After the face location step, we will have the face
range, no matter the driver’s facing direction. In this
step, we try to locate the facial features, including
eyes and mouth, within the face region. The face
model is defined as the a priori knowledge of facial
features, which includes the feature values and their
relationships. The transformation state defines
parameters for transforming the face model onto the
image plane; these transformation results will
provide the a priori knowledge for measurement in
the feature prediction step. A particle filter is applied
here for prediction to help us compute the expected
transformation state for the current frame. Eye and
mouth detectors are applied in the neighborhood of
their expected positions to determine their accurate
positions. Detection and prediction results are then
used to update the transformation state and even the
face model.
4.3 Model Updating
The updating step is designed for two purposes. The
first is to update the transformation state by
replacing the previous transformation state s
t−1
with
the current
s
t
*
and use
s
t
*
as s
t
in the next time t+1,
which is a traditional step in particle filtering. The
second is to update the face model with the current
driver’s face and to match the driver’s pose. Our
tracking algorithm for facial features is designed
using the information of the face model. If the face
model matches the current driver’s facial features,
we will have a better tracking result. The model
updating is designed for the following four reasons.
First, the face model is designed using some initial
parameter values. Updating the model will let the
parameter values match the current driver’s feature
values. Second, even though the face model matches
the current driver’s facial features, the driver may
change to a new one after a period of time. Third,
the illumination may change over time, and so will
the color information of the facial features. Finally,
the driver may have a slight pose change while
driving.
4.4 Discussion
The facial features may be failed to locate if they are
not shown in the scene along time. This would be
happened in many cases: For example, the driver has
a dark beard; the driver wears dark sunglasses; or the
driver is dark skin color. Because our compensation
method relies on the facial feature detection result
under ideal illumination, the above cases may
influence our compensation result. However, since
our method is designed for facial feature detection,
there will be no need to compensate the images in
which no facial features will be detected after
compensation.
5 EXPERIMENTAL RESULTS
The proposed driver’s drowsiness detection system
was developed using the Xcode run on an Intel Core
2 Duo 2 GHz PC running under Mac OS X. The
input video sequence to the system is set at a rate of
30 frames/second. The size of the video images is
320×240 pixels. We divide our experiments into two
parts. The first part examines the accuracies and
efficiencies of the face location steps of the system
process without image compensation. Each frame is
processed to obtain the result in 0.05 seconds. The
second part demonstrates the results of the facial
feature location with image compensation. Each
frame is processed to obtain the result in 0.08
seconds. The reference image selection and image
compensation require 0.03 seconds. Figure 6 shows
the sixteen video sequences tested in our system.
VISAPP2014-InternationalConferenceonComputerVisionTheoryandApplications
334
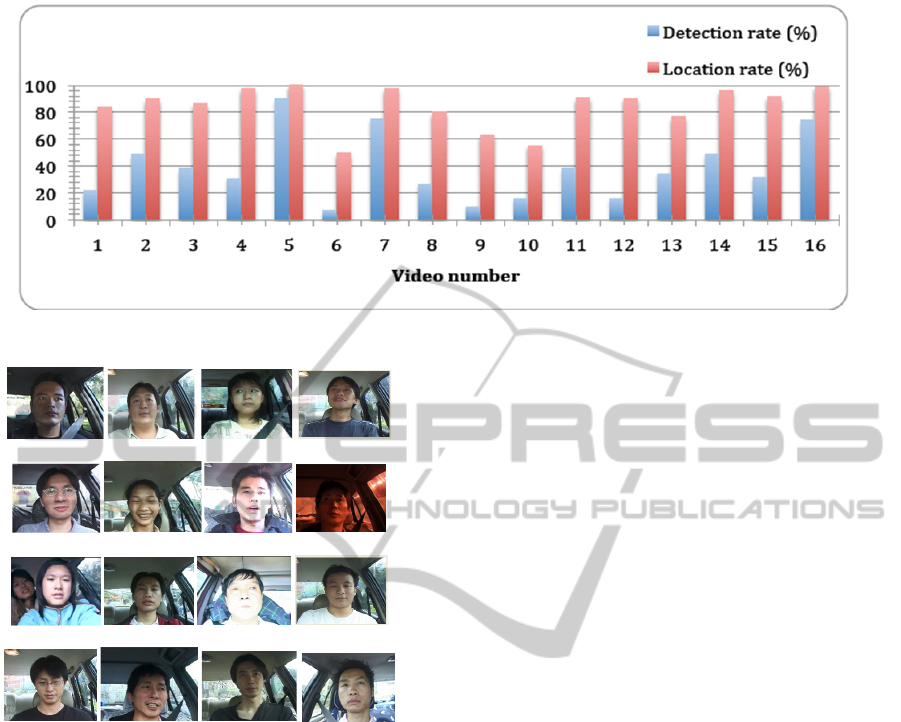
Figure 7: The comparisons of success detection rate (Y-axis) shown in chart.
video 1 video 2 video 3 video 4
video 5 video 6 video 7 video 8
video 9 video 10 video 11 video 12
video 13 video 14 video 15 video 16
Figure 6: Video sequences tested in our system.
5.1 Facial Feature Location
Figure 7 shows the comparison of success rates
between the location and detection using the method
proposed in (Wang, 2011). The success rate of
location is defined as the number of frames in which
the eyes and mouth are located simultaneously over
the total number of frames. The success rate of
detection is defined as the number of frames in
which the eyes and mouth are detected by the Viola–
Jones-like detector over the total number of frames.
The eyes and mouth are much harder to detect than
the
face. The experiments show that the success rate of
detection is often smaller than 50%, and that our method
can locate facial features over 80% of the time for most
sequences. As our method is based on the detection result,
it will have a higher success rate for location while the
success rate of detection is over 30%.
Most errors occurred due to unusual driving. In
video 6 and video 10, the drivers turn their heads
frequently and with large pan angles, so we could
not catch their faces most of the time. Video 8 was
extracted in the case of driving in a tunnel, which
has low illumination, leading to poor levels of
information (color or edge) for tracking or detection.
The video 15 is captured while the vehicle moved in
the urban road where the sunlight would be reflected
and occluded by the building, which cause abrupt
lighting change and false tracking. The locating
results can be improved with image compensation
that will be discussed in the next section.
5.2 Image Compensation
As mentioned before, low illumination will
influence the detection and tracking of facial
features. Our image compensation method provides
compensated images that help to reduce the
influence. In Figure 8, the vehicle is moved into the
tunnel and the light projecting on the face has
significant change along time. Facial features cannot
be located while the vehicle is moved into the
tunnel. The upper row shows the frames without
image compensation. We can see that the facial
features are failed to locate, but the facial features in
the bottom row can be located after applying our
image compensation method.
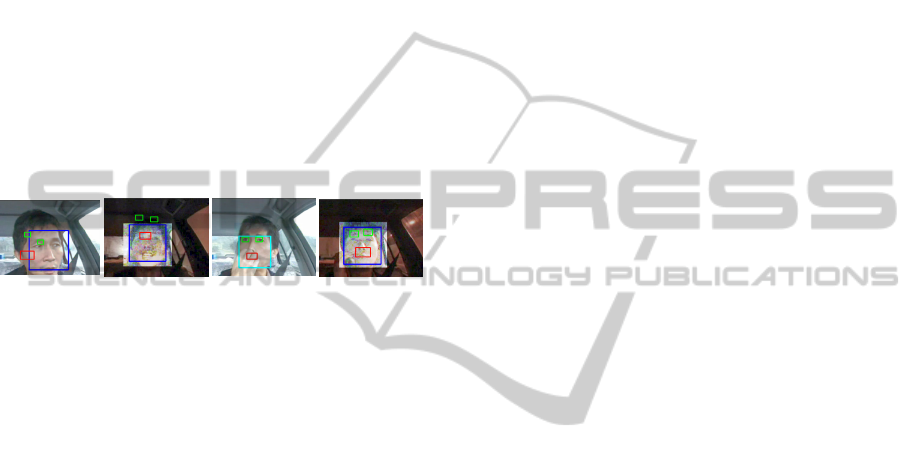
When the vehicle moves in the urban road, it
may suffer the illumination variation due to the
sunlight occluded or reflected by the building. Such
abrupt lighting change causes the problem of false
tracking as that shown in the upper row of Figure 9.
Our image compensation stabilizes the
illumination on the driver’s face in the image, so we
can track the facial features correctly as that show in
the bottom row of Figure 9.
To show the correctness over time, we count the
number n
d
of frames with the driver’s eyes and
ImageCompensationforImprovingExtractionofDriver'sFacialFeatures
335
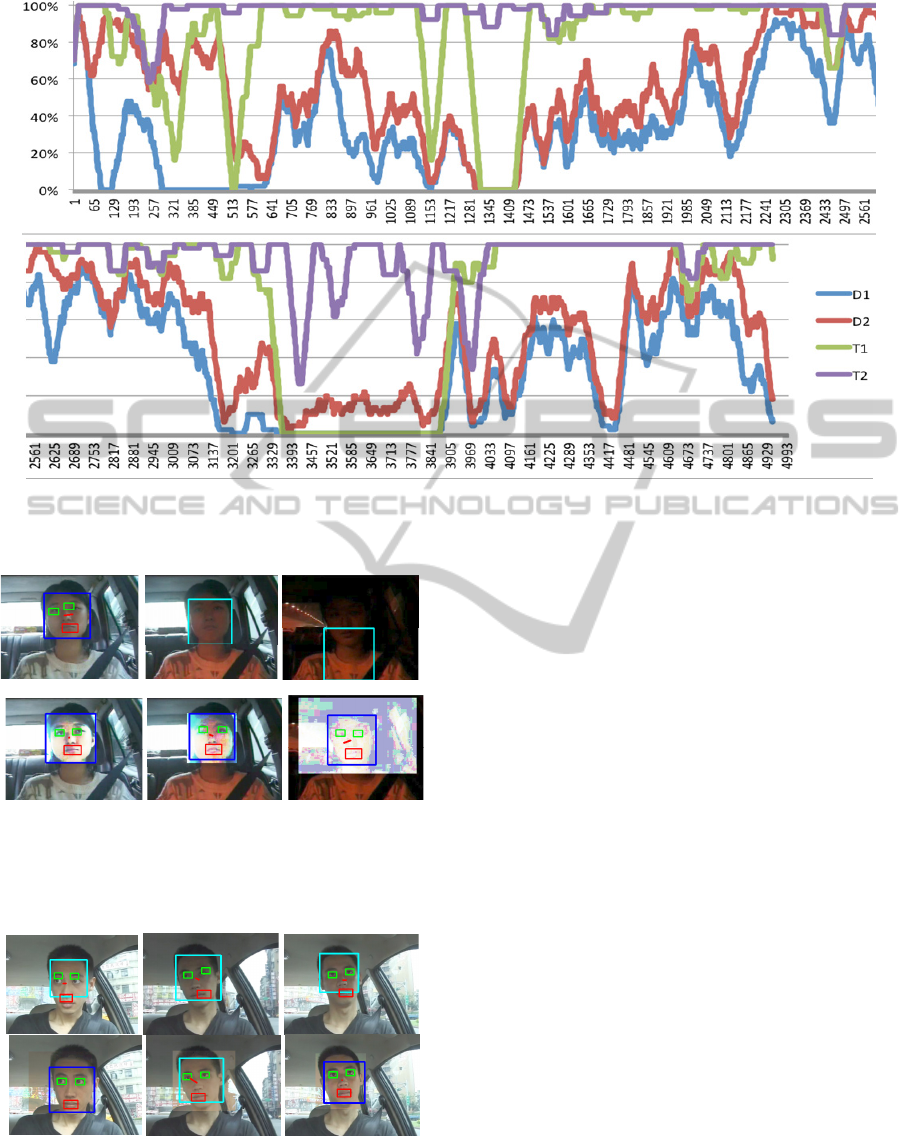
Figure 10: The success rate (y-axis) versus time (x-axis). Facial features are detected using the Viola–Jones-like detector
without (D1) and with image compensation (D2). T1 and T2 show the success rate of the method proposed in (Wang, 2011)
without and with image compensation, respectively. Note that this figure is warped.
Figure 8: The processing results of the image frames
extracted from video 3. Upper row shows the frames
without image compensation, and bottom row shows the
frames with image compensation. Squares show the
locating results of facial features.
Figure 9: The processing results of the image frames
extracted from video 15. Upper row shows the frames
without image compensation, and bottom row shows the
frames with image compensation. Squares show the
locating results of facial features.
mouth being located correctly in every period of
time. The level of correct detection is defined as
n
d
/n, where n is the frame number in this period
time. At each frame t, n
d
is computed from frame t to
frame t+n, and n is chosen as 50 in our application.
Figure 10 shows the location rate over time in video
8. This video is selected right here, because the
vehicle in this video is moved in many kinds of
environment, such as in urban, on a highway, in
tunnel, or under shadow. The location rates over
time are shown in this figure for comparison: In D1,
the facial features are located using Viola-Jones like
detector only and the images are not compensated,
while D2 are obtained after our image compensation
method. T1 and T2 are calculated while the facial
features are located using the method proposed in
(Wang et al., 2011) without and with image
compensation, respectively.
In driving, the driver may turn his head
randomly, and the Viola-Jones like detector may fail
to detect the facial features because of shape
distortion. Comparing T1 with D1 (or T2 with D2),
we can see that our tracking algorithm improves the
facial feature location in all of the time. As long as
the detection rate is over 30%, our proposed method
can locate the facial features over 90%. While we
compare D1 with D2 (or T1 with T2), we can see
that the image compensation plays an important role
in detection and tracking. Let us take the frame time
VISAPP2014-InternationalConferenceonComputerVisionTheoryandApplications
336
from 3361 to 3865 for example. The facial features
cannot be located before image compensation, but
the Viola-Jones like detector can detect the facial
features after image compensation.
Our proposed method using image compensation
has a very high location rate (94.9% on average)
except in the following situations. In frame 281 of
Figure 11, the driver moves his face forward, which
caused the shape distortion of his face and thus we
failed to locate his facial features. They will be
located again when the driver’s face returns to its
original position. When the vehicle moves in the
tunnel, the facial features are not visible in such low
illumination. Frame 2857 is a case where the facial
features are occluded (in this case by the driver’s
hand). Our tracking algorithm can predict the
expected position, but we still consider such a case
as a failed location.
Frame 281 Frame 1360 Frame 2857 Frame 3435
Figure 11: Illustrations of fail detection.
In frame 281, the driver moves his head forward and
outside the monitoring range. There is very
illumination in frame 1360, so we cannot see the
facial features, even after applying image
compensation. The facial features are occluded in
frame 2857. In frame 3435, the facial features
cannot be located due to low illumination and
occlusion.
6 CONCLUSIONS
While there have already been many vision systems
reported for detecting and monitoring driver
drowsiness or fatigue, few systems have utilized
chromatic images for their input data. In this article,
we presented a system for monitoring a driver’s
features using as input data color images acquired by
a video camera. Although colors provide rich
information, they suffer from low intensity and
brightness variation. Particularly in the case of
driving, due to the vehicle’s motion, the
environmental light projecting on the driver may
change rapidly. We introduced a method of image
compensation for handling these variations. This
process can significantly improve the location rate of
the facial features under traditionally poor
environments.
REFERENCES
Cheng, Y., 1995. Mean shift, mode seeking, and
clustering. In IEEE Trans. on Pattern Analysis and
Machine Intelligence, vol. 17, no. 8, pp. 790–799.
Cooray, S. and O’Connor, N., 2005. A hybrid technique
for face detection in color images. In IEEE
International Conference on Advanced Video and
Signal Based Surveillance, pp.253-258, Como.
Gonzalez, R. C. and Woods, R. E., 2007. Digital image
processing, Addison-Wesley Publishing Company.
Hayami, T., Matsunaga, K., Shidoji, K., and Matsuki, Y.,
2002. Detecting drowsiness while driving by
measuring eye movement - a pilot study. In Proc. of
IEEE 5
th
Int'l Conf. on Intelligent Transportation
Systems, pp. 156-161, Singapore.
Heishman, R. and Duric, Z., 2007. Using image flow to
detect eye blinking in color videos. In IEEE Workshop
on Applications of Computer Vision, pp. 52, Austin.
Hongo, H., Murata, A. and Yamamoto, K., 1997.
Consumer products user interface using face and eye
orientation. In IEEE International Symposiumon
Consumer Electronics, pp. 87-90.
Jabon, M. E., Bailenson, J. N., Pontikakis, E. Takayama,
L., Nass, C., 2011. Facial expression analysis for
predicting unsafe driving behavior. In IEEE Pervasive
Computing, vol. 10, no. 4.
Ji, Q., Zhu, Z. and Lan, P., 2004. Real-time nonintrusive
monitoring and prediction of driver fatigue. In IEEE
Trans. Vehicular Technology, vol. 53, no. 4, pp. 1052-
1068.
Kao, K. P., Lin, W. H., Fang, C. Y., Wang, J. M., Chang,
S. L., and Chen, S. W., 2010, Real-time vison-based
driver drowsiness/fatigue detection system. In
Vehicular Technology Conference (VTC 2010-Spring),
pp. 1-5, Taipei.
Ke, Y., Tang, X. and Jing, F., 2006. The design of high-
level features for photo quality assessment. In IEEE
Computer Society Conference on Computer Vision
and Pattern Recognition, vol. 1, pp. 419-426, New
York.
Lalonde, M., Byrns, D., Gagnon, L., Teasdale, N., and
Laurendeau, D., 2007. Real-time eye blinking
detection with GPU-based SIFT tracking. In Proc. of
4
th
Canadian Conf. on Computer and Robot Vision,
pp.481-487, Montreal.
Lukac, R. and Plataniotis, K. N., 2007. Color image
processing, methods and applications, CRC Press,
Taylor & Francis Group, New York.
Lyons, M.J., 2004. Facial gesture interfaces for expression
and communication. In IEEE Int’l Conf. on Systems
Man and Cybernetics, vol. 1, pp. 598-603, Kyoto.
McCall, J. C., Wipf, D. P., Trivedi, M. M., and Rao, B. D.,
2007. Lane change intent analysis using robust
operators and sparse Bayesian learning. In IEEE
Trans. on Intelligent Transportation Systems, vol. 8,
no. 3, pp. 431-440.
Oh, J. H. and Kwak, N., 2012. Recognition of a driver’s
gaze for vehicle headlamp control,” In IEEE Trans. on
Vehicular Technology, vol. 61, No. 5.
ImageCompensationforImprovingExtractionofDriver'sFacialFeatures
337

Ohno, T. 1998. Features of eye gaze interface for selection
tasks. In Proc. of the Third Asian Pacific Computer
and Human Interaction, pp. 176-181, Kangawa.
Park, I., Ahn, J. H. and Byun, H., 2006. Efficient
measurement of eye blinking under various
illumination conditions for drowsiness detection
systems. In Proc. of 18
th
Int’l Conf. on Pattern
Recognition, vol. 1, pp. 383-386, Hong Kong.
Reimondo, A. F., 2010. Haar Caasades, [Online].
Available: http://alereimondo.no-ip.org/OpenCV
(Accessed 6th November 2013).
Smith, P., Shah, M., and da Vitoria Lobo M., 2003.
Determining driver visual attention with one camera.
In IEEE Trans. on Intelligent Transportation Systems,
vol. 4, no. 4, pp. 205-218.
Sugimoto, A., Kimura, M. and Matsuyama, T., 2005.
Detecting human heads with their orientations. In
Electronic Letters on Computer Vision and Image
Analysis, vol. 5, no. 3, pp. 133-147.
Takai, I., Yamamoto, K., Kato, K., Yamada, K., and
Andoh, M. 2003. Robust detection method of the
driver’s face and eye region for driving support
system. In Proc. of Int’l Conf. on Vision Interface, pp.
148-153, Halifax.
Viola, P. and Jones, M., 2002. Fast and robust
classification using asymmetric adaboost and a
detector cascade. In Neural Information Processing
System, vol. 14, pp. 1311-1318.
Wang. J. M., Chou, H. P., Hsu, C. F., Chen, S. W., and
Fuh, C.S., 2011. Extracting driver’s facial features
during driving. In Int’l IEEE Conf. on Intelligent
Transportation Systems, pp. 1972-1977, Washington,
DC.
Zhang, M. and Gang, L., 2011. A recognition method of
driver’s facial orientation based on SVM. In Int’l
Conf. on Transportation, Mechanical, and Electrical
Engineering, Changchun.
Zhang, Z. and Zhang, J., 2006. A new real-time eye
tracking for driver fatigue detection. In Proc. of Int’l
Conf. on ITS Telecommunications, pp. 8-11, Chengdu.
VISAPP2014-InternationalConferenceonComputerVisionTheoryandApplications
338
