
Extracting Emotions and Communication Styles from Vocal Signals
Licia Sbattella, Luca Colombo, Carlo Rinaldi, Roberto Tedesco, Matteo Matteucci
and Alessandro Trivilini
Politecnico di Milano, Dip. di Elettronica, Informazione e Biongegneria, P.zza Leonardo da Vinci 32, Milano, Italy
Keywords:
Natural Language Processing, Communication Style Recognition, Emotion Recognition.
Abstract:
Many psychological and social studies highlighted the two distinct channels we use to exchange information
among us—an explicit, linguistic channel, and an implicit, paralinguistic channel. The latter contains infor-
mation about the emotional state of the speaker, providing clues about the implicit meaning of the message.
In particular, the paralinguistic channel can improve applications requiring human-machine interactions (for
example, Automatic Speech Recognition systems or Conversational Agents), as well as support the analysis
of human-human interactions (think, for example, of clinic or forensic applications). In this work we present
PrEmA, a tool able to recognize and classify both emotions and communication style of the speaker, relying
on prosodic features. In particular, communication-style recognition is, to our knowledge, new, and could be
used to infer interesting clues about the state of the interaction. We selected two sets of prosodic features,
and trained two classifiers, based on the Linear Discriminant Analysis. The experiments we conducted, with
Italian speakers, provided encouraging results (Ac=71% for classification of emotions, Ac=86% for classi-
fication of communication styles), showing that the models were able to discriminate among emotions and
communication styles, associating phrases with the correct labels.
1 INTRODUCTION
Many psychological and sociological studies high-
lighted the two distinct channels we use to exchange
information among us—a linguistic (i.e., explicit)
channel used to transmit the contents of a conver-
sation, and a paralinguistic (i.e., implicit) channel
responsible for providing clues about the emotional
state of the speaker and the implicit meaning of the
message.
Information conveyed by the paralinguistic chan-
nel, in particular prosody, is useful for many research
fields where the study of the rhythmic and intona-
tional properties of speech is required (Leung et al.,
2010). The ability to guess the emotional state of the
speaker, as well as her/his communication style, are
particularly interesting for Conversational Agents, as
could allow them to select the more appropriate re-
action to the user’s requests, making the conversation
more natural and thus improving the effectiveness of
the system (Pleva et al., 2011; Moridis and Econo-
mides, 2012). Moreover, being able to extract paralin-
guistic information is interesting in clinic application,
where psychological profiles of subjects and the clin-
ical relationships they establish with doctors could be
created. Finally, in forensic applications, paralinguis-
tic information could be useful for observing how de-
fendants, witnesses, and victims behave under inter-
rogation.
Our contribution lies in the latter research field;
in particular, we explore techniques for emotion and
communication style recognition. In this paper we
present an original model, a prototype (PrEmA -
Prosodic Emotion Analyzer), and the results we ob-
tained.
The paper is structured as follow. In Section 2
we provide a brief introduction about the relationship
among voice, emotions, and communication styles;
in Section 3 we present some research projects about
emotion recognition; in Section 4 we introduce our
model; in Section 5 we illustrate the experiments
we conducted, and discuss the results we gathered;
in Section 6 we introduce PrEmA, the prototype we
built; finally, in Section 7 we draw some conclusions
and outline our future research directions.
183
Sbattella L., Colombo L., Rinaldi C., Tedesco R., Matteucci M. and Trivilini A..
Extracting Emotions and Communication Styles from Vocal Signals.
DOI: 10.5220/0004699301830195
In Proceedings of the International Conference on Physiological Computing Systems (PhyCS-2014), pages 183-195
ISBN: 978-989-758-006-2
Copyright
c
2014 SCITEPRESS (Science and Technology Publications, Lda.)

2 BACKGROUND
2.1 The Prosodic Elements
Several studies investigate the issue of characteriz-
ing human behaviors through vocal expressions; such
studies rely on prosodic elements that transmit essen-
tial information about the speaker’s attitude, emotion,
intention, context, gender, age, and physical condition
(Caldognetto and Poggi, 2004; Tesser et al., 2004;
Asawa et al., 2012).
Intonation makes spoken language very different
from written language. In written language, white
spaces and punctuation are used to separate words,
sentences and phrases, inducing a particular “rhythm”
to the sentences. Punctuation also contributes to
specify the meaning to the whole sentence, stressing
words, creating emphasis on certain parts of the sen-
tence, etc. In spoken language, a similar task is done
by means of prosody—changes in speech rate, dura-
tion of syllables, intonation, loudness, etc.
Such so-called suprasegmental characteristics
play an important role in the process of utterance
understanding; they are key elements in expressing
the intention of a message (interrogative, affirmative,
etc.) and its style (aggressive, assertive, etc.) In
this work we focused on the following prosodic
characteristics (Pinker and Prince, 1994): intonation,
loudness, duration, pauses, timbre, and rhythm.
Intonation(or tonal Variation, or Melodic Contour)
is the most important prosodic effects, and deter-
mines the evolution of speech melody. Intonation is
tightly related to the illocutionary force of the utter-
ance (e.g., assertion, direction, commission, expres-
sion, or declaration). For example, in Italian intona-
tion is the sole way to distinguish among requests (by
raising the intonation of the final part of the sentence),
assertions (ascending intonation at the beginning of
the sentence, then descending intonation in the final
part), and commands (descending intonation); thus,
it is possible to distinguish the question “vieni do-
mani?” (are you coming tomorrow?) from the as-
sertion “vieni domani” (you are coming tomorrow) or
the imperative “vieni domani!” (come tomorrow!).
Moreover, intonation provides clues on the distri-
bution of information in the utterance. In other words,
it helps in emphasizing new or important facts the
speaker is introducing in the discourse (for example,
in Italian, by means of a peak in the intonation con-
tour). Thus, intonation takes part in clarifying the
syntactic structure of the utterance.
Finally, and most important for our work, into-
nation is also related to emotions; for example, the
melodic contour of anger is rough and full of sudden
variations on accented syllables, while joy exhibits
a smooth, rounded, and slow-varying intonation.
Intonation also conveys the attitude of the speaker,
leading the hearer to grasp nuances of meaning, like
irony, kindness, impatience, etc.
Loudness is another important prosodic feature, and
is directly related to the voice loudness. Loudness
can emphasize differences in terms of meaning—an
increase of loudness, for example, can be related to
anger.
Duration (or Speech Rate) indicates the length of
phonetic segments. Duration can transmit a wide
range of meanings, such as speaker’s emotions; in
general, emotional states that imply psychophys-
iological activation (like fear, anger, and joy) are
correlated to short durations and high speech rate
(Bonvino, 2000), while sadness is typically related
to slow speech. Duration also correlates with the
speaker’s attitudes (it gives clues about courtesy,
impatience, or insecurity of the speaker), as well as
types of discourse (a homily will have slower speech
rate than, for example, a sport running commentary).
Pauses allow the speaker to take breath, but can
also be used to emphasize parts of the utterance,
by inserting breaks in the intonation contour; from
this point of view, pauses correspond to punctuation
we add in written language. Pauses, however, are
much more general and can convey a larger variety of
nuances than punctuation.
Timbre –such as falsetto, whisper, hoarse voice,
quavering voice– often provide information about the
emotional state and health of the speaker (for exam-
ple, a speaker feeling insecure is easily associated
with quavering voice). Timbre also depends on the
mount of noise affecting the vocal emission.
Rhythm is a complex prosodic element, emerging
from joint action of several factors, in particular
intonation, loudness, and duration. It is an intrinsic
and unique attribute of each language.
In the following, we present some studies that try
to model the relationship among prosody, emotions,
and communication styles.
2.2 Speech and Emotions
Emotion is a complex construct and represents a com-
ponent of how we react to external stimuli (Scherer,
PhyCS2014-InternationalConferenceonPhysiologicalComputingSystems
184

2005). In emotions we can distinguish:
• A neurophysiological component of activation
(arousal).
• A cognitive component, through which an indi-
vidual evaluates the situation-stimulus in relation
to her/his needs.
• A motoric component, which aims at transform-
ing intentions in actions.
• An expressive component, through which an in-
dividual expresses her/his intentions in relation to
her/his level of social interaction.
• A subjective component, which is related to the
experience of the individual.
The emotional expression is not only based on lin-
guistic events, but also on paralinguistic events, which
can be acoustic (such as screams or particular vocal
inflections), visual (such as facial expressions or ges-
tures), tactile (for example, a caress), gustatory, olfac-
tory, and motoric (Balconi and Carrera, 2005; Planet
and Iriondo, 2012). In particular, the contribution of
non-verbal channels on the communication process is
huge; according to (Mehrabian, 1972) the linguistic,
paralinguistic, and motoric channels, constitutes, re-
spectively, 7%, 38%, and 55% of the communication
process. In this work, we focused on the acoustic par-
alinguistic channel.
According to (Stern, 1985), emotions can be di-
vided in: vital affects (floating, vanishing, spend-
ing, exploding, increasing, decreasing, bloated, ex-
hausted, etc.) and categorical affects (happiness, sad-
ness, anger, fear, disgust, surprise, interest, shame).
The former are very difficult to define and recognize,
while the latter can be more easily treated. Thus, in
this work we focused on categorical affects.
Finally, emotions have two components—an he-
donic tone, which refers to the degree of pleasure, or
displeasure, connected to the emotion; and an activa-
tion, which refers to the intensity of the physiological
activation (Mandler, 1984). In this work we relied on
the latter component, which is easier to measure.
2.2.1 Classifying Emotions
Several well-known theories for classifying emotions
have been proposed. In (Russell and Snodgrass,
1987) authors consider a huge number of character-
istics about emotions, identifying two primary axes:
pleasantness / unpleasantness and arousal / inhibition.
In (Izard, 1971) the author lists 10 primary emo-
tions: sadness, joy, surprise, sadness, anger, dis-
gust, contempt, fear, shame, guilt; in (Tomkins, 1982)
the latest one is eliminated; in (Ekman et al., 1994)
a more restrictive classification (happiness, surprise,
fear, sadness, anger, disgust) is proposed.
In particular, Ekman distinguishes between pri-
mary emotions, quickly activated and difficult to con-
trol (for example, anger, fear, disgust, happiness, sad-
ness, surprise), and secondary emotions, which un-
dergo social control and cognitive filtering (for exam-
ple, shame, jealousy, pride). In this work we focused
on primary emotions.
2.2.2 Mapping Speech and Emotions
As stated before, voice is considered a very reliable
indicator of emotional states. The relationship be-
tween voice and emotion is based on the assump-
tion that the physiological responses typical of an
emotional state, such as the modification of breath-
ing, phonation and articulation of sounds, produce de-
tectable changes in the acoustic indexes associated to
the production of speech.
Several theories have been developed in an effort
to find a correlation among speech characteristics and
emotions. For example, for Italian (Anolli and Ciceri,
1997):
• Fear is expressed as a subtle, tense, and tight tone.
• Sadness is communicated using a low tone, with
the presence of long pauses and slow speech rate.
• Joy is expressed with a very sharp tone and with
a progressive intonation profile, with increasing
loudness and, sometimes, with an acceleration in
speech rate.
In (Anolli, 2002) it is suggested that active emo-
tions produce faster speech, with higher frequencies
and wider loudness range, while the low-activation
emotions are associated with slow voice and low fre-
quencies.
In (Juslin, 1997) the author proposes a detailed
study of the relationship between emotion an prosodic
characteristics. His approach is based on time, loud-
ness, spectrum, attack, articulation, and differences in
duration (Juslin, 1998). Table 1 shows such prosodic
characterization, for the four primary emotions; our
work started from such clues, trying to derive mea-
surable acoustic features.
Relying on the aforementioned works, we decided
to focus on the following emotions: joy, fear, anger,
sadness, and neutral.
2.3 Speech and Communication Styles
The process of communication has been studied from
many points of view. Communication not only con-
veys information and expresses emotions, it is also
ExtractingEmotionsandCommunicationStylesfromVocalSignals
185

characterized by a particular relational style (in other
words, a communication style). Everyone has a rela-
tional style that, from time to time, may be more or
less dominant or passive, sociable or withdrawn, ag-
gressive or friendly, welcoming or rejecting.
2.3.1 Classifying Communication Styles
We chose to rely on the following simple classifica-
tion and description that includes three communica-
tion styles (Michel, 2008):
• Passive
• Assertive
• Aggressive
Passive communication imply not expressing hon-
est feelings, thoughts and beliefs. Therefore, allow-
ing others to violate your rights; expressing thoughts
Table 1: Prosodic characterization of emotions.
Emotion Prosodic feature
Joy
- quick meters
- moderate duration variations
- high average sound level
- tendency to tighten up the contrasts be-
tween long and short words
- articulation predominantly detached
- quick attacks
- brilliant tone
- slight or missing vibrato
- slightly rising intonation
Sadness
- slow meter
- relatively large variations in duration
- low noise level
- tendency to attenuate the contrasts be-
tween long and short words
- articulation linked
- soft attacks
- slow and wide vibrato
- final delaying
- soft tone
- intonation (at times) slightly declining
Anger
- quick meters
- high noise level
- relatively sharp contrasts between long
and short words
- articulation mostly not linked
- very dry attacks
- sharply stamp
- distorted notes
Fear
- quick meters
- high noise level
- relatively sharp contrasts between long
and short words
- articulation mostly not linked
- very dry attacks
- sharply stamp
- distorted notes
and feelings in an apologetic, self-effacing way, so
that others easily disregard them; sometimes showing
a subtle lack of respect for the other person’s ability
to take disappointments, shoulder some responsibil-
ity, or handle their own problems.
Persons with aggressive communication style
stand up for their personal rights and express their
thoughts, feelings and beliefs in a way which is usu-
ally inappropriate and always violates the rights of the
other person. They tend to maintain their superiority
by putting others down. When threatened, they tend
to attack.
Finally, assertive communication is a way of com-
municating feelings, thoughts, and beliefs in an open,
honest manner without violating the rights of others.
It is an alternative to being aggressive where we abuse
other people’s rights, and passive where we abuse our
own rights.
It is useful to learn the distinction among the ag-
gressive, passive, and assertive communication be-
haviors, because such psychological characteristics
provides clues on the prosodic parameters we can ex-
pect.
2.3.2 Mapping Speech and Communication
Styles
Starting from the aforementioned characteristics of
communication styles, considering the prosodic clues
provided in (Michel, 2008), and taking into account
other works (Hirshberg and Avesani, 2000; Shriberg
et al., 2000; Shriberg and Stolcke, 2001; Hastie et al.,
2001; Hirst, 2001), we came out with the prosodic
characterization showed in Table 2.
2.4 Acoustic Features
As we discussed above, characterizing emotional
states and communication styles associated to a vo-
cal signal implies measuring some acoustic features,
which, in turn, are derived from physiological reac-
tions. Table 1 and Table 2 provide some clues about
how to relate such physiological reactions to prosodic
characteristics, but we need to define a set of measur-
able acoustic features.
2.4.1 Acoustic Features for Emotions
We started from the most studied acoustic features
(Murray and Arnott, 1995; McGilloway et al., 2000;
Cowie et al., 2001; Wang and Li, 2012).
Pitch measures the intonation, and is represented by
the fundamental harmonic (F0); it tends to increase
for anger, joy, and fear; it decreases for sadness. Pitch
PhyCS2014-InternationalConferenceonPhysiologicalComputingSystems
186

Table 2: Prosodic characterization of communication styles.
Communication Prosodic feature
style
Passive
- flickering
- voice often dull and monoto-
nous
- tone may be sing-song or
whining
- low Volume
- hesitant, filled with pauses
- slow-fast or fast-slow
- frequent throat clearing
Aggressive
- very firm voice
- often abrupt, clipped
- often fast
- tone sarcastic, cold, harsh
- grinding
- fluent, without hesitations
- voice can be strident, often
shouting, rising at end
Assertive
- firm, relaxed voice
- steady even pace
- tone is middle range, rich and
warm
- not over-loud or quiet
- fluent, few hesitation
tends to be more variable for anger and joy.
Intensity represents the amplitude of the vocal signal,
and measures the loudness; intensity tends to increase
for anger and joy, decrease for sadness, and stay
constant for fear.
Time measures duration and pauses, as voiced and
unvoiced segments. High speech rate is associated
to anger, joy, and fear while low speech rate is
associated to sadness. Irregular speech rate is often
associated with anger and sadness. Time is also an
important parameter for distinguishing articulation
breaks (speaker’s breathing) from unvoiced segments.
The unvoiced segments represent silences—parts of
the signal where the information of the pitch and/or
intensity are below a certain threshold.
Voice Quality measures the timbre and is related to
variations of the voice spectrum, as to the signal-noise
ratio. In particular:
• Changes in amplitude of the waveform between
successive cycles (called shimmer).
• Changes in the frequency of the waveform be-
tween successive cycles (called jitter).
• Hammarberg’s index, which covers the difference
between the energy in the 0-2000 Hz and 2000-
5000 Hz bands.
• The harmonic/noise ratio (HNR) between the en-
ergy of the harmonic part of the signal and the
remaining part of the signal; see (Hammarberg
et al., 1980; Banse and Sherer, 1996; Gobl and
Chasaide, 2000).
High values of shimmer and jitter characterize, for ex-
ample, disgust and sadness, while fear and joy are dis-
tinguished by different values of the Hammarberg’s
index.
2.4.2 Acoustic Features for Communication
Styles
Starting from clues provided by Table 2, we decided
to rely on the same acoustic features we used for
the emotion recognition (pitch, intensity, time, and
voice quality). But, in order to recognize complex
prosodic variations that particularly affects communi-
cation style, we reviewed the literature and found that
research mostly focuses on the variations of tonal ac-
cents within a sentence and at a level of prominent
syllables (Avesani et al., 2003; D’Anna and Petrillo,
2001; Delmonte, 2000). Thus, we decided to add two
more elements to our acoustic feature set:
• Contour of the pitch curve
• Contour of the intensity curve
In Section 4.2 we will show how we measured the
feature set we defined for emotions and communica-
tion style.
3 RELATED WORK
Several approaches exist in literature for the task of
emotion recognition, based on classifiers like Support
Vector Machines (SVM), decision trees, Neural Net-
works (NN), etc. In the following, we present some
of such approaches.
The system described in (Koolagudi et al., 2011)
made use of SVM for classifying emotions expressed
by a group of professional speakers. The authors un-
derlined that, for extreme emotions (anger, happiness
and fear), the most useful information was contained
in the first words of the sentence, while last words
were more discriminative in case of neutral emotion.
The recognition Precision
1
of the system, on aver-
age, using prosodic parameters and considering only
the beginning words, was around 36%.
1
Notice that the performance index provided in this sec-
tion are indicative and cannot be compared each other, since
each system used its own vocal dataset.
ExtractingEmotionsandCommunicationStylesfromVocalSignals
187

The approach described in (Borchert and Diister-
hoft, 2005) used SVM, too, applying it to the Ger-
man language. In particular, this project developed
a prototype for analyzing the mood of customers in
call centers. This research showed that pitch and in-
tensity were the most important features for the emo-
tional speech, while features on spectral energy distri-
bution were the most important voice quality features.
Recognition Precision they obtained was, on average,
around 70%.
Another approach leveraged the Alternating De-
cision Trees (ADTree), for the analysis of humorous
spoken conversations from a classic comedy TV show
(Purandare and Litman, 2006); speaker turns were
classified as humorous or non-humorous. They used a
combination of prosodic (e.g., pitch, energy, duration,
silences, etc.) and non-prosodic features (e.g., words,
turn length, etc.) Authors discovered that the best set
of features was related to the gender of the speaker.
Their classifier obtained Accuracies of 64.63% for
males and 64.8% for females.
The project described in (Shi and Song, 2010)
made use of NN. The project used two databases of
Chinese utterances. One was composed of speech
recorded by non-professional speakers, while the
other was composed of TV recordings. They used
Mel-Frequency Cepstral Coefficients for analyzing
the utterances, considering six speech emotions: an-
gry, happiness, sadness, and surprised. They ob-
tained the following Precisions: angry 66%, happi-
ness 57.8%, sadness 85.1%, and surprised 58.7%.
The approaches described in (Lee and Narayanan,
2005) used a combination of three different sources
of information: acoustic, lexical, and discourse. They
proposed a case study for detecting negative and
non-negative emotions using spoken language com-
ing from a call center application. In particular, the
samples were obtained from real users involved in
spoken dialog with an automatic agent over the tele-
phone. In order to capture the emotional features
at the lexical level, they introduced a new concept
named “emotional salience”—an emotionally salient
word, with respect to a category, tends to appear more
often in that category than in other categories. For the
acoustic analysis they compared a K-Nearest Neigh-
borhood classifier and a Linear Discriminant Clas-
sifier. The results of the project demonstrated that
the best performance was obtained when acoustic and
language features were combined. The best perform-
ing results of this project, in terms of classification
errors, were 10.65% for males and 7.95% for females.
Finally, in (L
´
opez-de Ipi
˜
na et al., 2013) au-
thors focuses on “emotional temperature” (ET) as
a biomarker for early Alzheimer disease detection.
They leverages non linear features, such as the Frac-
tal Dimension, and rely on a SVM for classifying ET
of voice frames as pathological or non-pathological.
They claim an Accuracy of 90.7% to 97.7%.
Our project is based on a classifier that leverages
the Linear Discriminant Analysis (LDA) (McLach-
lan, 2004); such a model is simpler than SVM and
NN, and easier to train. Moreover, with respect to ap-
proaches making use of textual features, our model
is considerably simpler. Nevertheless, our approach
provides good results (see Section 5).
Finally, we didn’t find any system able to classify
communication styles so, to our knowledge, this fea-
ture provided by our system is novel.
4 THE MODEL
For each voiced segment, two set of features –one
for recognizing emotions and one for communication
style– were calculated; then, by means of two LDA-
based classifiers, such segments were associated with
emotion and communication style.
LDA-based classifier provided a good trade-off
between performance and classification correctness.
LDA projects vectors of features, which represents
the samples to analyze, to a smaller space. The
method maximizes the ratio of between-class vari-
ance to the within-class variance, permitting to maxi-
mize class separability. More formally, LDA finds the
eigenvectors
~
φ
i
that solve:
B
~
φ
i
− λW
~
φ
i
= 0 (1)
where B is the between-class scatter matrix and W is
the within-class scatter matrix. Once a sample ~x
j
is
projected on the new space provided by the eigenvec-
tors, the class
ˆ
k corresponding to the projection ~y
j
is
chosen according to (Boersma and Weenink, 2013):
ˆ
k = argmax
k
p(k|~y
j
) = argmax
k
−d
2
k
(~y
j
) (2)
where d
2
k
(·) is the generalized squared distance func-
tion:
d
2
k
(~y) = (~y −~µ
j
)
T
Σ
−1
k
(~y −~µ
j
)+
ln|Σ
k
|
2
−ln p(k) (3)
where Σ
k
is the covariance matrix for the class k and
p(k) is the a-priori probability of the class k:
p(k) =
n
k
∑
K
i=1
n
i
(4)
where n
k
is the number of samples belonging to the
class k, and K is the number of classes.
PhyCS2014-InternationalConferenceonPhysiologicalComputingSystems
188

4.1 Creating a Corpus
Our model was trained and tested on a corpus of sen-
tences, labeled with the five basic emotions and the
three communication styles we introduced. We col-
lected 900 sentences, uttered by six Italian profes-
sional speakers, asking them to simulate emotions and
communication styles. This way, we obtained good
samples, showing clear emotions and expressing the
desired communication styles.
4.2 Measuring and Selecting Acoustic
Features
Figure 1 shows the activities that lead to the calcula-
tion of the acoustic features: Preprocessing, segmen-
tation, and feature extraction. The result is the dataset
we used for training and testing the classifiers.
In the following, the aforementioned phases are
presented. The values shown for the various param-
eters needed by the voice-processing routines, have
been chosen experimentally (see Section 4.3.2 for de-
tails on how the values of such parameters were se-
lected; see Section 6 for details on Praat, the voice-
processing tool we adopted).
Segmentation
(voiced / unvoiced
segment labeling)
Vocal signal being analyzed Recorded vocal signals
Band pass filter
Normalization
Preprocessing
Raw data
extraction
Feature
calculation
Feature extraction
Training set
Test set
Figure 1: The feature calculation process.
4.2.1 Preprocessing and Segmentation
We used a Hann band filter, for removing useless
harmonics (F
Lo
=100Hz, F
Hi
=6kHz, and smoothing
w=100Hz). Then, we normalized the intensity of dif-
ferent audio files, so that the average intensity of dif-
ferent recordings was uniform and matched a prede-
fined setpoint. Finally, we divided the audio signal
into segments; in particular we divided voiced seg-
ments, where the average, normalized intensity was
above the threshold I
voicing
=0.45, and silenced seg-
ments, where the average, normalized intensity was
below the threshold I
silence
=0.03. Segments having
average, normalized intensity between the two thresh-
olds were not considered
2
.
4.2.2 Feature Calculation
For features related to Pitch, we used the following
range F
f loor
=75Hz, F
ceiling
=600Hz (such values are
well suited for male voices, as we used male subjects
for our experiments).
Among features related with Time, articulation
ratio refers to the amount of time taken by voiced seg-
ments, excluding articulation breaks, divided by the
total recording time; an articulation break is a pause
–in a voiced segment– longer than a given threshold
(we used the threshold T
break
=0.25s), and is used to
capture the speaker’s breathing. The speech ratio,
instead, is the percentage of voiced segments over
the total recording time. These two parameters are
very similar for short utterances, because articulation
breaks are negligible; for long utterances, however,
these parameters definitely differ, revealing that artic-
ulation breaks are an intrinsic property of the speaker.
Finally, unvoiced frame ratio is the total time of un-
voiced frames, divided by the recording total time
The speech signal, even if produced with maxi-
mum stationarity, contains variations of F0 and in-
tensity (Hammarberg et al., 1980); such variations
represents the perceived voice quality. The random
changes in the short term (micro disturbances) of F0
are defined as jitter, while the variations of the ampli-
tude are known as shimmer. The Harmonic-to-Noise
ratio (HNR) value is the “degree of hoarseness” of
the signal—the extent to which noise replaces the har-
monic structure in the spectrogram (Boersma, 1993).
Finally, the following features are meant to repre-
sent Pitch and Intensity contours:
• Pitch Contour
– Number of peaks per second. The number of
maxima in the pitch contour, within a voiced
segment, divided by the duration of the seg-
ment.
– Average and variance of peak values.
2
Such segments were considered too loud for being clear
silences, but too quiet for providing a clear voiced signal.
ExtractingEmotionsandCommunicationStylesfromVocalSignals
189

– Average gradient. The average gradient be-
tween two consecutive sampling points in the
pitch curve.
– Variance of gradients. The variance of such
pitch gradients.
• Intensity Contour
– Number of peaks per second. The number of
maxima in the intensity curve, within a voiced
segment, divided by the duration of the seg-
ment.
– Mean and variance of peak values.
– Variance of peak values.
– Average gradient. The average gradient be-
tween two consecutive sampling points in the
intensity curve.
– Variance of gradients. The variance of such in-
tensity gradients.
Table 3 and Table 4 summarized the acoustic fea-
tures we measured, for emotions and communication
styles, respectively.
Table 3: Measured acoustic features for emotions.
Features Characteristics
Pitch (F0)
Average [Hz]
Standard deviation [Hz]
Maximum [Hz]
Minimum [Hz]
25th quantile [Hz]
75th quantile [Hz]
Median [Hz]
Intensity
Average [dB]
Standard deviation [dB]
Maximum [dB]
Minimum [dB]
Median [dB]
Time
Unvoiced frame ratio [%]
Articulation break ratio [%]
Articulation ratio [%]
Speech ratio [%]
Voice quality
Jitter [%]
Shimmer [%]
HNR [dB]
The features we defined underwent a selection
process, aiming at discarding highly correlated mea-
surements, in order to obtain the minimum set of fea-
tures. In particular, we used the ANOVA and the LSD
tests.
The ANOVA analysis for features related to
emotions (assuming 0.01 as significance threshold)
found all the features to be significant, except Av-
erage Intensity. For Average intensity we leveraged
Table 4: Measured acoustic features for communication
style (features in italics have been removed).
Features Characteristics
Pitch (F0)
Average [Hz]
Standard deviation [Hz]
Maximum [Hz]
Minimum [Hz]
10th quantile [Hz]
90th quantile [Hz]
Median [Hz]
Pitch contour
Peaks per second [#peaks/s]
Average peaks height [Hz]
Variance of peak heights [Hz]
Average peak gradient [Hz/s]
Variance of peak gradients [Hz/s]
Intensity
Average [dB]
Standard deviation [dB]
Maximum [dB]
Minimum [dB]
10th quantile [dB]
90th quantile [dB]
Median [dB]
Intensity contour
Peaks per second [#peaks/s]
Average peak height [dB]
Variance of peaks heights [dB]
Average peak gradients [dB/s]
Variance of peak gradients [dB/s]
Time
Unvoiced frame ratio [%]
Articulation break ratio [%]
Articulation ratio [%]
Speech ratio [%]
Voice quality
Jitter [%]
Shimmer [%]
NHR [dB]
the Fischer’s LSD test, which showed that Aver-
age Intensity was not useful for discriminating Joy
from Neutral and Sadness, Neutral from Sadness, and
Fear from Anger. Nevertheless Average Intensity was
retained, as LSD proved it useful for discriminating
Sadness, Joy, and Neutral from Anger and Fear.
The ANOVA analysis for features re-
lated to communication style (assum-
ing 0.01 as significance threshold) found
eight potentially useless features: Aver-
age Intensity, 90 th quantile, Unvoiced frame ratio,
Peaks per second, Average peak gradient, Stan-
dard deviation peaks gradient, Median intensity,
and Standard deviation intensity. For such features
we performed the LSD test, which showed that
Peaks per second was not able to discriminate
Aggressive vs Assertive, but was useful for discrim-
inating all others communication styles and thus we
decided to retain it. The others seven features were
dropped as LSD showed that they were not useful for
discriminating communication styles.
After this selection phase, the set of features for
the emotion recognition task remained unchanged,
PhyCS2014-InternationalConferenceonPhysiologicalComputingSystems
190

while the set of features for the communication-style
recognition task was reduced (in Table 4, text in ital-
ics indicates removed features).
4.3 Training
4.3.1 The Vocal Dataset
For the creation of the vocal corpus we examined the
public vocal databases available for the Italian lan-
guage (EUROM0, EUROM1 and AIDA), public au-
diobooks, and different resources provided by profes-
sional actors. After a detailed evaluation of avail-
able resources, we realized that they were not suit-
able for our study, due to the scarcity of sequences
where emotion an communication style were unam-
biguously expressed.
We therefore opted for the development of our
own datasets, composed of:
• A series of sentences, with different emotional in-
tentions
• A series of monologues, with different communi-
cation styles
We carefully selected –taking into account the
work presented in (Canepari, 1985)– 10 sentences
for each emotion, expressing strong and clear emo-
tional states. This way, it was easier for the actor to
communicate the desired emotional state, because the
meaning of the sentence already contained the emo-
tional intention. With the same approach we selected
3 monologues (about ten to fifteen rows long, each)—
they were chosen to help the actor in identifying him-
self with the desired communication style.
For example, to represent the passive style we
chose some monologues by Woody Allen; to repre-
sent the aggressive style, we chose “The night be-
fore the trial” by Anton Chekhov; and to represent
assertive style, we used the book “Redesigning the
company” by Richard Normann.
We selected six male actors; each one was
recorded independently and individually, in order to
avoid mutual conditioning. In addition, each actor re-
ceived the texts in advance, in order to review them
and practice before the registration.
4.3.2 The Learning Process
The first step of the learning process was to select the
parameters needed by the voice-processing routines.
Using the whole vocal dataset we trained several clas-
sifiers, varying the parameters, and selected the best
combination according to the performance indexes we
Table 5: Confusion matrix for emotions (%).
Predicted emotions
Joy Neutral Fear Anger Sadness
Joy 63.81 0.00 18.35 11.79 6.05
Neutral 3.47 77.51 2.14 1.79 15.09
Fear 33.75 0.00 58.35 6.65 1.25
Anger 10.24 1.16 8.16 77.28 3.16
Sadness 5.14 14.44 0.28 0.81 79.33
defined (see Section 5). We did it for both the emo-
tion recognition classifier and the communication-
style recognition classifier, obtaining two parameter
sets.
Once the parameter sets were defined, a subset
of the vocal dataset –the training dataset– was used
to train the two classifiers. In particular, for the
emotional dataset –containing 900 voiced segments–
and the communication-style dataset –containing 54
paragraphs– we defined a training dataset containing
90% of the initial dataset, and an evaluation dataset
containing the remaining 10%.
Then, we trained the two classifiers on the training
dataset. Such process was repeated 10 times, with
different training set/test set subdivisions.
5 EVALUATION
AND DISCUSSION
During the evaluation phase, the 10 pairs of LDA-
based classifiers we trained (10 for emotions and 10
for communication styles) tagged each voiced seg-
ment in the evaluation dataset with an emotion and
an communication style. Then performance metrics
were calculated for each classifier; finally, average
performance metrics were calculated (see Section 6
for details on Praat, the voice-processing tool we
adopted).
5.1 Emotions
The validation dataset consists of 18 voiced segments
chosen at random for each of the five emotions, for a
total of 90 voiced segments (10% of the whole emo-
tion dataset).
The average performance indexes of the 10 trained
classifiers, are shown in Table 5 and Table 6
Precision and F-measure are good for Neutral,
Anger, and Sadness, while Fear and Joy are more
problematic (especially Joy, which has the worst
value). The issue is confirmed by the confusion ma-
trix of Table 5, which shows that Joy phrases were
ExtractingEmotionsandCommunicationStylesfromVocalSignals
191

Table 6: Precision, Recall, and F-measure for emotions (%).
Joy Neutral Fear Anger Sadness
Pr 56.03 75.00 64.84 80.36 80.28
Re 63.53 76.36 58.42 77.10 79.39
F
1
59.54 75.68 61.46 78.70 79.83
Table 7: Error rates for emotions.
Joy Neutral Fear Anger Sadness
F
p
164 56 96 65 70
F
n
120 52 126 79 74
T
e
(%) 18.25 6.94 14.27 9.25 9.25
Table 8: Average Pr, Re, F
1
, and Ac, for emotions (%).
Avg Pr 71.44
Avg Re 71.06
Avg F
1
71.16
Ac 71.27
tagged as Fear 33% of the time, lowering the Preci-
sion of both. Recall is good for all the emotions and
also for Joy, which exhibits the better value. The av-
erage values for Precision, Recall, and F-measure are
about 71%; Accuracy exhibits a similar value.
The K value, the agreement between the classifier
and the dataset, is K=0.63541, meaning a good agree-
ment was found.
Finally, for each class, we calculated false posi-
tives F
p
(number of voiced segments belonging to an-
other class, incorrectly tagged in the class), false neg-
atives F
n
(number of voiced segments belonging to
this class, incorrectly classified in another class), and
thus the error rate T
e
(see Table 7).
Joy and Fear exhibit the highest errors, as the clas-
sifier often confused them. We argue this result is due
to the highs degree of arousal that characterize both
Joy and Fear.
5.2 Communication Styles
The validation data set consists of 2 randomly cho-
sen paragraphs, for each of the three communication
styles, for a total of 6 paragraphs, which corresponds
to 10% of the communication-style dataset.
The average performance indexes of the 10 trained
models, are shown in Table 9 and Table 10.
Precision, Recall, and F-measure indicate very
good performances for Aggressive and Passive com-
munication styles; acceptable but much smaller val-
ues are obtained for Assertive sentences, as they are
often tagged as Aggressive (24.26% of the time, as
shown in the confusion matrix). The average values
for Precision, Recall, and F-measure are about 86%;
Accuracy exhibits a similar value.
Table 9: Confusion matrix for communication styles (%).
Predicted communication styles
Aggressive Assertive Passive
Aggressive 99.30 0.70 0.00
Assertive 24.26 62.68 13.06
Passive 7.08 10.30 82.62
Table 10: Precision, Recall, and F-measure for communica-
tion styles (%).
Aggressive Assertive Passive
Pr 85.55 68.32 93.61
Re 99.33 60.53 83.25
F
1
91.93 64.19 88.13
Table 11: Error rate for communication style.
Aggressive Assertive Passive
F
p
100 64 36
F
n
4 90 106
T
e
(%) 7.14 10.57 9.75
Table 12: Average Pr, Re, F
1
, and Ac, for communication-
style (%).
Avg Pr 86.10
Avg Re 85.87
Avg F
1
85.61
Ac 86.00
The K value, the agreement between the classifier
and the dataset, is K=0.777214, meaning that a good
agreement was found.
Finally, Table 11 shows error rates for each class.
As expected, Assertive exhibits the highest er-
ror (10.57%), while the best result is achieved by
the recognition of Aggressive, with an error rate of
7.14%. Analyzing the F
p
and F
n
values we noted that
only Aggressive had F
n
> F
p
, which means that the
classifier tended to mistakenly associate such a class
to segments where it was not appropriate.
6 THE PROTOTYPE
The application architecture is composed of five mod-
ules (see Figure 2): GUI, Feature Extraction, Emotion
Recognition, Communication-style Recognition, and
Praat.
Praat (Boersma, 2001) is a well-known open-
source tool for speech analysis
3
; it provides several
functionalities for the analysis of vocal signals as well
as a statistical module (containing the LDA-based
classifier we described in Section 4). The script-
3
http://www.fon.hum.uva.nl/praat/
PhyCS2014-InternationalConferenceonPhysiologicalComputingSystems
192
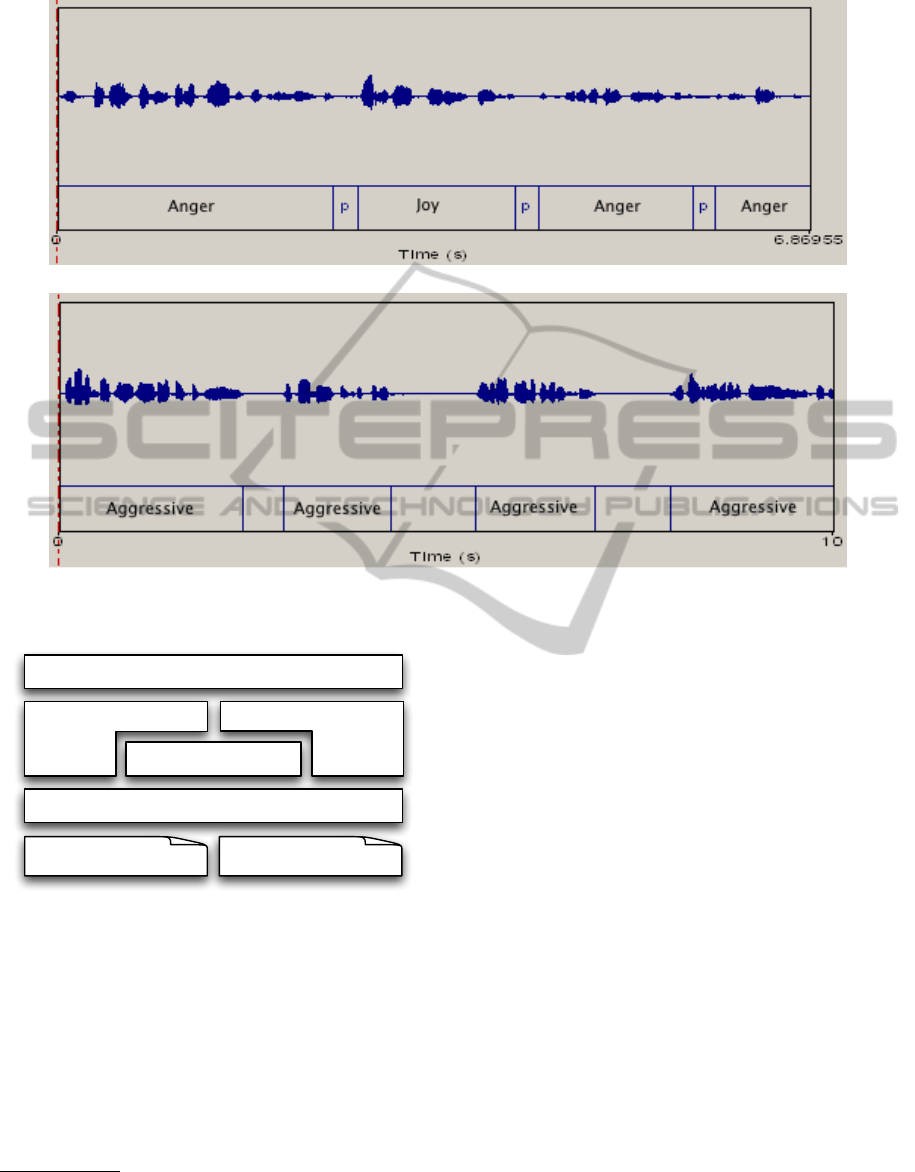
(a) Recognition of emotions
(b) Recognition of communication styles
Figure 3: Recognition of emotions and communication styles.
GUI
Emotion Recognition Communication-style
Recognition
Feature Extraction
Praat
LDA classifier
for emotion recognition
LDA classifier
for speech-style recon.
Figure 2: The PrEmA architecture overview.
ing functionalities provided by Praat permitted us to
quickly implement our prototype.
The GUI module permits to choose the audio file
to analyze, and shows the results to the user; the Fea-
ture Extraction module performs the calculations pre-
sented in Section 4 (preprocessing, segmentation, and
feature calculation); the Emotion Recognition and
Communication-style Recognition modules rely on
the two best-performing
4
models to classify the in-
4
From the 10 LDA-based classifiers generated for the
emotion classification task, the one with better performance
indexes was chosen as a final model; the same approach was
followed for the communication-style classifier.
put file according to its emotional state and commu-
nication style. All the calculations are implemented
by means of scripts that leverage functionalities pro-
vided by Praat.
Figure 3 shows two screenshots of the PrEmA ap-
plication (translated in English) recognizing, respec-
tively, emotions and communication styles. In par-
ticular, in Figure 3(a) the application analyzed a sen-
tence of 6.87s expressing anger, divided in four seg-
ments (i.e., three silences where found); each segment
was assigned with an emotion: Anger, Joy (mistak-
enly), Anger, Anger. Figure 3(b) shows the first 10s
fragment of a 123.9s aggressive speech; the appli-
cation found 40 segments and assigned them with a
communication style (in the example, the segments
where all classified as Aggressive).
7 CONCLUSIONS AND FUTURE
WORK
We presented PrEmA, a tool able to recognize emo-
tions and communication styles from vocal signals,
providing clues about the state of the conversation. In
particular, we consider communication-style recogni-
tion as our main contribution since it could provide
ExtractingEmotionsandCommunicationStylesfromVocalSignals
193

a potentially powerful mean for understanding user’s
needs, problems and desires.
The tool, written using the Praat scripting lan-
guage, relies on two sets of prosodic features and
two LDA-based classifiers. The experiments, per-
formed on a custom corpus of tagged audio record-
ings, showed encouraging results: for classification
of emotions, we obtained a value of about 71% for
average Pr, average Re, average F
1
, and Ac, with a
K=0.64; for classification of communication styles,
we obtained a value of about 86% for average Pr, av-
erage Re, average F
1
, and Ac, with a K=0.78.
As a future work, we plan to test other classifica-
tion approaches, such as HMM and CRF, experiment-
ing them with a bigger corpus. Moreover, we plan to
investigate text-based features provided by NLP tools,
like POS taggers and parsers. Finally, the analysis
will be enhanced according to the “musical behavior”
methodology (Sbattella, 2006; Sbattella, 2013).
REFERENCES
Anolli, L. (2002). Le emozioni. Ed. Unicopoli.
Anolli, L. and Ciceri, R. (1997). The voice of emotions.
Milano, Angeli.
Asawa, K., Verma, V., and Agrawal, A. (2012). Recognition
of vocal emotions from acoustic profile. In Proceed-
ings of the International Conference on Advances in
Computing, Communications and Informatics.
Avesani, C., Cosi, P., Fauri, E., Gretter, R., Mana, N., Roc-
chi, S., Rossi, F., and Tesser, F. (2003). Definizione ed
annotazione prosodica di un database di parlato-letto
usando il formalismo ToBI. In Proc. of Il Parlato Ital-
iano, Napoli, Italy.
Balconi, M. and Carrera, A. (2005). Il lessico emotivo nel
decoding delle espressioni facciali. ESE - Psychofenia
- Salento University Publishing.
Banse, R. and Sherer, K. R. (1996). Acoustic profiles in
vocal emotion expression. Journal of Personality and
Social Psychology.
Boersma, P. (1993). Accurate Short-Term Analysis of the
Fundamental Frequency and the Harmonics-to-Noise
Ratio of a Sampled Sound. Institute of Phonetic Sci-
ences, University of Amsterdam, Proceedings, 17:97–
110.
Boersma, P. (2001). Praat, a system for doing phonetics by
computer. Glot International, 5(9/10):341–345.
Boersma, P. and Weenink, D. (2013). Manual of praat: do-
ing phonetics by computer [computer program].
Bonvino, E. (2000). Le strutture del linguaggio: unintro-
duzione alla fonologia. Milano: La Nuova Italia.
Borchert, M. and Diisterhoft, A. (2005). Emotions in
speech - experiments with prosody and quality fea-
tures in speech for use in categorical and dimensional
emotion recognition environments. Natural Language
Processing and Knowledge Engineering, IEEE.
Caldognetto, E. M. and Poggi, I. (2004). Il parlato emotivo.
aspetti cognitivi, linguistici e fonetici. In Il parlato
italiano. Atti del Convegno Nazionale, Napoli 13-15
febbraio 2003.
Canepari, L. (1985). LIntonazione Linguistica e paralin-
guistica. Liguori Editore.
Cowie, R., Douglas-Cowie, E., Tsapatsoulis, N., Votsis, G.,
Kollias, S., and Fellenz, W. (2001). Emotion recogni-
tion in human-computer interaction. Signal Process-
ing Magazine, IEEE.
D’Anna, L. and Petrillo, M. (2001). Apa: un prototipo di
sistema automatico per lanalisi prosodica. In Atti delle
11e giornate di studio del Gruppo di Fonetica Speri-
mentale.
Delmonte, R. (2000). Speech communication. In Speech
Communication.
Ekman, D., Ekman, P., and Davidson, R. (1994). The Na-
ture of Emotion: Fundamental Questions. New York
Oxford, Oxford University Press.
Gobl, C. and Chasaide, A. N. (2000). Testing affective cor-
relates of voice quality through analysis and resynthe-
sis. In ISCA Workshop on Emotion and Speech.
Hammarberg, B., Fritzell, B., Gauffin, J., Sundberg, J., and
Wedin, L. (1980). Perceptual and acoustic correlates
of voice qualities. Acta Oto-laryngologica, 90(1–
6):441–451.
Hastie, H. W., Poesio, M., and Isard, S. (2001). Automat-
ically predicting dialog structure using prosodic fea-
tures. In Speech Communication.
Hirshberg, J. and Avesani, C. (2000). Prosodic disambigua-
tion in English and Italian, in Botinis. Ed., Intonation,
Kluwer.
Hirst, D. (2001). Automatic analysis of prosody for mul-
tilingual speech corpora. In Improvements in Speech
Synthesis.
Izard, C. E. (1971). The face of emotion. Ed. Appleton
Century Crofts.
Juslin, P. (1998). A functionalist perspective on emotional
communication in music performance. Acta Universi-
tatis Upsaliensis, 1st edition.
Juslin, P. N. (1997). Emotional communication in music
performance: A functionalist perspective and some
data. In Music Perception.
Koolagudi, S. G., Kumar, N., and Rao, K. S. (2011). Speech
emotion recognition using segmental level prosodic
analysis. Devices and Communications (ICDeCom),
IEEE.
Lee, C. M. and Narayanan, S. (2005). Toward detecting
emotions in spoken dialogs. Transaction on Speech
and Audio Processing, IEEE.
Leung, C., Lee, T., Ma, B., and Li, H. (2010). Prosodic
attribute model for spoken language identification. In
Acoustics, speech and signal processing. IEEE inter-
national conference (ICASSP 2010).
L
´
opez-de Ipi
˜
na, K., Alonso, J.-B., Travieso, C. M., Sol
´
e-
Casals, J., Egiraun, H., Faundez-Zanuy, M., Ezeiza,
A., Barroso, N., Ecay-Torres, M., Martinez-Lage, P.,
and Lizardui, U. M. d. (2013). On the selection of
PhyCS2014-InternationalConferenceonPhysiologicalComputingSystems
194

non-invasive methods based on speech analysis ori-
ented to automatic alzheimer disease diagnosis. Sen-
sors, 13(5):6730–6745.
Mandler, G. (1984). Mind and Body: Psychology of Emo-
tion and Stress. New York: Norton.
McGilloway, S., Cowie, R., Cowie, E. D., Gielen, S., Wes-
terdijk, M., and Stroeve, S. (2000). Approaching au-
tomatic recognition of emotion from voice: a rough
benchmark. In ISCA Workshop on Speech and Emo-
tion.
McLachlan, G. J. (2004). Discriminant Analysis and Statis-
tical Pattern Recognition. Wiley.
Mehrabian, A. (1972). Nonverbal communication. Aldine-
Atherton.
Michel, F. (2008). Assert Yourself. Centre for Clinical In-
terventions, Perth, Western Australia.
Moridis, C. N. and Economides, A. A. (2012). Affective
learning: Empathetic agents with emotional facial and
tone of voice expressions. IEEE Transactions on Af-
fective Computing, 99(PrePrints).
Murray, E. and Arnott, J. L. (1995). Towards a simulation of
emotion in synthetic speech: a review of the literature
on human vocal emotion. Journal of the Acoustical
Society of America.
Pinker, S. and Prince, A. (1994). Regular and irregular mor-
phology and the psychological status of rules of gram-
mar. In The reality of linguistic rules.
Planet, S. and Iriondo, I. (2012). Comparison between
decision-level and feature-level fusion of acoustic and
linguistic features for spontaneous emotion recog-
nition. In Information Systems and Technologies
(CISTI).
Pleva, M., Ondas, S., Juhar, J., Cizmar, A., Papaj, J., and
Dobos, L. (2011). Speech and mobile technologies for
cognitive communication and information systems. In
Cognitive Infocommunications (CogInfoCom), 2011
2nd International Conference on, pages 1 –5.
Purandare, A. and Litman, D. (2006). Humor: Prosody
analysis and automatic recognition for F * R * I * E
* N * D * S *. In Proc. of the Conference on Empir-
ical Methods in Natural Language Processing, Syd-
ney, Australia.
Russell, J. A. and Snodgrass, J. (1987). Emotion and the en-
vironment. Handbook of Environmental Psychology.
Sbattella, L. (2006). La Mente Orchestra. Elaborazione
della risonanza e autismo. Vita e pensiero.
Sbattella, L. (2013). Ti penso, dunque suono. Costrutti cog-
nitivi e relazionali del comportamento musicale: un
modello di ricerca-azione. Vita e pensiero.
Scherer, K. (2005). What are emotions? and how can they
be measured? Social Science Information.
Shi, Y. and Song, W. (2010). Speech emotion recognition
based on data mining technology. In Sixth Interna-
tional Conference on Natural Computation.
Shriberg, E. and Stolcke, A. (2001). Prosody modeling for
automatic speech recognition and understanding. In
Proc. of ISCA Workshop on Prosody in Speech Recog-
nition and Understanding.
Shriberg, E., Stolcke, A., Hakkani-Tr, D., and Tr, G. (2000).
Prosody-based automatic segmentation of speech into
sentences and topics. Ed. Speech Communication.
Stern, D. (1985). Il mondo interpersonale del bambino.
Bollati Boringhieri, 1st edition.
Tesser, F., Cosi, P., Orioli, C., and Tisato, G. (2004). Mod-
elli prosodici emotivi per la sintesi dell’italiano. ITC-
IRST, ISTC-CNR.
Tomkins, S. (1982). Affect theory. Approaches to emotion,
Ed. Lawrence Erlbaum Associates.
Wang, C. and Li, Y. (2012). A study on the search of
the most discriminative speech features in the speaker
dependent speech emotion recognition. In Parallel
Architectures, algortihms and programming. Interna-
tional symposium (PAAP 2012).
ExtractingEmotionsandCommunicationStylesfromVocalSignals
195
