
The Intelligent Container
A Cognitive Sensor Net for Fruit Logistics
Walter Lang, Steffen Janßen and Reiner Jedermann
Institute for microsensors, -actuators and –systems (IMSAS) and Microsystems Center Bremen (MCB),
University of Bremen, Bremen, Germany
Keywords: Fruit Logistics, Sensor Net, Remaining Shelf Life, Dynamic FEFO, Ethylene Detection.
Abstract: The Intelligent Container is a wireless sensor network for the control of perishable goods such as
vegetables, fruits or meat. Several data interpretation tools are implemented in the sensor nodes. These can
estimate temperature related quality losses, supervise sensor deployment and measurement intervals, and
detect malfunctioning sensors. In order to retrieve information about the ripening directly from the
transported fruits, the ripening indicator ethylene is detected using a newly developed highly sensitive and
selective gas measurement system. The intelligent container allows the realisation of the new logistic
paradigm of dynamic FEFO (First Expire First Out): the remaining life time—estimated shelf life—of the
transported fruits is used to control the logistic process. This paper describes the developments performed
on the Intelligent Container by the University of Bremen and its partners.
1 INTRODUCTION
In fruit logistics up to 35% of the cargo is lost during
transport (Scheer, 2006). Only 5% loss is attributed
directly to transport processes, but a large amount is
lost indirectly due to insufficient conditions on the
way, especially due to insufficient cooling and
temperature control. It is known that within a reefer
there may be temperature differences of several
degrees from bottom to top, but today in most
systems temperature is measured by only 2
temperature sensors. This way, large temperature
gradients may easily be overlooked. A better control
of the transport conditions due using Wireless
Sensor Networks will allow a considerable
improvement of transport quality.
Generally, fruits do not have sell-by date
imprinted on the package, but the quality is
estimated by the customer when he or she buys it.
Often, fruits cannot be sold any more and have to be
disposed of, it also may happen that a reseller rejects
accepting a load after opening it. To control the
transport process continuously would have a number
of important advantages:
- When in time data about the specific load of a
container are available, logistic processes may be
re-adjusted accordingly and losses can be
minimised. E.g. when it is known that a specific
container with banana from Central America has a
“hot spot”, this container can be processed first to
save as many fruit as possible (FEFO).
- Often containers are directly forwarded from the
ship to the reseller without opening them. When
the reseller refuses to accept, this is high cost for
the wholesale dealer in terms of money and
reputation. This situation may be prevented if
sensor information is available. The rotting fruit
are stopped and replacement can be launched
instantly.
- In case the cargo of a container is known to be lost,
there is no use in transporting it further on and in
paying customs duty.
- When the state of the fruit at unpacking indicates a
quality problem on the farm, there will be already
two ships on sea with the same quality problem. If
we had a sensor warning us two weeks earlier
while the fruit are still travelling over the Atlantic
ocean, we could inform the farm immediately and
take action there.
- In some cases of fruit logistics counteraction
during transport is possible, such as lowering the
temperature set point of a reefer.
- For chilled and frozen food a proof of an
uninterrupted cold chain is demanded by the
authorities and by the customers.
Considering the market volume of fruit worldwide,
351
Lang W., Janßen S. and Jedermann R..
The Intelligent Container - A Cognitive Sensor Net for Fruit Logistics.
DOI: 10.5220/0004705703510359
In Proceedings of the 3rd International Conference on Sensor Networks (SENSORNETS-2014), pages 351-359
ISBN: 978-989-758-001-7
Copyright
c
2014 SCITEPRESS (Science and Technology Publications, Lda.)

reducing the loss by only a fraction of a percent
means a considerable win in terms of money, and,
furthermore, in terms of carbon dioxide footprint.
In logistic planning the paradigm applied is
FIFO: First in – first out. Fruit which come first are
moved on first. With the availability of sensor data,
this paradigm might change to the new paradigm of
dynamic FEFO: first expire – first out. The task is to
estimate time before decay, the “remaining shelf
life”. Then, the fruit with short remaining shelf life
are moved on first and to near bydestinations. The
fruit with longer shelf life are moved secondly and
attributed to longer distances. The fruit with expiring
shelf life finally are stopped this way avoiding
unnecessary transport. The shelf life estimation can
be done by a decision support tool implemented in
the sensor net. The term dynamic reflects the fact,
that the remaining shelf life is continuously re-
estimated according to the development of the fruit
within time.
The advantage of FEFO compared to FIFO was
verified in several studies. Koutsoumani
(Koutsumani, 2005) calculated the probability
density functions for the duration of local and
international transports and temperature in retail
shelves or customer refrigerators based on field
studies. A simulation combined the resulting
temperature curves with a biological model. The
study showed that the share of products arriving at a
critical bacteria load could be reduced from 16% to
8.2% by the FEFO approach. A similar study by the
same group for seabream resulted in a reduction of
losses from 15% to 5% (Tsironi, 2008). A study on
strawberries by the University of Florida
[Jedermann, 2008] showed that losses can be
reduced from 36.9% to 22.8%. In summary, a
delivery planning based on remaining shelf life can
avoid between 8% and 14% of losses compared to
planning without use or availability of quality
information (Fig. 1).
Figure 1: Case studies for product losses due the quality
defects for FIFO (no quality information) and FEFO
(based on remaining shelf life) planning.
To bring these features into reality, the “Intelligent
Container Project” has been initiated (MCB, 2013).
The research started in 2004 as a research project of
Bremen University founded by “Deutsche
Forschungsgemeinschaft”.
In 2008 a transfer project was initiated in
cooperation with two logistic partners: Dole Fresh
Fruit Europe doing fruit transport on sea and Rungis
express doing road transport. As an industrial
technical partner, the trailer company Cargobull
Telematics was a member of the consortium. First
field tests on sea and land were performed. This
research work was followed by a broad cooperation
of industry and university, the “Innovation Alliance
for the Intelligent Container”, founded by the
Federal Ministry of Education and Research of
Germany. The Alliance for Innovation has been
running from 2010 to 2013. In this paper we will
discuss the most important results and findings of
these projects.
2 THE SENSOR NETWORK
2.1 Layout of the Measurement Task
What tasks must this sensor net perform? When
looking closer, the list of tasks to do becomes long
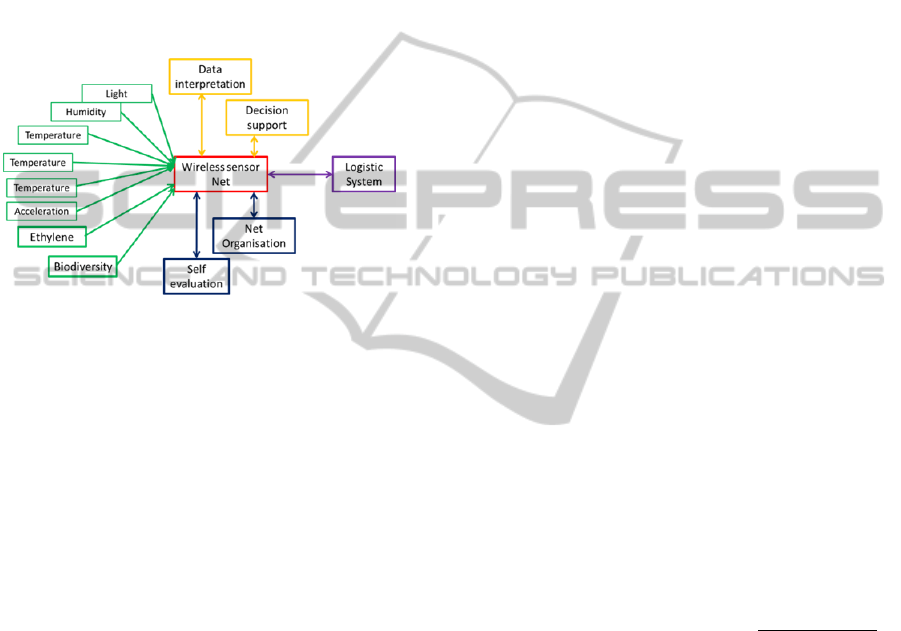
and challenging. Fig. 2 shows the information flow
within the system.
2.1.1 Quantities to Be Measured
Concerning quantitites to be measured, the first task
is temperature. Today, 2 or 3 temperature sensors
are usually used in a reefer. We deployed a number
of 40 for test and we found that the temperature
variation in reality is much larger than expected.
On the other hand, 40 sensor nodes per container
are not a realistic scenario for practical application
in every container. This way, the path has to be from
2 to 40 and then back to 12 again. Then, with the
improved knowledge how to locate the sensors,
interpolation can be done to calculate the whole
temperature profile. This way, the systems also need
data interpretation tools such as numerical models to
estimate the development of a 3D-model of the
temperature distribution from a few measurement
points.
Temperature is by far the most important
variable to be measured. In transports of ‘dry’
agricultural products humidity is important, since
relative humidity must be kept below 75% to
prevent the growth of mould fungus (Scharnow,
2005). Mould is a major danger when transporting
berries and grain. Grain is highly hygroscopic, this
0%
10%
20%
30%
40%
Mea t
(Athen, 2005)
Fis h
(Athen, 2008)
Straw berries
(Florida, 2006)
No quality information
Remaining shelf life
SENSORNETS2014-InternationalConferenceonSensorNetworks
352
way a container with grain will contain tons of
water. Now imagine a container placed on the top of
a vessel in a cold night in northern Atlantic. The
average temperature in the container is 15°C, the
average relative humidity is 60%, “on the safe side”.
Practically, at side exposed to the wind, the
temperature is only 5°C, relative humidity rises to
100% and condensate will drop down on the grain,
causing locally major mould fungus danger. This
situation will be overlooked if only one humidity
sensor is applied and no advanced data analysis is
performed.
Figure 2: Information flow within the Intelligent
Container.
In fruit logistics, the primary focus is temperature.
Other important sensor functions which are needed
for some transports are acceleration for shock
detection and light. Though they are important, they
cannot be covered in extenso in this paper.
2.1.2 Decision Support Tools
To estimate the remaining shelf life from the data,
decision support algorithms have to be developed
and implemented. Knowing the temperature history,
these tools may estimate the change of the fruit with
time. It soon turned out, that analysing a
development is useful only if we know the starting
point. What is the status of the fruit when loaded?
Unfortunately, the biodiversity at loading is high. A
major parameter is the weather before harvest. If
there is rain before picking, the fruit will take up
more water. A second important influencing factor is
the transport from the farm to the port. Due to
shaking on bad roads and fot the lack of cooling
within a few hours in a truck fruit may lose days of
shelf life. The status at packing is normally
estimated visually by experienced operators during
packing. In the case of bananas, colour patterns with
different appearances—more green than yellow—
are used in the port. Within the project of the
Intelligent Container the company ELBAU
(http://www.elbau-gmbh.de/) has developed an
optical system to automate this analysis.
So far, during transport we only look at external
data, such as temperature. Can we get information
about ripening from the fruits themselves? Actually
the process of ripening of fruits is correlated with the
emission of ethylene gas. This way, measuring the
indicator ethylene gas, a direct observation of the
ripening and decay is possible. These developments
are described separatly in section 3.
2.1.3 Management of Sensor Nodes
The sensor net does not only look at the container
and the fruit, it also observes itself for management
of the sensor nodes and for failure detection.
The system can supervise and change its own
deployment. How many sensors do we need? What
distance between the sensors can we allow? These
questions can be analysed looking at the correlation
of the data of different sensors using a method
developed for geostatistics by D.G. Krige (Krige,
1951) and now transferred to sensor nets
(Jedermann, 2009). During transport sensors cannot
not be removed, but they can be put to sleep this
way augmenting the life time of the batteries. The
sensor nodes measure their remaining energy; the
routing may be changed in the way to allow nodes
with weak batteries to sleep (Behrens, 2007). Also
the dynamic behaviour of the temperature is
analysed to adapt the duty cycle to the situation.
Slow development can be answered with a reduction
of the measurement cycle to save energy (Wang,
2010; Wang, 2011).
2.1.4 Self Evaluation
A last and complicated task is the self-evaluation.
Imagine a sensor node shows anomalous humidity
values at some point: is the sensor node defect or is
there an anomaly, such as a broken can? To analyse
divergent behaviour a neural network has been
developed (Jabbari, 2009).
Fig. 2 gives an overview of the capabilities of the
sensor net. Within the Intelligent Container Project,
we decided to implement the important parameters
within the sensor nodes. An alternative approach
would be to communicate the data and to calculate
models on a higher level, E.g. in a master node. Our
experience is that this approach will not give us the
robustness we need. In an extremely challenging
surrounding such as see transport, failure of a node
is always possible. The system must be able to
rearrange if a node fails, and the maximum
robustness will be achieved if we implement the
TheIntelligentContainer-ACognitiveSensorNetforFruitLogistics
353

important algorithms locally, even if this means that
we have to apply several parallel nodes which are
able to calculate the models.
In the following paragraphs, some of these
aspects will be discussed in detail.
2.2 The Sensor Net
The communication system of the intelligent
container consists of the internal wireless sensor
network, the external network for remote access to
the container, and a gateway to bridge between these
two networks. Whereas the external network can be
implemented by standard components and
commercially available networks, such as the
Iridium satellite system or cellular mobile networks,
the internal networks requires specifically adapted
solutions, and thus be discussed in detail.
Most wireless sensor node devices operate in the
2.4 GHz range according to the 802.15.4 standard.
Our prototype sensors are based on the TelosB from
Crossbow (2005). They were mounted into a IP67
water tight housing with an SHT75 external
temperature and humidity sensor.
In contrast to other sensor network applications
in buildings or farming setups (Ingelrest 2010) with
a typical communication range between 10 and 100
meters, the range dropped to 0.5 meters, if the
sensors were packed into banana pallets (Jedermann,
2011). The network protocol must be able to find
routes in a sparsely connected network (Becker,
2009). In contrast to other applications, the data
volume is very low. Only 6 bytes are required in
addition to addressing and protocol overhead to
transmit temperature, humidity and battery voltage
measurements.
The energy consumption of the sensor nodes
mainly depends on the radio, which draws
approximately 20 mA in both receive and transmit
modes. The MSP430 micro controller requires only
1 mA in full operation and 1µA in sleep mode. The
active radio time should be reduced as much as
possible.
For our field tests, we developed a
communication protocol, the “BananaHop Protocol”
(Jedermann, 2011). It requires an active radio time
of 5 seconds to transmit its own data and forward
those of other sensors per measurement frame of 150
seconds, equivalent to duty circle of 3.3%. The duty
circle can be further reduced, if the measurement
intervals are prolonged.
Only if a sensor loses the synchronization the
duty circle increased to 50% because the sensor has
to listen for an updated time stamp included in a
beacon message from another sensor. The sensors
nodes are supplied by two AA batteries with a
normal capacity of 2950 mAh. After 15 days the
voltage dropped from 3 Volt to 2.845 Volt. During
the subsequent 5 days of testing the voltage dropped
almost linear with 0.029 Volt per day. A critical
voltage of 2.4 Volt below which the humidity sensor
will become unstable, will only be reached after 3
months.
Decision algorithm for processing of the
measurement data can be either implemented on the
gateway or directly on the sensor nodes. As alternate
hardware solution we tested the Preon32 sensor
nodes from Virtenio (Virtenio, 2013), providing a
virtual machine to execute Java code. The
availability of such high programming languages
simplifies the programming of algorithms and makes
it possible to update the sensor node software for
different products loaded to the container.
2.3 Data Interpretation Tools
We want to get a 3D model for the development of
temperature with time, even if there are only a few
measurement points available. The first example is
the estimation of the temperature development of a
banana box. Depending on the way of packaging the
convective flow of cooling air at a specific box may
vary in a wide range (Ambaw 2013). The
temperature of the box at loading may vary, too.
This way, some boxes cool down within 2 days,
others need a week (Jedermann, 2011), which has a
major impact on shelf life, of course. We developed
a model to predict full cooling curve from data
generated within the first 2 days (Palafox, 2011).
Figure 3 shows the development of temperature for
two example boxes A and B. The temperature has
been measured for 3 days. From that, the
development for the next 15 days is predicted. This
prediction correlates well with the further
development of measured temperature. This allows
us a more precise estimation of remaining shelf life
at an early stage.
Bananas are a climacteric ‘living’ product with
biological processes continuing after harvest (Turner
1997). A certain amount of heat is generated by this
respiration activity. When the bananas come close to
a state, in which ripening starts and the colour
changes from green to yellow, the heat production
increases simultaneously. If the heat production is
larger than the amount of heat removed by cooling, a
hot spot develops leading to even higher biological
activity and temperature. If a hot spot develops in
one pallet, in most cases the whole container is lost.
SENSORNETS2014-InternationalConferenceonSensorNetworks
354
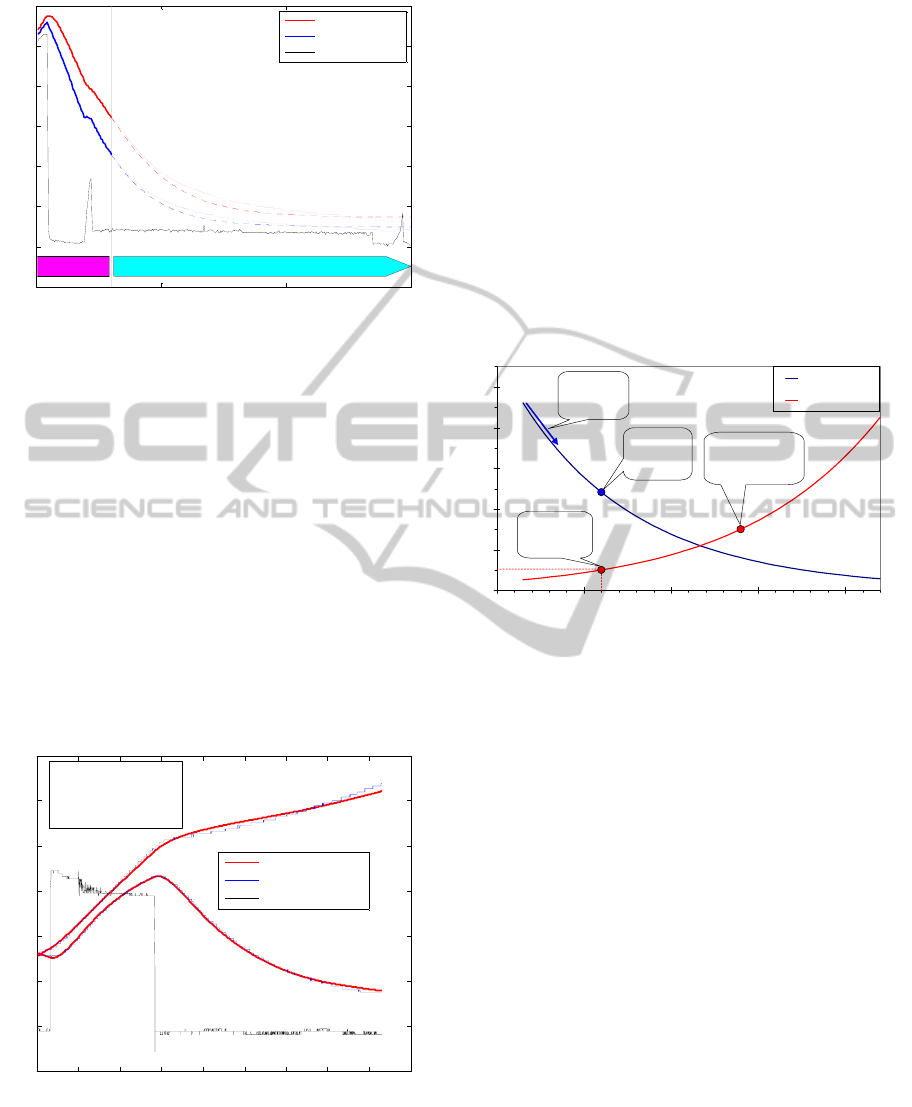
Figure 3: Measurement of the temperature development in
two boxes within the same container during sea transport.
The conditions leading to a hot spot can by analysed
by an extended version of the model (Jedermann,
2013). Figure 4 shows the measured and predicted
temperature curves for an ashore experiment
simulating a cooling problem. The set point of the
cooling system was switched from 13°C to up to
16°C for 30 hours. For one box of banana (lower
curves) the temperature rises, but then declines again
as it should. The second box (lower curve) has
insufficient cooling air circulation. Biological
activity starts, and the cooling system cannot bring
down temperature any more. A hot spot is
developing. The lower cooling effect was caused by
deliberately making a “packing mistake” by
completely blocking the air gaps between the pallets.
Figure 4: Measurement of the temperature development in
two boxes within the same container during sea transport.
The model parameter k
P
describes biological activity, k
M
describes the cooling (Jedermann, 2013).
Different pacing schemas were evaluated and
compared by this model (Jedermann, 2013). We
found that it is important to carefully maintain slots
of identical width for the flow of the cold air.
Blocking of convective flow can seriously inhibit the
cooling.
2.4 Decision Support Tools
The most important decision support tool of the
Intelligent Container is the shelf life predictor.
Figure 5 shows the shelf life curve for lettuce
(Tijskens, 1996) using an Arrhenius kinetic
approach. The set point is 6°C, so at 6°C the loss is 1
day per day. At higher temperature the loss rises,
storing the lettuce at 14°C for 1 day will result in a
loss of 3 days in shelf life.
Figure 5: Shelf life estimation: The remaining shelf life is
plotted versus temperature for the example of lettuce
(Tijskens, 1996). At the set point of 6°C the loss is 1 Day
per day. At higher temperature the loss increases and thus
the expected shelf life is reduced.
The figure gives only a very simplified idea of a
shelf life predictor. Actually, there are complicated
biological models behind it which must be
elaborated experimentally for every fruit. In order to
implement shelf life prediction in an algorithm there
are two approaches: the first one supposes reaction
kinetics of the Arrhenius type for the fruit. Reaction
kinetic parameters are experimentally elaborated for
the specific fruit. The decision support tool
continuously calculates the Arrhenius kinetics. The
second approach uses table shifting. Look up tables
for the specific fruit are calculated once and stored.
Today, shelf life predictors are implemented in
sensor nodes. Implementation in smart cards
comparable to RFID data loggers is on its way
(Jedermann, 2008), (Zweig, 2008).
2.5 Field Tests
The sensor system including gateway and external
communication were installed in a prototype
intelligent container. Three test transports from
0 5 10 15
12
14
16
18
20
22
24
26
Time in [Days]
Temperatur in [°C]
PredictedMeasured
Center of Box A
Center of Box B
Supply Air
0 10 20 30 40 50 60 70 80 90
12
13
14
15
16
17
18
19
Time in Hours
Temperature in °C
Center B181 / B187
k
M
= 0.964 / 0.312
k
P
= 0.0462 / 0.0752
Model Output
Measured Output
Supply Air
0
2
4
6
8
10
0 5 10 15 20
Temperature °C
Shelf life / loss in days .
Shelf life(T)
Loss per Day
4.8 days
shelf life at
6 °C
Reference
temperature
6 °C
Tripple speed of
quality decay at
14 °C
A
ctivation
energy for
Lettuce
1
TheIntelligentContainer-ACognitiveSensorNetforFruitLogistics
355
Costa Rica to Europe were carried out in 2012 and
2013. After 2 weeks of sea transportation the
bananas were left in the container for ripening after
gassing with ethylene. The container ripening took 5
or 6 days but showed only a good result with a
similar degree of ripeness in all boxes at the end of
the process, if several measures to improve the air
flow though the boxes were applied (Jedermann,
2013),
In parallel to the sea transportation tests, a
further test was carried out for the automated
supervision of meat during a truck transport from
France to Germany (Dittmer, 2013).
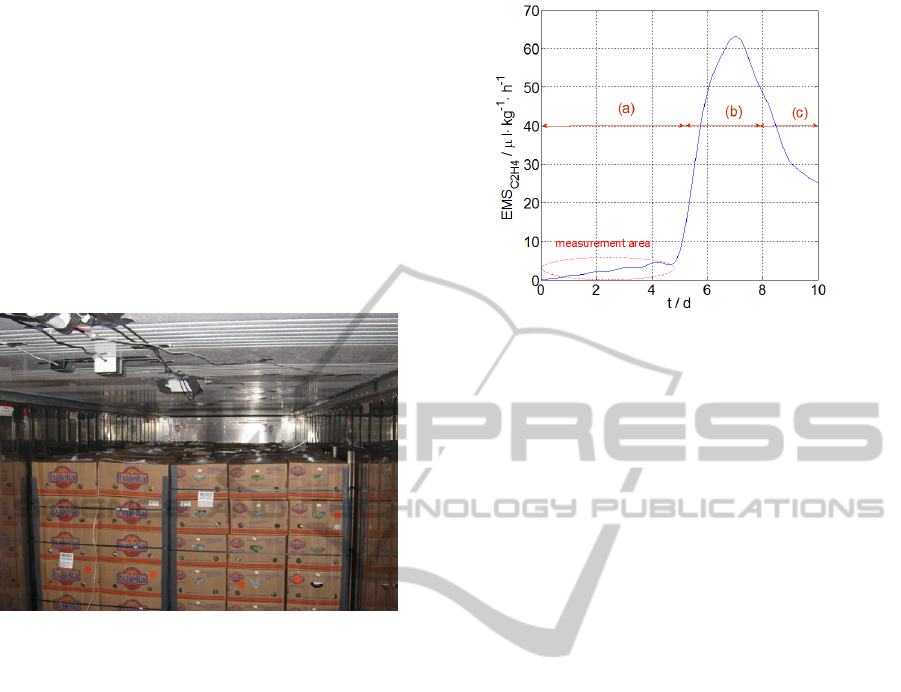
Figure 6: Pallets in test container with antennas for
wireless sensors under the roof.
3 ETHYLENE MEASUREMENT
3.1 The Role of Ethylene in Fruit
Ripening
Ethylene is a gaseous ripening hormone for most
fruits. When fruits ripen, they emit ethylene gas. On
the other hand, when a fruit is exposed to ethylene,
ripening is induced. This is why ripening is
contaminous: put a green tomato besides a red one
and it will start induced ripening. Concerning
ripening, fruits are classified as climacteric or non-
climacteric. Non-climacteric fruits such as grapes
and apricots are harvested when fully ripened, they
do not show ripening any more after being picked.
Climacteric fruits such as bananas, apples or
tomatoes have an extended pre-mature phase (green
banana) followed by a sudden rise of ethylene
emission and respiration. When the climacteric event
starts, it cannot be stopped. Bananas are transported
in the pre-climacteric state as green banana. After
unloading they are exposed to ethylene in a ripening
chamber.
Figure 7: The emission of ethylene by climacteric fruits
(banana). To monitor the small rise in the preclimacteric
phase (a) a measurement method with very high resolution
is needed. (Bials, 1954).
Figure 7 shows the ethylene production. Pre-
climacteric (a) the emission is small. The container
air will contain ethylene in the range some 100 ppbv
(parts per billion by volume). In the climacterium (b)
the emission rises strongly and the bananas turn
yellow. After the climacterium (c) the emission
reduces again and the bananas start decaying.
During transport the fruit should stay in the pre-
climacteric state (a), but sometimes, if a package is
not cooled effectively, ripening may start locally.
Ripening bananas emit ethylene and this way trigger
other bananas to start ripening, furthermore ripening
bananas generate heat and temperature is further
increased. These nonlinear effect cause a “hot spot”
of ripening. To detect this dangerous effect, the
ethylene must be measured with a resolution of 50
ppbv.
3.2 Measurement of Ethylene in Very
Low Concentration
At this low level of concentration we find many
organic gases in the container, therefore the
measurement must be sensitive and selective at the
same time. There are gas sensors for ethylene which
can measure in the ppmv range, but they do not
show high selectivity. For this reason, within the
Intelligent Container project we have developed
measurement systems for ethylene which are
sensitive and selective at the same time.
The first approach is non-dispersive infrared
spectroscopy (NDIR). Ethylene shows a specific IR-
absorption line at 10.5 µm wavelength. The NDIR
measurement provides very robust detection in the
lower ppmv range (Sklorz, 2012). For the ppbv
SENSORNETS2014-InternationalConferenceonSensorNetworks
356
range, a more powerful method has to be applied:
gas chromatography (GC).
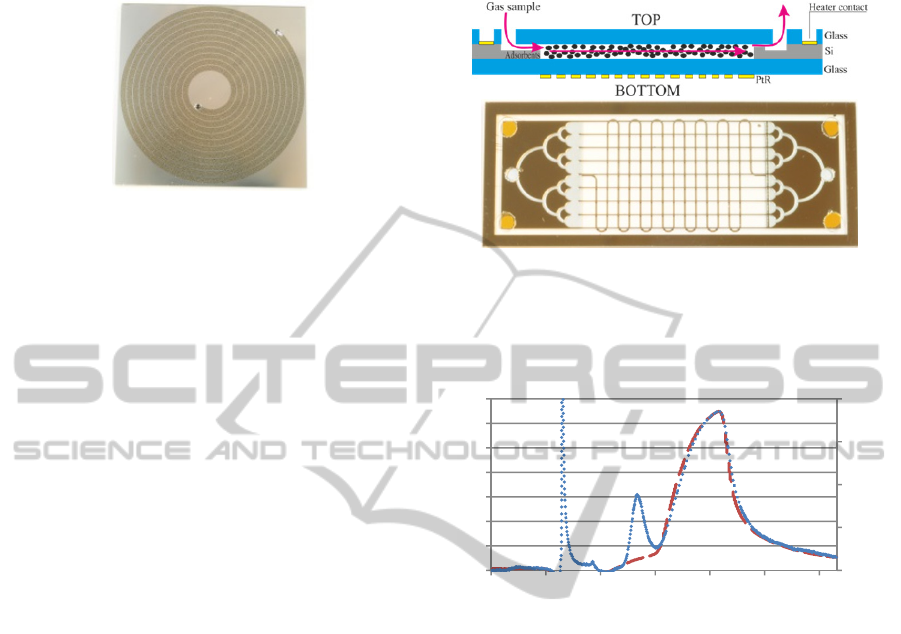
Figure 8: Using the technology of microfluidics, a small
GC-column is made for the µCG (Sklorz, 2012).
A gas chromatograph uses the fact, that the
adsorption and desorption of the gas molecules at a
surface is specific for different molecules. The gas
diffuses through a long tube, the chromatographic
column. This is filled with a material which has been
developed for specific adsorption of ethylene, the
stationary phase. By ad- and desorption the
molecules are retained, and if a mixture of molecules
enters the column at a certain time, each species will
reach the end of the column after a specific retention
time. The species are detected at the end of a column
with a commercial gas sensor. The gas sensor
provides sensitivity, the chromatographic column
provides selectivity.
Gas chromatographic systems are large and
expensive. For the use in transport systems, we
developed a small system which can work
autonomously.
The column of the µCG is made using
micromachining technology as shown in figure 8
(Sklorz, 2013). Using these devices, a resolution of
140 ppmv is achieved. To boost the resolution down
to the ppbv range, a micromachined preconcentrator
has been developed. This is a micro reactor as
shown in figure 9.
The reactor is filled with an adsorption material
which can catch and hold the ethylene. The first step
of measurement is the accumulation of ethylene in
this adsorption material.
When enough gas is assembled, then the reactor
is heated up fast and the ethylene is set free in a
short boost which enters the CG system. This way,
for the first time a resolution below 400 ppbv was
detected [Janßen, 2013]. Figure 10 shows a
chromatogram of a probe gas of 400 ppbv of
ethylene in air. The biggest problem concerning
cross sensitivity is water. In the first attempt, the
water peak was overlapping the ethylene peak. A
new stationary phase (Carbosieve SII) shows
different retention times for water and ethylene. This
way, it is possible to separate these two species as
shown in figure 10.
Figure 9: A micro reactor used as preconcentrator for
ethylene measurement. By using micro-preconentrators, a
resolution in the ppbv-range can be achieved. (Janßen,
2013).
Figure 10: Chromatogram of ethylene (blue line) in air
made by the combination of a micro-preconcentrator and a
micro-gas-chromatograph [Janßen, 2013]. The red curve
shows air with the same humidity but no ethylene content.
The ethylene is clearly detected around sample 5200 (1300
seconds). The proof gas has a concentration of 400 ppbv
ethylene. The needed resolution of 50 ppbv is provided by
this system.
4 CONCLUSIONS
In this paper we described the results of several
projects concerning the application of wireless
sensor nets in fruit logistics. As a conclusion of this
experience we would like to sum up the basic
findings about sensor networks within the following
theses:
Loss of fruit during storage and transport can be
considerably reduced using wireless sensor
networks combined with data interpretation tools
and decision support tools.
The tools must be implemented locally. This
means, that they have to be programmed on the
small platform of a sensor node and that they must
0,00
0,05
0,10
0,15
0,20
15
20
25
30
35
40
45
50
1 2001 4001 6001 8001 10001 12001
Samples
[mS]
[%]
TheIntelligentContainer-ACognitiveSensorNetforFruitLogistics
357

be implemented parallel on several nodes. Central
calculation needs too much energy for the
communication of all the the single data and it
makes the net too vulnerable.
Practically, robustness of the system is the main
issue. Sensor nodes can fail, they also can just
vanish by being forgotten or stolen. For this
reason, parallel and redundant structures are
needed.
The housing of the sensor nodes must stand humid
surrounding and also mechanic stress such as
mechanic impact by pressure and shock.
There is no off the shelf solution for sensor nodes.
Specific surrounding needs specific housings
concerning humidity, temperature and mechanic
stress. Specific deployments also need specific
communication strategies to be able to
communicate in difficult situations such as close
iron walls and loading with water content.
Medium term, sensor nodes have to be powered by
batteries. Energy harvesting only works if area and
light are always available and solar cells can be
applied. The energy need of sensors and
electronics is declining fast, but the amount of
energy which can be scavenged is still too small
for most sensor net deployments.
How will the project go on? The next steps will
be twofold: Some of the industrial partners of the
Alliance for Innovation are now performing
application development together with Bremen
University in order to launch a sensor net for fruit
transport as a product. Second, there is more need on
specific sensor technology. At the moment, IMSAS
is starting a project to detect the growth of mould
fungus in containers during transport.
ACKNOWLEDGEMENTS
The research project “The Intelligent Container” is
supported by the Federal Ministry of Education and
Research, Germany, under reference number
01IA10001. Further information about the project
can be found at http://www.intelligentcontainer.com.
We additionally thank Dole Fresh Fruit Europe for
provision of test facilities.
REFERENCES
Ambaw, A.,Delele, M. A., Defraeye, T., Ho, Q. T., Opara,
L. U., Nicolai, B. M., Verboven, P. 2013. The use of
CFD to characterize and design post-harvest storage
facilities: Past, present and future. Computers and
Electronics in Agriculture. 93, 184-194.
Ali, Syed; Ashraf-Khorassani, Mehdi; Taylor, Larry T.;
Agah, Masoud: MEMS-Based Semi-Packed Gas
Chromatography Columns. In: Sensors and Actuators
B: Chemical Vol. 141 (2009), Nr. 1, S. 309-315.
Agah, M.; Lambertus, G. R.; Sacks, R.; Wise, K.: High-
Speed MEMS-Based Gas Chromatography. In Journal
of Microelectrmechanical Systems Vol. 15 (2006), Nr.
5, S. 1371-1378.
Becker, M., Yuan, S., Jedermann, R., Timm-Giel, A.,
Lang, W., Görg, C.: Challenges of Applying Wireless
Sensor Networks in Logistics. CEWIT 2009.
Behrens, C., Bischoff, O., Lueders, M., Laur, R. 2007.
Energy-efficient topology control for wireless sensor
networks using online battery monitoring. In:
Kleinheubacher Tagung 2006, U.R.S.I.
Landesausschuss in der Bundesrepublik Deutschland
e.V, Kassel.
Bials, Jacob B.; Young, Roy E.; Olmstead, Alice J.: Fruit
Respiration and Ethylene Production. In: Plant
Physiol. Vol. 29 (1954), Nr. 2, S. 168-174.
Crossbow. 2005. TelosB Mote platform.availabe at
http://www.willow.co.uk/TelosB_Datasheet.pdf.
Dittmer, P., Veigt, M., Becker, M., Dannies, A., Nehmiz,
U., Hosse, M. 2013. Quality traceability from
production to retail shelf. In: 5th International
Workshop Cold Chain Management, University Bonn,
Bonn, Germany.
Fonollosa, J., Halford, B., Fonseca, L., Santander, J.,
Udina, S., Moreno, M.,& Marco, S. (2009). Ethylene
optical spectrometer for apple ripening monitoring in
controlled atmosphere store-houses. Sensors and
Actuators B: Chemical, 136(2), 546-554.
Ingelrest, F., Barrenetxea, G., Schaefer, G., Vetterli, M.,
Couach, O., Parlange, M. 2010. SensorScope:
Application-specific sensor network for environmental
monitoring. ACM Trans. Sen. Netw. 6, 1-32.
Jabbari, A., Jedermann, R., Muthuraman, R., Lang, W.
2009. Application of Neurocomputing for Data
Approximation and Classification in Wireless Sensor
Networks. Sensor Journal. 9, 3056-3077.
Janßen, S.; Lang, W., "Ethylene Measurement for Fruit
Logistic Process in a Range of 400 ppbv and below,"
in 5th International Cold Chain Management
Workshop, Bonn, Germany, 2013, p. 6.
Jedermann, R., Edmond, J. P., Lang, W. 2008. Shelf life
prediction by intelligent RFID. In: Dynamics in
Logistics. First International Conference, LDIC 2007,
(H. D. Hassis, H. J. Kreowski, B. Scholz-Reiter, eds.)
pp. 231-238, Springer, Berlin/Heidelberg.
Jedermann, R., Lang, W.: The Benefits of Embedded
Intelligence – Tasks and Applications for Ubiquitous
Computing in Logistics. The internet of things 2008,
pp.105-122.
Jedermann, R., Lang, W. 2009. The minimum number of
sensors - Interpolation of spatial temperature profiles.
In: Wireless Sensor Networks, 6th European
Conference, EWSN 2009, Lecture Notes in Computer
Science (LNCS), (U. Rödig, C.J. Sreenan, eds.) pp.
SENSORNETS2014-InternationalConferenceonSensorNetworks
358

232-246, Springer, Berlin/Heidelberg.
Jedermann, R., Becker, M., Görg, C., Lang, W. 2011.
Testing network protocols and signal attenuation in
packed food transports. International Journal of
Sensor Networks (IJSNet). 9, 170-181.
Jedermann, R., Dannies, A., Moehrke, A., Praeger, U.,
Geyer, M., Lang, W. 2013. Supervision of transport
and ripening of bananas by the Intelligent Container
In: 5th International Cold Chain Management
Workshop 2013, University Bonn, Germany, Bonn,
Germany.
Koutsoumani, K., Taoukis, P. S., Nychas, G. J. E. 2005.
Development of a safety monitoring and assurance
system for chilled food products. International
Journal of Food Microbiology. 100, 253-260.
Krige, D. G. 1951. A statistical approach to some mine
valuations and allied problems at the Witwatersrand.
University of Witwatersrand.
MCB Microsystems Center Bremen. 2013. Homepage of
the Intelligent Container project. Bremen, Germany,
availabe at www.intelligentcontainer.com.
Palafox-Albarrán, J., Jedermann, R., Lang, W. 2011.
Energy-Efficient Parameter Adaptation and Prediction
Algorithms for the Estimation of Temperature
Development Inside a Food Container. In: Lecture
Notes in Electrical Engineering - Informatics in
Control, Automation and Robotics, (A.J. Cetto, J.-L.
Ferrier, J. Filipe, eds.) pp. 77-90, Springer, Berlin.
Scharnow, R. 2005. Die Ware im Container. In:
Containerhandbuch, (Y. Wild, R. Scharnow, M.
Rühmann, eds.) pp. 107-390, Gesamtverband der
Deutschen Versicherungswirtschaft e.V. (GDV),
Berlin.
Scheer, F. P. 2006. Optimising supply chains using
traceability systems. In: Improving traceability in food
processing and distribution, (I. Smith, A. Furness,
eds.) pp. 52 - 64, Woodhead Publishing Ltd.,
Cambridge, England.
Sklorz, A., Janßen, S., Lang, W.: Detection limit
improvement for NDIR ethylene gas detectors using
passive approaches. Sensors and Actuators B,175
(2012) 246-254.
Sklorz, A., Janßen, S., Lang, W.: Application of a
miniaturized packed gas chromatography column and
a SnO
2
gas detector for analysis of low molecular
weught hydrocarbons with focus on ethylene
detection. Sensors and Actuators B 180 (2013).
Tian, W. C.; Pang, S. W.; Chia-Jung, L.; Zellers, E. T.:
Microfabricated Preconcentrator-Focuser for a
Microscale Gaschromatograph. In Journal of
Microelectromechanical Systems Vol. 12 (2003), Nr.
3, S. 264-272.
Tijskens, L. M. M., Polderdijk, J. J. 1996. A generic
model for keeping quality of vegetable produce during
storage and distribution. Agricultural Systems. 51,
431-452.
Tsironi, T. E., Gogou, P., Taoukis, P. S. 2008. Chill chain
management and shelf life optimization of MAP
seabream fillets: a TTI based alternative to FIFO. In:
Coldchain Management . 3rd International Workshop,
(J. Kreyenschmidt, ed.) pp. 83 - 89, Bonn, Germany.
Turner, D. W. 1997. Bananas and plantains. In:
Postharvest physiology and storage of tropical and
subtropical fruits, (S. K. Mitra, ed.) pp. 47-83, CAB
International.
Virtenio. 2013. Preon32 - Wireless Module data sheet.
Berlin, Germany,availabe at http://www.virtenio.com/
en/assets/downloads/datenblaetter/DS_Preon32_v15_2
page%20%5BEN%5D.pdf.
Wang, X., Jabbari, A., Laur, R., Lang, W. 2010. Dynamic
Control of Data Measurement Intervals in a
Networked Sensing System using Neurocomputing.
In: International Conference on Networked Sensing
Systems (INSS 2010), Kassel.
Wang, X., Yuan, S., Laur R., Lang W.: Dynamic
localisation based on spatial reasoning with RSSI in
wireless sensor networks for transport logistics.
Sensors and Actuators A 171 (2011) 421-428.
Zhang, Rhong: Tejedor, M.; Anderson, M.; Paulose, M.;
Crimes, C.: Eythylene Detection Using Nanoporous
PtTiO2 Coatings Aplliedmto Magnetoelextic Thick
Films. In Sensors Vol. 2 (2002), Nr. 8, S. 331-338.
Zweig, S. E. 2008. Life Track technology for smart active-
label visual and RFID product lifetime monitoring. In:
Coldchain Management, 3rd International Workshop,
(J. Kreyenschmidt, ed.) pp. 29-36, University of Bonn,
Bonn, Germany.
TheIntelligentContainer-ACognitiveSensorNetforFruitLogistics
359
