
Visualising Java Coupling and Fault Proneness
P. Rosner
1
, M. Child
1
and S. Counsell
2
1
Department of Informatics, Faculty of Business, London South Bank University, London, U.K.
2
Department of Information Systems, Brunel University, Uxbridge, U.K.
Keywords: Object-oriented, Coupling, Metrics, Visualisation.
Abstract: In this paper, a tool is described for visualising the Coupling Between Objects (CBO) metric for Java
systems, decomposing it into coupling collaborators and using colour to denote the object-oriented
mechanisms at work for each couple. The resulting visualisation is also envisaged to be useful for general
program comprehension and is integrated into Java development in the Eclipse IDE. Evidence is also given
that the visualisation may help detect classes tending to be less fault-prone than would be expected from
inspection of their CBO values alone.
1 INTRODUCTION
The metric Coupling Between Objects or CBO
(Chidamber and Kemerer, 1994) has been shown to
correlate with quality indicators such as fault-
proneness (Olague et al., 2007). CBO for a class is
based on the number of distinct collaborators either
accessed from (fan-out) or accessing (fan-in) the
class. However, if only the raw CBO value is
available, the program code needs to be examined
manually to discover CBO collaborators, and to
verify that a high CBO value for a particular class is
indeed harmful. CouplingViz, a visualisation tool for
Java systems addresses this issue. It decomposes the
CBO for a class into its collaborator classes and
interfaces, allowing the developer to delve more
deeply into cases of high CBO values without
necessarily needing to examine program code.
More generally, knowing the collaborators of
each class has been considered an important aspect
of understanding a system (Biddle et al., 2002).
CouplingViz therefore also takes on a more general
program comprehension and navigation role beyond
merely focusing on cases of high coupling.
The tool provides a map of all classes and
interfaces in a system. The map indicates CBO
visually and allows interactive selection of a class or
interface to view its name, numerical CBO value,
coupling collaborators and, via colour, associated
object-oriented coupling categories.
Selection can either be carried out directly on a class
representation in the visualisation, or else by
selecting the corresponding class in the Eclipse IDE.
Automatic navigation to program code for a
selection is also provided. This corresponds to
operating at different levels of detail to help to
understand and navigate large and complex
systems—from the bird’s eye view, through the
intermediate ‘1000 foot view’ above the code
(Doernenburg, 2009), down to the code itself if
necessary. Moving through these different levels,
some of the questions that can be addressed using
CouplingViz are:
• Q1: What is the usage pattern for the different
types of object-oriented mechanisms involved in
class interaction in the system?
• Q2: What are the collaborators for a particular
class?
• Q3a: For a particular class is there a pattern to
the way it interacts with its collaborators?
• Q3b: Can a developer predict that a class with
such a pattern is less likely to be fault-prone than
would otherwise be expected from CBO size?
• Q4: What members (method calls, fields) are
accessed by a particular class on a collaborator?
• Q5: Which member accesses either to ‘self’
inside a particular class, or to a target
collaborator outside it, are resolved via
inheritance in an ancestor class?
138
Rosner P., Child M. and Counsell S..
Visualising Java Coupling and Fault Proneness.
DOI: 10.5220/0004706201380144
In Proceedings of the 5th International Conference on Information Visualization Theory and Applications (IVAPP-2014), pages 138-144
ISBN: 978-989-758-005-5
Copyright
c
2014 SCITEPRESS (Science and Technology Publications, Lda.)

2 DESCRIPTION OF CouplingViz
CouplingViz is a plugin to Eclipse to display both
fan-out and fan-in CBO for a Java project. Here, we
use, as an example, the Web templating open-source
Java system Velocity.
A detailed ‘bar view’ of fan-out is shown in
Figure 1. Vertical bars represent its 262 classes and
interfaces. The coupling value of each class is
indicated by the depth of each bar, with the
segments on the bar being coloured according to
categories denoting different object-oriented
mechanisms as described below. The depth of each
segment is proportional to the number of couples for
each category. Where the total vertical depth is
greater than the inter-row gap, a horizontal bar is
displayed at its base whose depth is proportional to
the excess. A white dot indicates a class with no fan-
out coupling. Inner classes are narrower than regular
classes. Interfaces are shown as circles. Package
boundaries are shown as dashed vertical lines above
the rows
Figure 2 shows the default birds-eye view of the
system. Here rows of square boxes and circles
respresent the classes and Java interfaces
respectively. Classes and inner classes with no fan-
out coupling are shown as shallow. The amount of
fan-out coupling for a class or inner class is
indicated by the shade of grey of its corresponding
box. Classes and interfaces can be ‘moused’ over for
display of their names and their CBO values.
The colour scheme is shown on the legend in
Figures 1 and 2. Blue indicates direct coupling,
meaning that at least one method call, constructor
call or field access from the source class is resolved
in the target. Yellow indicates local inheritance
coupling: the coupled target is an ancestor class of
the source class, containing at least one of the
methods called or fields accessed from within the
source class. Purple means foreign inheritance
coupling: at least one method call or field access
from the source class to a target has its resolved
destination not in the target, but rather, via
inheritance, in one of the target’s ancestors. Green
indicates interface coupling: at least one call from
the source is to an abstract method in the target
(either an interface or abstract class).
The bar view in Figure 1 shows the pattern of the
coupling categories at work in Velocity through the
incidences of the different colours. Whilst direct
coupling (blue) is predominant, interface coupling
(green) also has a significant presence, particularly
in one package. The presence of local inheritance
coupling (yellow) is a little lower, and foreign
inheritance coupling (purple) even lower. This type
of analysis shows how the visualisation allows us to
address Q1.
In the bird’s eye view in Figure 2, the class
Parse has been selected to display fan-out. This can
either be selected by clicking on its representation in
the visualisation, or else as in this case, by selecting
the class in the Eclipse package explorer. The
coupling targets are displayed and each can be
‘moused’ over showing its name (addressing Q2)
and the number of methods/fields accessed by the
source on the target.
Arrows appear above the targets coloured
according to the coupling categories. Figure 2 also
shows the outcome of the following: the target class
EventHandlerUtil with a blue arrow, indicating
direct coupling, has been selected, the start of the
class
EventHandlerUtil has been jumped to in
the Eclipse code pane and the name of the single
method accessed from
Parse has displayed in a
pop-up list (addressing Q4) in corresponding blue
text; the method has then been selected, and its code
is now jumped to in the Eclipse code pane.
In Figure 3, the ancestor target
Directive has
been clicked, the start of the code for this class has
appeared in the Eclipse code pane, and a list has
popped up showing the names of four methods
accessed from within
Parse. The yellow colour of
the text corresponds to the yellow of the arrow –
indicating local inheritance coupling for these
accesses (addressing Q5). Then the method
postRender() has been selected and the code for it
has been jumped to in the Eclipse code pane.
In Figure 4 all of the 40 targets of the source
class
BaseVisitor are coupled to it via foreign
inheritance coupling (purple arrows). One of these
targets
ASTIfStatement has been clicked and a
single method appears in the pop up list, also in
purple (also addressing Q5). Clicking on this method
shows a purple link to the destination ancestor class
SimpleNode where the method call resolves, and on
which a large purple arrow flashes. The code for the
method in
SimpleNode is jumped to in the Eclipse
code pane. From the visualisation, it is clear that all
the targets are in a single package. Clicking on all of
the targets reveals the same single method call from
BaseVisitor and the destination to this call is
revealed to be the same ancestor class SimpleNode.
Despite the high coupling value, the visualisation
has helped reveal a designed ordered relationship
between the source, targets and common inherited
destination (addressing Q3a) – the names of the
classes also helping in detecting the design. It is
likely that the high CBO value here would not be
VisualisingJavaCouplingandFaultProneness
139
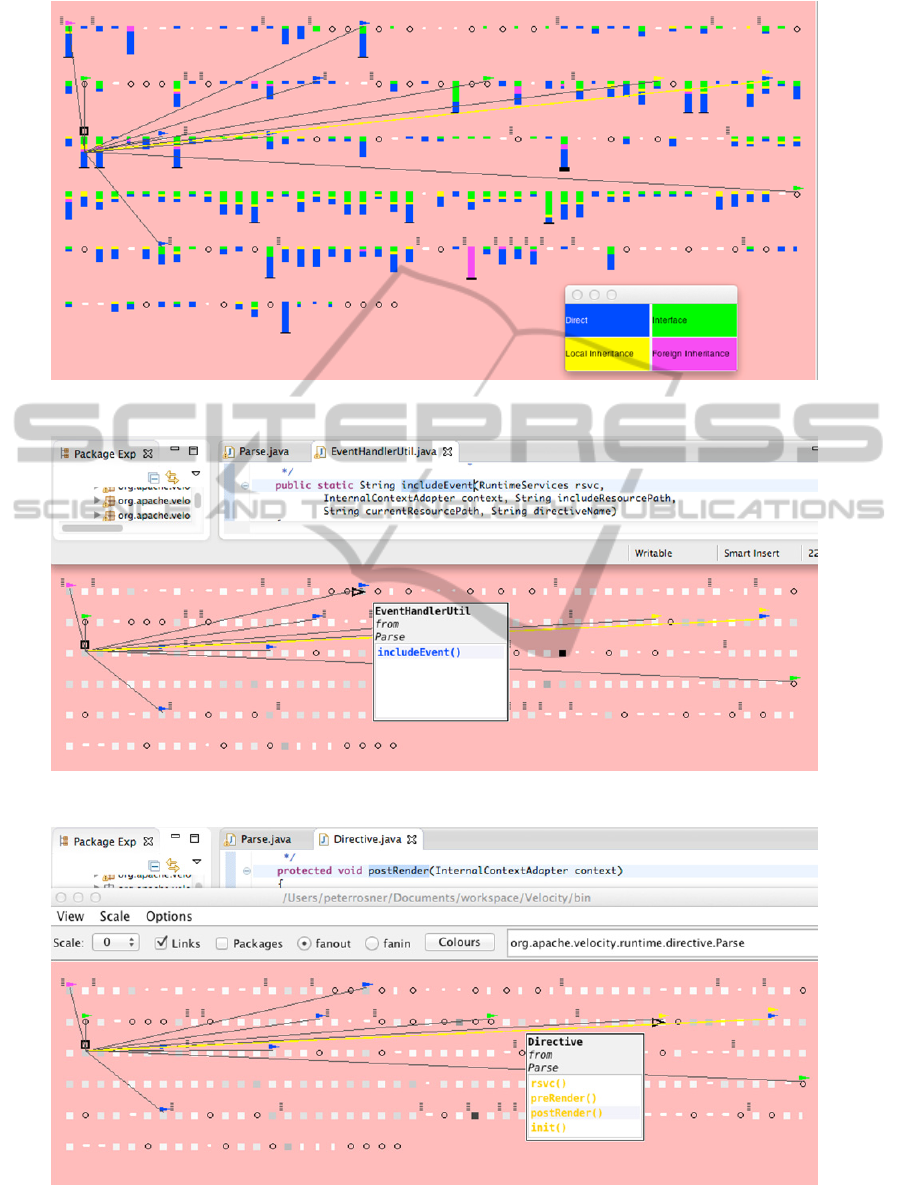
Figure 1: fan-out, bar view – class Parse selected.
Figure 2: fan-out, birds-eye view, direct coupling from Parse to EventHandlerUtil.
Figure 3: fan-out, inheritance coupling from Parse to Directive.
IVAPP2014-InternationalConferenceonInformationVisualizationTheoryandApplications
140

seen as harmful.
Figures 5 and 6 demonstrate the difference
between fan-out and fan-in coupling. Figure 5 shows
the fan-out coupling from the class
Parser.
Figure 6 shows fan-in coupling for the same class.
The members in the target accessed can be obtained
by clicking on a source class indicated with coloured
arrows above it. In this case by clicking on the
source class
ASTDirective, the list of methods it
calls on Parser is displayed. The method
isDirective()has then been selected and the code
in
Parser for this method is displayed in the
Eclipse code pane. It can be seen by comparing
Figures 5 and 6 how the visualisation easily shows
the difference between the extent of fan-out and fan-
in. In the case of
Parser, fan-out predominates.
3 NATURE OF THE
VISUALISATION
The CouplingViz overview is a small multiples
visualisation, allowing the simultaneous display of
the differences between individual classes and the
range of values present in the system (Tufte, 1990).
At the highest level, this depicts the CBO of each
class. The visualisation then provides multiple levels
of further information to be revealed using the
details on demand paradigm (Shneiderman, 1996).
In the decomposed overview, further information is
revealed about the nature of the coupling involved,
allowing classes with equivalent amounts of CBO to
be contrasted against each other. The selection of
individual source classes reveals the specific
collaborator classes which are coupled to, and the
selection of these target classes reveals the specific
member accesses the coupling consists of.
4 RELATED WORK
CouplingViz is intentionally narrowly focused on
the visualisation of coupling as defined by the CBO
metric. This distinguishes it from other tools which
present an overview of multiple metrics
simultaneously in order to gain insight into the
system on many dimensions at once. It is believed
that coupling is part of the intrinsic structure of a
system and has more significance than that of a
simple metric. The purpose of CouplingViz is to
allow the interactive investigation of this
significance. The use of a single metric also means
that the representations of individual classes are
relatively compact and allows large systems to be
displayed in a similar fashion to the course-grained
polymetric 2D views generated by CodeCrawler
(Lanza, 2004). However, in the latter the classes are
ordered according to one of the metrics under
investigation and their positions do not relate to their
location within the system. A fixed area allocated for
each class in CouplingViz is a little less space-
efficient than CodeCrawler. However it does allow
the types of couples to collaborators across the
system to be clearly discerned when an individual
class is selected and provides consistency between
fan-in and fan-out views.
Several tools (including CodeCrawler's fine-
grained views) represent systems as graph-like
structures in which classes are the nodes, with
various metrics encoded in their representations and
structural and/or coupling relationships between
classes are the edges (Erdemir et al., 2011; Risi and
Scanniello, 2012; Hanakawa, 2007). These
representations tend to be inappropriate for full
system overviews and do not share our narrow focus
on coupling.
A number of tools have used a city-metaphor for
visualising software systems in which classes are
depicted as 3D buildings (Steinbrückner and
Lewerentz, 2010; Wettel et al., 2011). Perhaps the
most similar to CouplingViz are (Langelier et al.,
2005), which uses CBO as one of three metrics
encoded in each building, represented as a change in
building colour from blue to red and (Caserta et al.,
2011) in which actual coupling lines are shown
above the city. These tools share the visualisation of
a system overview with CouplingViz, but present
much additional information beyond coupling,
tending to require more screen space and more
resources than the lighter-weight 2D approach used
by CouplingViz.
Another family of tools related to CouplingViz
depict dependencies. Managing dependencies is
important in software development to allow systems
to be architected into distinct independent modules.
While there is considerable overlap between the
concept of coupling between objects and
dependency between classes they are not the same
thing. One class depends on another class if it refers
to that class type anywhere within it, but a couple
exists only if it uses that type to access a member of
it. Coupling is therefore a subset of the dependencies
of a class. Furthermore, dependency visualisation
tools tend to focus on a higher level than individual
classes, typically depicting dependencies between
packages. These tools include IntelliJIDEA
(JetBrains, 2011), STAN (Odysseus, 2011), the
VisualisingJavaCouplingandFaultProneness
141
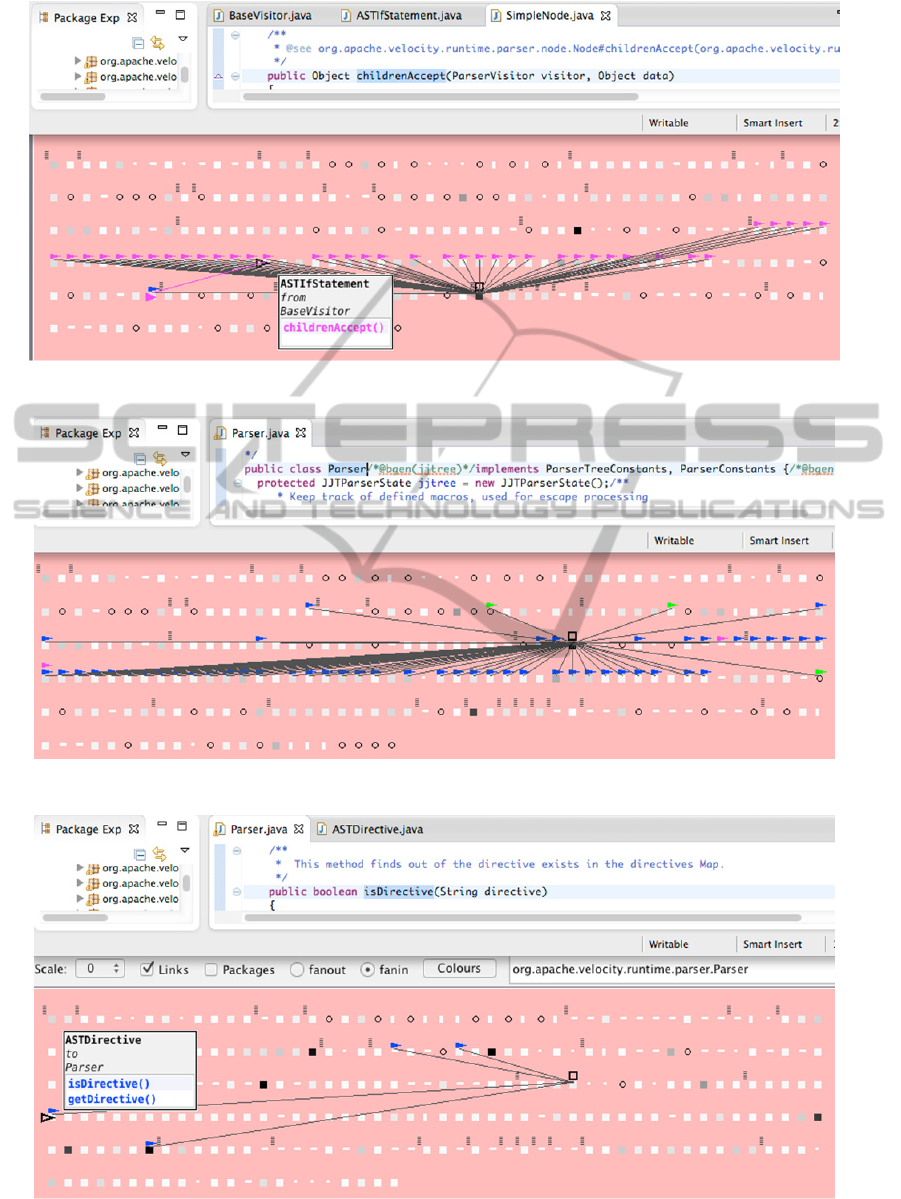
Figure 4: fan-out, foreign inheritance coupling BaseVisitor to ASTIfStatement.
Figure 5: fan-out from Parser.
Figure 6: fan-in into Parser, method call isDirective() from ASTDirective to Parser selected.
IVAPP2014-InternationalConferenceonInformationVisualizationTheoryandApplications
142
eDepend module of eUML2 (Soyatec, 2011), and
Eclipse Metrics plug-in (Sauer, 2011). All but the
last of these also enable drilling down to show the
inter-class dependencies between two packages but
none show an overview of dependencies for all
classes in a system.
5 COUPLING ‘BY DESIGN’
AND FAULT DATA
Data for faults generated between releases 3.0.1 and
3.1.0 of the Eclipse JDT core project, mined for
previous research (Counsell et al., 2013), was used
for a pilot investigation of whether a developer can
use a CouplingViz visualisation to successfully
detect classes where high CBO coupling is not in
fact harmful in terms of fault-proneness, addressing
Q3b.
For this pilot investigation one of the authors of
this paper, who was not given access to the fault
data, analysed the Eclipse project using its
CouplingViz visualisation. Classes with a CBO fan-
out of 20 or more were examined. The coupling was
assessed in terms of any of the following:
(1) package clustering of target classes, (2) repeated
patterns of method invocations on many targets
(3) indications from the category of coupling
involved that a design pattern (such as factory or
visitor) was present. Classes were categorised as
showing evidence that a significant proportion of
coupling resulted from such design features or else
showing little or no such evidence. We called these
categories design-coupled and ad-hoc coupled
respectively, with the assumption that coupling
arising from design is less harmful than in the
general case. Correlation was then carried out using
the fault data.
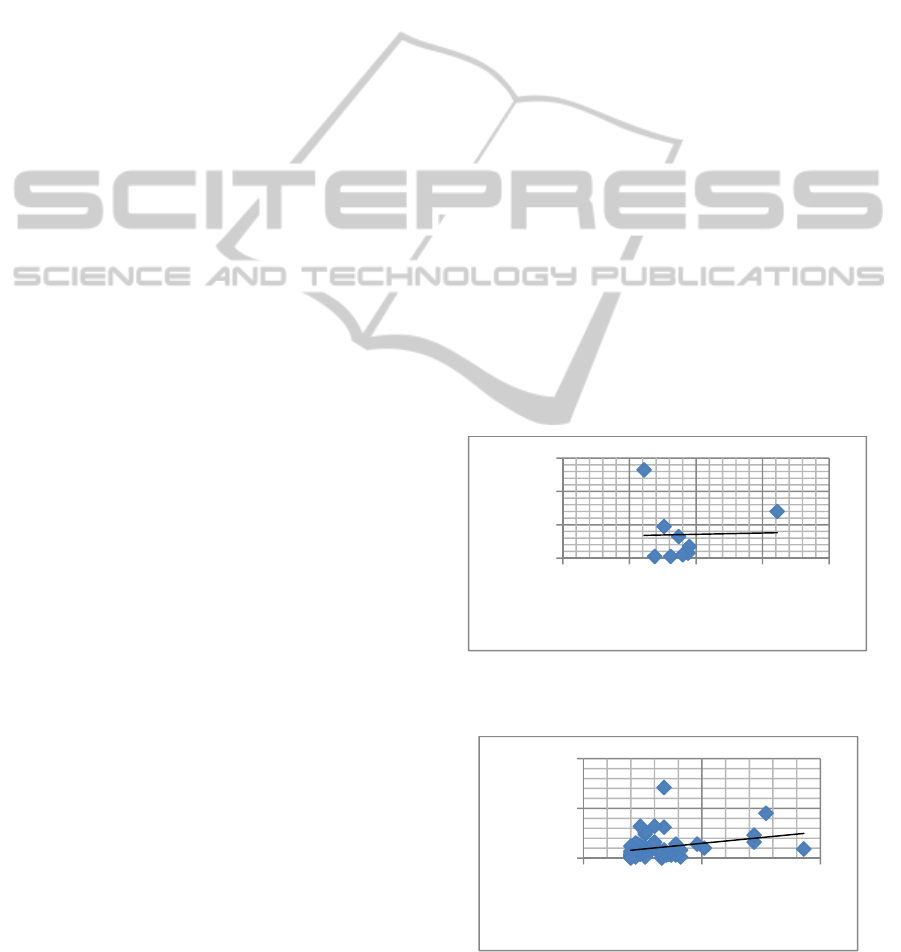
Figure 7 shows the distribution of the nine
classes which were considered by the subject to be
design-coupled. It shows the CBO of these nine
classes and the faults that each of those classes
exhibited between the two releases being considered.
The fitted line is almost horizontal indicating a very
low correlation between faults and CBO for these
classes. The correlation value (Pearson’s) was found
to be just 0.02. This is an interesting result since it
shows that a class whose high coupling was design-
inspired is likely to contain fewer faults than we
might expect (positively answering Q3b). The
average number of faults for the set of nine classes
was 14.11 and average CBO 90.44.
Figure 8 shows the corresponding graph for the
classes considered by the subject to be ad-hoc
coupled. There is a clear difference between the
values in this figure and those in Figure 7. The
correlation value was 0.20 in this case (not
significant). The average number of faults for the
set of sixty-five classes was 10.43; the average CBO
was 31.31.
The fact that for all the most highly coupled
classes of this particular Java project there was no
statistical significance to the correlation values of
coupling against faults is unexpected. Despite this,
the pilot study does indicate that a CouplingViz
visualisation could be used to identify those classes
with large amounts of coupling, but with a lesser
propensity for faults than would otherwise be
predicted. The work described thus provides some
insight into a research problem that has been tackled
very superficially until now – which types of
coupling are harmful and which are relatively
harmless? If this issue can be explored in depth, then
guidelines can start to be formed on which types of
coupling a designer can tolerate. CouplingViz thus
provides, at a high level of abstraction, a means of
observing and regulating that coupling, spotting
dangerous trends and giving the developer
information to tackle potential maintenance
problems.
Figure 7: Eclipse JDT core, CBO vs faults, design-
coupled’ classes.
Figure 8: Eclipse JDT core, CBO vs faults – ‘ad-hoc
coupled’ classes.
0
20
40
60
0 50 100 150 200
No.faults
CBO
0
50
100
050100
No.faults
CBO
VisualisingJavaCouplingandFaultProneness
143

6 FUTURE WORK
As well as developing the tool further, we plan to
supplement the pilot study described above with
more in-depth studies based on more developers.
We also envisage using a wider sample of class
sets, in order to validate the preliminary
conclusions made.
REFERENCES
Biddle, R., Noble, J., Tempero, E., “Reflections on CRC
Cards and OO Design,” 40th International
Conference on Technology of Object Oriented
Languages and Systems (TOOLS Pacific), Sydney
Australia, 2002.
Caserta, P., Zendra, O. and Bodenes, D. (2011) 3D
Hierarchical Edge bundles to visualize relations in a
software city metaphor, in: Visualizing Software for
Understanding and Analysis (VISSOFT), 2011 6th
IEEE International Workshop on, , pp. 1-8.
Chidamber, S. R., Kemerer, C. F., “A Metrics Suite for
Object Oriented Design,” IEEE Transactions on
Software Engineering, 20(6). pp. 476-493, 1994.
Counsell, S., Gatrell, M., Hierons, R., Murgia, A.,
Tonelli, R., Marchesi, M., Concas, G., “Conditional-
based refactorings and fault-proneness: an empirical
study,” TAIC PART 2013.
Doernenburg, E., “Get the 1000-Foot View,” in 97
Things Every Software Architect Should Know:
Collective Wisdom from the Experts, p. 56, ed
Monson Haefel, R., O’Reilly Media, Feb 2009.
Erdemir, U., Tekin, U. and Buzluca, F., “E-Quality: A
graph based object oriented software quality
visualization tool,” Visualizing Software for
Understanding and Analysis (VISSOFT), 2011 6th
IEEE International Workshop, pp. 1-8, 2011.
Hanakawa, N. (2007) Visualization for Software
Evolution Based on Logical Coupling and Module
Coupling, in: Software Engineering Conference,
2007. APSEC 2007. 14th Asia-Pacific, pp. 214-221.
JetBrains Inc., IntelliJIDEA, 2011 [Online]. Available
from: http://www.jetbrains.com/idea, Accessed
2013.
Langelier, G., Sahraoui, H. and Poulin, P.,
“Visualization-based analysis of quality for large-
scale software systems,” Proceedings of the 20th
IEEE/ACM international Conference on Automated
software engineering, Long Beach, CA, USA, New
York, NY, USA: ACM, pp. 214-223, 2005.
Lanza, M., “CodeCrawler - Polymetric views in action,”
Proceedings. In 19th International Conference on
Automated Software Engineering: pp. 394-395,
2004.
Odysseus Software GmbH, STAN. [Online]. Available
from: http://stan4j.com, 2011 [Accessed 2013].
Olague, H. M., Etzkorn, L. H., Gholston, S.,
Quattlebaum, S., “Empirical Validation of Three
Software Metrics Suites to Predict Fault-Proneness
of Object-Oriented Classes Developed using Highly
Iterative or Agile Software Development Processes,”
IEEE Transactions on Software Engineering, 33(6):
pp. 402-419, 2007.
Risi, M. and Scanniello, G., “MetricAttitude: a
visualization tool for the reverse engineering of
object oriented software,” Proceedings of the
International Working Conference on Advanced
Visual Interfaces, Capri Island, Italy, New York,
NY, USA: ACM, pp. 449-456, 2012.
Shneiderman, B., “The eyes have it: a task by data type
taxonomy for information visualizations,”
Proceedings IEEE Symposium on Visual Languages,
Boulder, Colorado, 3-6 September 1996, pp. 336-
343, 1996.
Sauer, F., Eclipse metrics plug-in [Online]. Available
from: http://metrics.sourceforge.net, 2011. Accessed
2013.
Soyatec, eDepend, 2011 [Online]. Available from:
http://www.soyatec.com/euml2 [Accessed 2013].
Steinbrückner, F. and Lewerentz, C., “Representing
development history in software cities,” Proceedings
of the 5th international symposium on Software
visualization, Salt Lake City, Utah, USA, New York,
NY, USA: ACM, pp. 193-202, 2010.
Tufte, E. R., Envisioning information, Cheshire, Conn.:
Graphics Press, 1990.
Wettel, R., Lanza, M. and Robbes, R., “Software
systems as cities: a controlled experiment,”
Proceedings of the 33rd International Conference on
Software Engineering, Waikiki, Honolulu, HI, USA,
New York, NY, USA: ACM, pp. 551-560, 2011.
IVAPP2014-InternationalConferenceonInformationVisualizationTheoryandApplications
144
