
Iterative Bit- and Power Allocation in Correlated MIMO Systems
Francisco Cano-Broncano
1
, Andreas Ahrens
2
and C´esar Benavente-Peces
1
1
Universidad Polit´ecnica de Madrid, Ctra. Valencia. km. 7, 28031 Madrid, Spain
2
Hochschule Wismar, University of Technology, Business and Design, Faculty of Engineering, Department of Electrical
Engineering and Computer Science, Philipp-M¨uller-Straße, PO box 1210, 23952 Wismar, Germany
Keywords:
Antennas Correlation, Iterative Bit Allocation, Multiple-input Multiple-output System, Power Allocation,
Singular-value Decomposition, Wireless Transmission.
Abstract:
In this contribution a novel iterative bit- and power allocation (IBPA) approach has been developed when trans-
mitting a given bit/s/Hz data rate over a correlated frequency non-selective (4 ×4) Multiple-Input Multiple-
Output (MIMO) channel. The iterative resources allocation algorithm developed in this investigation is aimed
at the achievement of the minimum bit-error rate (BER) in a correlated MIMO communication system. In
order to achieve this goal, the available bits are iteratively allocated in the MIMO active layers which present
the minimum transmit power requirement per time slot.
1 INTRODUCTION
The use of multiple antennas at the transmitter and
multiple antennas at the receiver side, which is
well-known MIMO system, improves channel per-
formance and link reliability of wireless communica-
tions. MIMO systems can considerably increase data
rate through spatial multiplexing and significantly im-
prove robustness and coverage through diversity com-
bining (Yang et al., 2011).
Adaptive Modulation (AM) is a promising tech-
nique able to increase the spectral efficiency of wire-
less transmission systems by adapting the signal pa-
rameters, such as modulation constellation or trans-
mit power, based on the uncertain channel conditions
(Zhou et al., 2005). In order to achieve a better
system performance given a fixed data rate an adap-
tive spatial modulation transmission scheme was pro-
posed in (Yang et al., 2011). The performance of
MIMO systems using spatial multiplexing is analysed
under bit- and power allocation techniques. Exist-
ing bit loading and transmit power allocation tech-
niques are often optimized for maintaining both a
fixed power and a fixed target bit-error rate while
attempting to maximize the overall data-rate. How-
ever, delay-critical real-time interactive applications,
such as voice or video transmission, may require a
fixed data rate (Ahrens et al., 2008). Provided perfect
channel state information (PCSI) is available at the
transmitter side two major optimization problems are
considered to be solved. First, the optimal bit load-
ing. Second, the power allocation optimization prob-
lem (Weng et al., 2010). Given PCSI at the transmit-
ter, power and bits can be allocated to different lay-
ers. Adaptive bit and power allocation algorithms,
which can significantly improve the MIMO system
performance, have received a huge research activity
lately, and can be divided into two groups according
to their performance: optimal and suboptimal algo-
rithms. Optimal allocation algorithms usually have
high computational complexity, making them difficult
to apply to practical communication systems (Zheng
et al., 2013). In order to implement bit and power
allocation in practical communication systems many
computationally efficient suboptimal allocation algo-
rithms have been proposed where most of them are
iterative. Krongold proposed a Lagrange-multiplier-
based integer-bits power allocation algorithm (Kron-
gold et al., 2000). The algorithm in (Goldfeld, 2002)
minimizes the BER subject to a requested data rate
and total transmit power by using adaptive power
loading and uniform bit allocation over all subchan-
nels. Zheng proposed a dynamic bound restriction
iterative algorithm framework to reduce the compu-
tational complexity (Zheng et al., 2013).
In this paper an optimized scheme with fixed
transmission modes per time slot are firstly analysed.
Furthermore, the proposed algorithm performance
has been compared to already developed strategies.
The novel contribution of this research is the proposal
83
Cano-Broncano F., Ahrens A. and Benavente-Peces C..
Iterative Bit- and Power Allocation in Correlated MIMO Systems.
DOI: 10.5220/0004708400830093
In Proceedings of the 4th International Conference on Pervasive and Embedded Computing and Communication Systems (PECCS-2014), pages 83-93
ISBN: 978-989-758-000-0
Copyright
c
2014 SCITEPRESS (Science and Technology Publications, Lda.)

of a new iterative bit and power allocation (IBPA) ap-
proach per MIMO layer based on unequal power dis-
tribution per MIMO active layer. The remaining part
of this paper is structured as follows: Section 2 intro-
duces the system model and the quality criteria con-
siderations. The proposed solutions of bit and power
allocation are discussed in section 3, while the associ-
ated performance results are presented and interpreted
in section 4. Finally, section 5 provides some con-
cluding remarks.
2 MIMO SYSTEM MODEL
According to (Ahrens et al., 2008) a frequency non-
selective MIMO communication link with n
T
anten-
nas in transmission and n
R
in reception can be de-
scribed as
u = H·c+ n , (1)
where u corresponds to the (n
R
×1) received data
vector, H is the (n
R
×n
T
) channel matrix, c is the
(n
T
×1) transmitted data vector and n is the Addi-
tive White Gaussian Noise (AWGN) vector. Further-
more, it is assumed that the coefficients of the channel
matrix H are independently Rayleigh distributed with
equal variance and that the number of transmit anten-
nas n
T
equals the number of receive antennas n
R
. In
order to avoid the inter-antenna interferences, Singu-
lar Value Decomposition (SVD) is used to transform
the MIMO channel into independent layers. By ap-
plying the SVD technique to the MIMO channel ma-
trix H, it is possible to rewrite the channel matrix as
H = S ·V·D
H
, where S and D
H
are unitary matrices
and V is a real-valued diagonal matrix of the posi-
tive square roots of the eigenvaluesof the matrix H
H
H
sorted in descending order. By using the SVD tech-
nique in pre- and post-processing, the MIMO chan-
nel can be described as multiple independent SISO
(single-input single-output) channels (so called lay-
ers) with different gains given by the singular values
in V,
y = S
H
·u = S
H
(H·D·c+ n) = V·c+ w . (2)
where H·D·c is the pre-processed transmit data vec-
tor and S
H
·u is the post-processed data vector at the
receiver side.
The considered quality criteria for end-to-end
wireless communication system performance is given
in terms of the bit-error-rate (BER), which quantifies
the reliability of the entire wireless system from input
to output. The signal-to-noise ratio (SNR) per quadra-
ture component is defined by
ρ =
(Half vertical eye opening)
2
Noise Power
=
(U
A
)
2
(U
R
)
2
, (3)
whereU
A
is the half vertical eye opening andU
2
R
is the
noise power per quadrature component taken at the
detector input. The relationship between the signal-
to-noise ratio ρ and the bit-error probability evaluated
for AWGN channels and M-ary Quadrature Ampli-
tude Modulation (QAM) is given by
P
b
=
2
log
2
(M)
·
1−
1
√
M
·erfc
r
ρ
2
. (4)
The application of the aforementioned SVD pre- and
c
ℓ,k
y
ℓ,k
w
ℓ,k
p
ξ
ℓ,k
Figure 1: System model per MIMO layer ℓ and transmitted
data block k after SVD pre- and post-processing.
post-processing leads to the diagram in Fig. 1 with
different eye openings per activated MIMO layer ℓ
and per transmitted symbol block k according to
U
(ℓ,k)
A
=
q
ξ
ℓ,k
·U
s ℓ
. (5)
Considering QAM constellations, the average trans-
mit power P
s ℓ
per MIMO layer may be expressed as
P
s ℓ
=
2
3
U
2
s ℓ
(M
ℓ
−1) . (6)
By taking L ≤ min(n
T
,n
R
) MIMO activated layers
into account, the overall transmit power results in
P
s
=
L
∑
ℓ=1
P
s ℓ
. (7)
The layer-specific bit-error probability at the time
slot k is obtained from combining (3), (4), and (5) as
P
(ℓ,k)
b
=
2
log
2
(M
ℓ
)
1−
1
√
M
ℓ
erfc
U
(ℓ,k)
A
√
2U
R
!
.
(8)
The aggregate bit-error probability at the time slot k,
taking L activated MIMO-layers into account, results
in
P
(k)
b
=
1
L
∑
ν=1
log
2
(M
ν
)
L
∑
ℓ=1
log
2
(M
ℓ
)P
(ℓ,k)
b
. (9)
Finally, the BER of the whole system is obtained by
considering the different transmission block SNRs.
In order to balance the bit error probability along
the MIMO system activated layers bit and powerload-
ing can be helpful. The bit error probability at a given
time k is influenced by both the chosen QAM con-
stellation and the layer-specific weighting factors. In
PECCS2014-InternationalConferenceonPervasiveandEmbeddedComputingandCommunicationSystems
84

particular the layer-specific weighting factors influ-
ence the overall performance. Therein, the ratio be-
tween the largest and the smallest weighting factor is
an unique indicator of the unequal weighting of the
MIMO layers at a given time k. Furthermore, the ra-
tio between the largest and the smallest singular val-
ues is significantly influenced by the antennas corre-
lation effect due to the proximity of the multiple an-
tennas available at the transmitter and receiver sides.
In consequence, the transmit-to-receive antenna paths
become similar affecting the channel behaviour by in-
creasing the overall BER in the wireless communica-
tion link (Cano-Broncano et al., 2012).
In this work we focus on the influence of
transmitter-side antennas correlation on the MIMO
system performance. The correlation effect is de-
scribed by the correlation coefficients. Transmitter-
side antennas correlation coefficients describe the
similitude between paths corresponding to a pair of
antennas (at the transmitter side) with respect to a ref-
erence antenna (at the receiver side). Fig. 2 describes
the basic set-up for obtaining the correlation coeffi-
cient, where d is the transmitter-side antennas spac-
ing, d
1
is the distance between transmit antenna #1
and the receiver-side antenna (taken as reference) and
d
2
is the distance from transmit antenna #2 to the ref-
erence receive antenna (it is assumed d << d
1
,d
2
); φ
is the departure angle. In consequence two paths are
established and the correlation coefficient describes
how like they are.
d
1
d
2
d/2
d/2
antenna #1
Transmitter side
Receiver side
antenna #1
antenna #2
φ
Figure 2: Antennas’ physical disposition: two transmit and
one receive antennas.
As shown in (Ahrens et al., 2013), the transmitter-
side correlation coefficient is given by
ρ
(TX)
1,2
= e
j2πd
λ
cos(φ)
. (10)
The antennas path correlation coefficient for line of
sight (LOS) trajectories depends on the antennas sep-
aration d
λ
and the transmit antennas reference axis
rotation angle φ (or signals angle of departure). By
taking the scattered environment of wireless chan-
nels into consideration, the transmit antennas refer-
ence axis rotation angle φ becomes time-variant and
(10) results in:
ρ
(TX)
1,2
(φ,σ
ξ
) = e
j2πd
λ
cos(φ)
e
−
1
2
(2πd
λ
sin(φ)σ
ξ
)
2
, (11)
where σ
ξ
corresponds to the standard deviation of the
scatters’ angle ξ. The parameters of the investigated
channel constellations are shown in Tab. 1. According
Table 1: Parameters of the investigated channel constella-
tions.
Description φ σ
ξ
d
λ
Weak correlation 30
◦
1 1
Strong correlation 30
◦
1 0,25
to (Ahrens et al., 2013) the (n
T
,n
R
) correlated matrix
MIMO system model H
c
is given by
vec(H
c
) = R
1
2
HH
·vec(H) , (12)
where H is a (n
T
,n
R
) uncorrelated channel matrix
with independent,identically distributed complex val-
ued Rayleigh elements and vec(·) is the operator
stacking the matrix H into a vector column-wise. Fol-
lowing the quite common assumption that the corre-
lation between the antenna elements at the transmitter
side is independent from the correlation between the
antenna elements at the receiver side, the correlation
matrix R
HH
can be decomposed into a transmitter side
correlation matrix R
TX
and a receiver side correlation
matrix R
RX
by using the Kronecker product.
R
HH
= R
TX
⊗R
RX
. (13)
In order to investigate the potential of bit- and power
loading, two different correlated channel profiles
(weak and strong) are depicted in Fig. 3 and Fig. 4.
Therein, the probability density function (PDF) of the
ratio ϑ between the smallest
p
ξ
4,k
and the largest
p
ξ
1,k
layer specific singular value for weakly and
strongly correlated frequency non-selective (4×4)
MIMO systems are shown. An uncorrelated one is
considered for comparison reasons.
From Fig. 3 it is observed that the difference be-
tween layers increases (i.e. the unequal weighting)
as the correlation does. This means that the ratio be-
tween the largest and the smallest singular value in-
creases, and due to that, the probability of having pre-
dominant layers increases. A similar conclusion can
be obtained by analysing the PDF curves from Fig. 4
where it is shown that the unequal weighting ratio be-
tween the largest and the smallest layer is even higher.
IterativeBit-andPowerAllocationinCorrelatedMIMOSystems
85
0 0.1 0.2 0.3 0.4 0.5
0
0.005
0.01
0.015
0.02
uncorrelated
correlated
pdf →
ϑ →
Figure 3: PDF (probability density function) of the ratio
ϑ between the smallest and the largest singular value for
weakly correlated (solid line) as well as uncorrelated (dot-
ted line) frequency non-selective (4×4) MIMO channel.
0 0.1 0.2 0.3 0.4 0.5
0
0.005
0.01
0.015
0.02
uncorrelated
correlated
pdf →
ϑ →
Figure 4: PDF (probability density function) of the ratio
ϑ between the smallest and the largest singular value for
strongly correlated (solid line) as well as uncorrelated (dot-
ted line) frequency non-selective (4×4) MIMO channel.
3 BIT AND POWER
ALLOCATION
Thanks to bit and power allocation techniques it is
possible to use wireless channel in an optimised way,
e.g. minimizing the BER performance at a fixed data
rate under the constraint of a limited total MIMO
transmit power. In general, regarding the channel
quality, the BER performance is affected by both
the layer-specific weighting factors
p
ξ
ℓ,k
and the
QAM-constellation sizes M
ℓ
. Assuming a fixed data
rate regardless the channel quality the resulting layer-
specific QAM constellations for a fixed data through-
put are highlighted in Tab. 2.
Following the allocation of the bits per layer,
Table 2: Investigated QAM transmission modes.
throughput layer 1 layer 2 layer 3 layer 4
8 bit/s/Hz 256 0 0 0
8 bit/s/Hz 64 4 0 0
8 bit/s/Hz 16 16 0 0
8 bit/s/Hz 16 4 4 0
8 bit/s/Hz 4 4 4 4
c
ℓ,k
y
ℓ,k
w
ℓ,k
p
ξ
ℓ,k
√
p
ℓ,k
Figure 5: Resulting layer-specific system model including
MIMO-layer PA.
Power Allocation (PA) can be added to optimize the
overall BER. The layer-specific power allocation fac-
tors
√
p
ℓ,k
adjust the half-vertical eye opening per
symbol block to
U
(ℓ,k)
APA
=
√
p
ℓ,k
·
q
ξ
ℓ,k
·U
sℓ
. (14)
This results in the layer-specific transmit power
per symbol block k
P
(ℓ,k)
s PA
= p
ℓ,k
·P
sℓ
, (15)
where P
sℓ
denotes the allocated power per MIMO
layer without PA e.g. P
sℓ
= P
s
/L. Therein the parame-
ter L describes the number of activated MIMO layers.
Taking all activated MIMO layers into account, the
overall transmit power per symbol block k is obtained
as
P
(k)
s PA
=
L
∑
ℓ=1
P
(ℓ,k)
sPA
. (16)
With (14) the layer-specific bit-error probability at the
time k changed to
P
(ℓ,k)
bPA
=
2
log
2
(M
ℓ
)
1−
1
√
M
ℓ
erfc
U
(ℓ,k)
APA
√
2U
R
!
.
(17)
In order to find the optimal set of PA parameters min-
imizing the overall BER, i.e.,
√
p
ℓ,k
, the Lagrange
multiplier method is used. Using the Lagrange multi-
plier method, the cost function J(p
0
,.. . , p
N
b
−1
) may
be expressed as
J(···) =
1
L
∑
ν=1
log
2
(M
ν
)
L
∑
ℓ=1
log
2
(M
ℓ
)P
(ℓ,k)
b
+ λ ·B ,
(18)
PECCS2014-InternationalConferenceonPervasiveandEmbeddedComputingandCommunicationSystems
86
where λ denotes the Lagrange multiplier. The param-
eter B in (18) describes the boundary condition
B =
L
∑
ℓ=1
P
sℓ
−P
(ℓ,k)
sPA
= 0 (19)
=
L
∑
ℓ=1
P
sℓ
(1− p
ℓ,k
) = 0 . (20)
A natural choice is again to opt for a scheme that uni-
formly distributes the overall transmit power along
the number of activated MIMO layers, i.e. P
sℓ
=
P
s
/L. In this case, the boundary condition simplifies
to
B =
P
s
L
L
∑
ℓ=1
(1− p
ℓ,k
) = 0 . (21)
Following this equation the transmit power co-
efficients have to fulfill the following equation
∑
L
ℓ=1
p
ℓ,k
= L. Differentiating the Lagrangian cost
function J(p
1,k
, p
2,k
,.. . , p
L,k
) with respect to the p
ℓ,k
and setting it to zero, leads to the optimal set of PA
parameters. In order to study the effect of PA thor-
Table 3: Investigated channel profiles assuming a (4×4)
MIMO system.
Profile layer 1 layer 2 layer 3 layer 4
CM-1 1,7500 0,8750 0,4375 0,2188
CM-2 1,9000 0,6333 0,2111 0,0704
oughly, two different fixed channel profiles as shown
in Tab. 3 are investigated. For comparison reason, the
channel profile CM-1 describes a MIMO channelwith
low degree of correlation with ϑ = 0,125 whereas the
channel CM-2 introduces a high degree of correlation,
with ϑ = 0,037. Since the optimal PA solution is no-
tably computationally complex to implement, a sub-
optimal solution is investigated, which concentrates
on the argument of the complementary error function.
In this particular case the argument of the comple-
mentary error function
ρ
(ℓ,k)
PA
=
U
(ℓ,k)
A PA
2
U
2
R
(22)
is assumed to be equal for all activated MIMO lay-
ers per data block k, i. e., ρ
(ℓ,k)
PA
= constant ℓ =
1,2, .. .,L. Assuming that the transmit power per
layer is uniformly distributed, the power to be allo-
cated to each activated MIMO layer ℓ and transmitted
data block k can be simplified as follows:
p
ℓ,k
=
(M
ℓ
−1)
ξ
ℓ,k
·
L
L
∑
ν=1
(M
ν
−1)
ξ
ν,k
. (23)
10 12 14 16 18 20
10
−4
10
−3
10
−2
10
−1
10 ·lg(E
s
/N
0
) (in dB) →
bit-error rate →
(256,0,0, 0) QAM
(64,4,0,0) QAM
(16,16,0, 0) QAM
(16,4,4,0) QAM
(4,4,4,4) QAM
Figure 6: BER with optimal PA (dotted line) and without PA
(solid line) when using the transmission modes introduced
in Tab. 2 and transmitting 8 bit/s/Hz over channel CM-1.
10 12 14 16 18 20
10
−4
10
−3
10
−2
10
−1
10 ·lg(E
s
/N
0
) (in dB) →
bit-error rate →
(256,0,0, 0) QAM
(64,4,0,0) QAM
(16,16,0, 0) QAM
(16,4,4,0) QAM
(4,4,4,4) QAM
Figure 7: BER with optimal PA (dotted line) and without PA
(solid line) when using the transmission modes introduced
in Tab. 2 and transmitting 8 bit/s/Hz over channel CM-2.
Here, for each symbol of the transmitted MIMO sym-
bol vector the same half vertical eye opening of
U
(ℓ,k)
A PA
=
√
p
ℓ,k
·
q
ξ
ℓ,k
·U
sℓ
(24)
can be guaranteed (ℓ = 1,.. .,L), i.e.,
U
(ℓ,k)
A PA
= constant ℓ = 1, 2,. .. ,L . (25)
When assuming an identical detector input noise vari-
ance for each channel output symbol, the above-
mentioned equal quality scenario is encountered. The
BER curves for channel profiles CM-1 and CM-2 are
shown in Fig. 6 and Fig. 7. In order to use the MIMO
channel in an optimized way not all the MIMO layers
should be necessarily activated. Furthermore, PA in
combination with an appropriate number of activated
MIMO layers guarantee the best BER performance
when transmitting a fixed data rate of 8 bit/s/Hz over
uncorrelated non-frequencyselective MIMO channel.
IterativeBit-andPowerAllocationinCorrelatedMIMOSystems
87
10 12 14 16 18 20
10
−3
10
−2
10
−1
10 ·lg(E
s
/N
0
) (in dB) →
bit-error rate →
(16,16,0, 0) QAM
(16,4,4,0) QAM
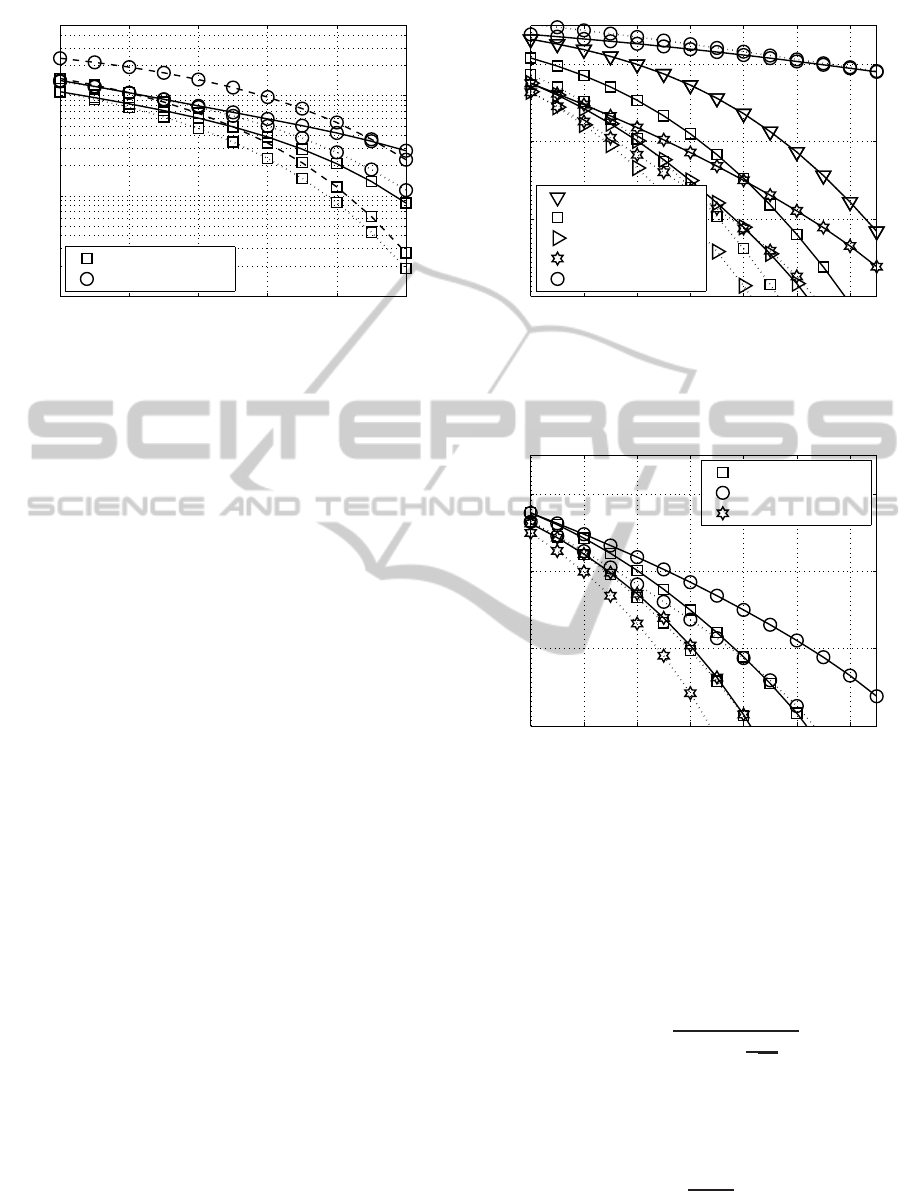
Figure 8: BER with optimal PA (dotted line), equal-SNR
PA (dashed line) and without PA (solid line) when using the
transmission modes introduced in Tab. 2 and transmitting 8
bit/s/Hz over channel CM-2.
From the simulation results it can be seen that not all
the MIMO layers should be necessarily activated in
order to get the best BER.
In Fig. 8 the obtained BER curves with the opti-
mal PA are composed with the abovementioned equal
quality criteria. As demonstrated by computer sim-
ulations the loss in the overall BER with the equal
quality criteria is quite acceptable when using an op-
timized bit loading. Fig. 9 shows a comparison of
the BER curves among the listed QAM transmission
modes in Tab. 2 with and without PA and justifies the
beforehand drawn conclusions. So far the efficiency
of fixed transmission modes was studied focusing on
minimizing the overall BER.
An optimized scheme would now use the specific
transmission mode, guaranteeing the minimum BER
for each symbol block k. As highlighting in Fig. 10 by
using the best transmission mode per time slot a fur-
ther minimizing of the overall BER can be obtained.
The drawback is the higher signalling overhead.
Following the investigated fixed transmission
modes, iterative bit and power allocation strategies
seem to be the most challenging solutions when min-
imizing the overall BER. Here the efficiency of bit
auctioning algorithms is investigated. Such solutions
test the amount of transmit power needed to transmit
a given numbers of bits per layer before allocating the
bit to the layer and deciding for a constellation which
requires the minimum power. For the iterative bit and
power allocation solution investigated in this work it
is first tested in which layer the allocation of an extra
bit requires the minimum transmit power taking all
activated layers into account (ℓ = 1,2,..., L).
In order to find out the best bit allocation perfor-
mance per time slot, it is required to find the appro-
12 14 16 18 20 22 24
10
−8
10
−6
10
−4
10
−2
10 ·lg(E
s
/N
0
) (in dB) →
bit-error rate →
(256,0,0,0) QAM
(64,4,0,0) QAM
(16,16,0,0) QAM
(16,4,4,0) QAM
(4,4,4, 4) QAM
Figure 9: BER with PA (dotted line) and without PA (solid
line) when using the transmission modes introduced in
Tab. 2 and transmitting 8 bit/s/Hz over non-frequency un-
correlated selective MIMO channels.
12 14 16 18 20 22 24
10
−8
10
−6
10
−4
10
−2
10 ·lg(E
s
/N
0
) (in dB) →
bit-error rate →
(16,16,0,0) QAM
(16,4,4,0) QAM
Adaptive TM
Figure 10: BER with PA (dotted line) and without PA (solid
line) when using the transmission modes (TM) introduced
in Tab. 2 and transmitting 8 bit/s/Hz over non-frequency se-
lective channels (▽ , adaptive choice of the transmission
mode).
priate QAM constellation with the minimum transmit
power. For that, firstly from equation (4) it is required
to solve the SNR parameter resulting in
ρ
(ℓ,k)
IBPA
= 2 ·inverfc
2
P
(ℓ,k)
b
·log
2
(M
ℓ
)
2·
1−
1
√
M
ℓ
. (26)
The half-level transmit amplitude on each MIMO
layer results together with (3) and (5) in
(U
(ℓ)
s IBPA
)
2
=
ρ
(ℓ,k)
IBPA
ξ
ℓ,k
·U
2
R
. (27)
Consequently, using (26) and (27), the transmit power
PECCS2014-InternationalConferenceonPervasiveandEmbeddedComputingandCommunicationSystems
88

per MIMO layer (6) can be obtained as
P
(ℓ,k)
s IBPA
=
4
3
(M
ℓ
−1)
U
2
R
ξ
ℓ,k
inverfc
2
P
(ℓ,k)
b
·log
2
(M
ℓ
)
2·
1−
1
√
M
ℓ
(28)
With a given noise power per quadrature component
U
2
R
, the layer-specific weighting ξ
ℓ,k
and a reference
bit-error rate P
(ℓ,k)
b
, the transmit power per layer can
be calculated for a given M
ℓ
.
In a first approach the proposed IBPA solution fo-
cuses on minimizing the overall BER at a fixed data
rate. Fig. 12 illustrates the working principle at a fixed
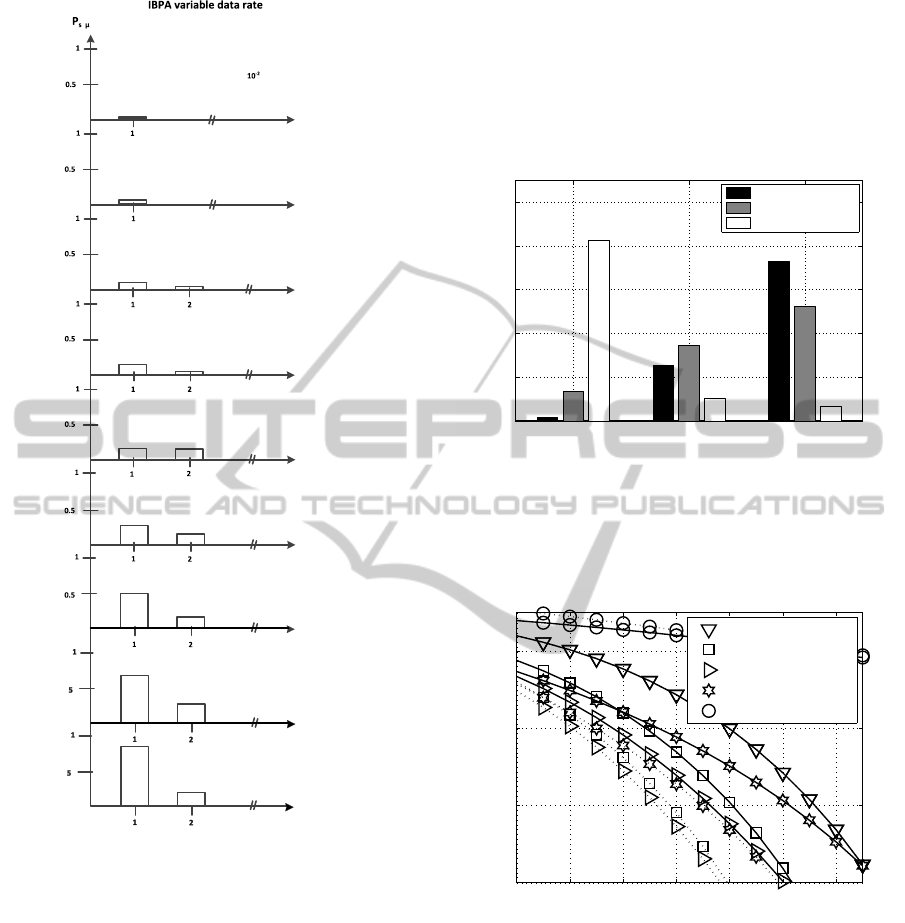
data rate of 8 bit/s/Hz using channel CM-2. Accord-
ing to Fig. 11 firstly the bit-error rate level is fixed.
Next the bit allocation process is started with two bits.
The QAM constellation is transmitted over the layer
with the minimum power. Here layer ℓ = 1 and the
(4,0, 0,0) transmission mode is selected. After that,
as the overall transmit power P
(k)
s IBPA
=
∑
L
ℓ=1
P
(ℓ,k)
s
is
lower than one, another two bits are allocated. Result-
ing in the (16,0,0,0) transmission mode depicted in
the second row from Fig. 12. In the third row, as an-
other two more bits are allocated, the P
(k)
s IBPA
exceeds
the power limitation so the BER level is increased to
10
−6
, being (16, 4,0, 0) the updated QAM transmis-
sion mode. In the fourth row, the last two bits are allo-
cated due to the 8 bit/s/Hz limitation. In this last iter-
ation the BER level is increased to 10
−3
. This results
in the (64,4, 0,0) transmission mode. As the available
8 bits have been allocated, the bit allocation process
is finished. After the bit allocation process, power al-
location can be used to share the remaining power if
P
(ℓ,k)
s IBPA
< 1 and to balance the bit error probabilities
in the number of activated MIMO layers. Since the
transmit power is not uniformly distributed, the be-
forehand developed power allocation schemes can not
be used any longer, with P
(ℓ,k)
s IBPA
6= P
(k)
s
/L. In this case
the transmit power allocation parameter has to fullfill
the following boundary condition
P
(k)
s
=
L
∑
ℓ=1
p
(ℓ,k)
IBPA
·P
(ℓ,k)
s IBPA
. (29)
Again, a suboptimal power allocation can be found
which concentrates on the argument of the comple-
mentary error function resulting in
ρ
(ℓ,k)
IBPA
= ξ
ℓ,k
· p
(ℓ,k)
IBPA
·
(U
s ℓ
)
2
U
2
R
, (30)
which is assumed to be equal for all activated
MIMO layers per data block k, i.e., ρ
(ℓ,k)
IBPA
=
constant (ℓ = 1,2,... ,L). The new power parameter
p
(ℓ,k)
IBPA
is calculated for each activated MIMO layer ℓ
and transmitted data block k, taking into consideration
the transmit power P
(ℓ,k)
s IBPA
per MIMO layer (28), the
boundary condition (29) and the SNR per quadrature
component (30). The new power parameter p
(ℓ,k)
IBPA
can
be shown to be calculated as follows
p
(ℓ,k)
IBPA
=
1
P
(ℓ,k)
s IBPA
·
M
ℓ
−1
ξ
ℓ,k
·
1
L
∑
ν=1
(M
ν
−1)
ξ
ν,k
. (31)
Using the power parameter p
(ℓ,k)
IBPA
from equation (31)
to be allocated in each transmitted MIMO symbol, the
half vertical eye opening changes to
U
(ℓ,k)
A IBPA
=
q
p
(ℓ,k)
IBPA
·
q
ξ
ℓ,k
·U
(ℓ)
s IBPA
, (32)
and in consequence the MIMO SNR per layer be-
comes
ρ
(ℓ,k)
IBPA
= p
(ℓ,k)
IBPA
·ξ
ℓ,k
·
(U
(ℓ)
s IBPA
)
2
U
2
R
. (33)
With the obtained transmit power per MIMO layer ℓ
and the symbol block k, the half level transmit ampli-
tude results in
U
(ℓ)
s IBPA
=
s
3
2
·
P
(ℓ,k)
s IBPA
(M
ℓ
−1)
(34)
Consequently, using (33) and (34), the bit-error rate
per MIMO layer P
(ℓ,k)
b
is modified to
P
(ℓ,k)
b IBPA
=
2·
1−
1
√
M
ℓ
log
2
(M
ℓ
)
erfc
v
u
u
t
3· p
(ℓ,k)
IBPA
·ξ
ℓ,k
·P
(ℓ,k)
s IBPA
4·U
2
R
·(M
ℓ
−1)
(35)
Afterwards, the PA algorithm is applied according to
Fig. 11 and Fig. 12. Firstly the remaining non allo-
cated power is equally distributed over the MIMO ac-
tive layers. Secondly, an equal-SNR PA technique for
Non-Equal Power Distribution is introduced.
The drawback of the so far investigated IBPA so-
lution, the fixed data rate per time slot, can be avoided
for improving the overall performance. First four
bits are equally allocated like the first four bits in
the IBPA with fixed data rate method. Within this
research the 8-QAM is excluded since the transmit
power per MIMO layer expression do not consider the
transmit power of an 8-QAM accurate enough. The
updated QAM constellation size is (16, 0,0, 0). The
QAM constellation with the minimum transmit power
is selected among the different transmission modes
achieved due to the bit allocation in the different lay-
ers. After that, bits are individually allocated as long
as the overall transmit powerP
(k)
s IBPA
is lower than one.
IterativeBit-andPowerAllocationinCorrelatedMIMOSystems
89
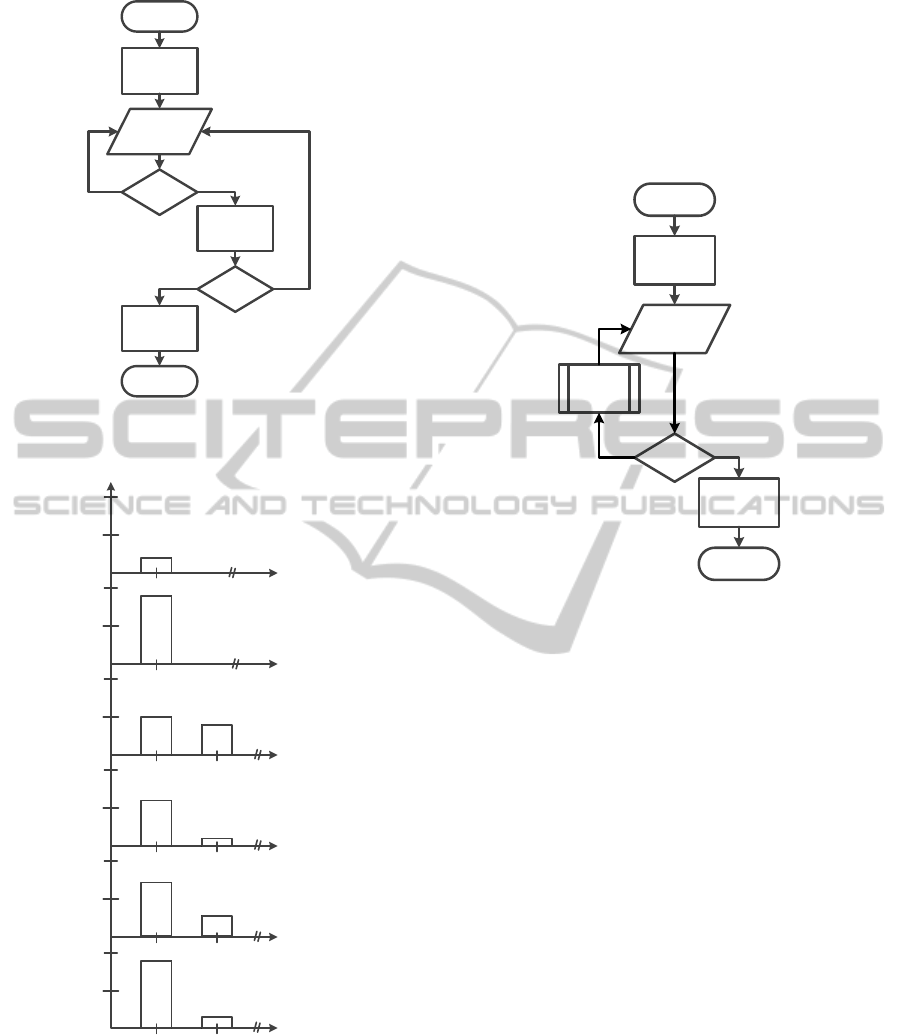
START
END
Fix BER level
BER level +
Bits > 8
Power
Allocation
YES NO
YES NO
Bit
Allocation
P
s
< 1
Figure 11: Iterative Bit-and Power Allocation scheme at a
fixed data rate.
4
4
6
6
2
IBPA fixed data rate
2
2
1
2
6
2
Bit Allocation
layers
1
Bit Allocation
Bit Allocation
BER level +
Bit Allocation
0.5
1
1
2
1
2
1
1
2
2
Equal Remaining
Equal-SNR
1
0.5
1
0.5
1
0.5
1
0.5
1
0.5
P
s μ
Power Distribution
Power Allocation
BER 10
-15
BER 10
-15
BER 10
-6
BER level +
BER 10
-3
layers
layers
layers
layers
layers
Figure 12: Iterative Bit-and Power Allocation at a fixed data
rate.
Because of that the QAM transmission mode becomes
(16,2,0,0) in the third row of the Fig. 14, (32,2,0,0)
in the fourth row, (32,4,0,0) in the fifth, (64,4,0,0)
in the sixth and (128,4,0,0) in the seventh one. In
this moment, because of allocating an extra bit means
exceed the transmit power limit, the definitive QAM
constellation results (128,4, 0,0). Besides, according
to the Fig. 13 and the Fig. 14, PA techniques are ap-
plied. The remaining not allocated power is equally
distributed over the MIMO active layers. And addi-
tionally, an equal-SNR Power Allocation (SNR-PA)
technique for Non-Equal Power Distribution is intro-
duced.
START
END
Fix BER level
Bit
Allocation
P
s
< 1
Power
Allocation
YES NO
Bit level +
Figure 13: Iterative Bit-and Power Allocation scheme with
variable data rate.
4 RESULTS
The investigation described in this paper has analysed
different resource allocation techniques aimed at in-
creasing the degree of design freedom, which largely
affects the bit-error probability performance on cor-
related MIMO communication systems. In general,
thanks to the selection of the most favourable QAM
transmission mode and the optimal transmit power al-
location per active layer the best BER performance
is achieved. Firstly, fixed QAM constellations with
and without equal SNR-PA are analysed and com-
pared to frequency non-selective (4×4) MIMO chan-
nels with weak and strong correlation. Secondly, iter-
ative bit and power allocation set-ups are investigated
and compared with fixed QAM constellation sizes in
order to achieve the optimal resources allocation per-
formance with the minimum bit-error probability.
4.1 Fixed QAM Constellation Sizes
Combined With Equal-SNR PA
Pre-establishing the QAM constellation, depicted on
Tab 2, a fixed data rate is assured per data block (8
PECCS2014-InternationalConferenceonPervasiveandEmbeddedComputingandCommunicationSystems
90
2
4
4 1
5 1
5 2
6 2
BER level
Bit Allocation
Bit Allocation
Bit Allocation
Bit Allocation
Bit Allocation
Bit Allocation
7
2
7
2
7
2
Equal Remaining
Power Distribution
Equal-SNR
Power Allocation
Bit Allocation
Layers
Layers
Layers
Layers
Layers
Layers
Layers
Layers
Layers
Figure 14: Iterative Bit-and Power Allocation with variable
data rate.
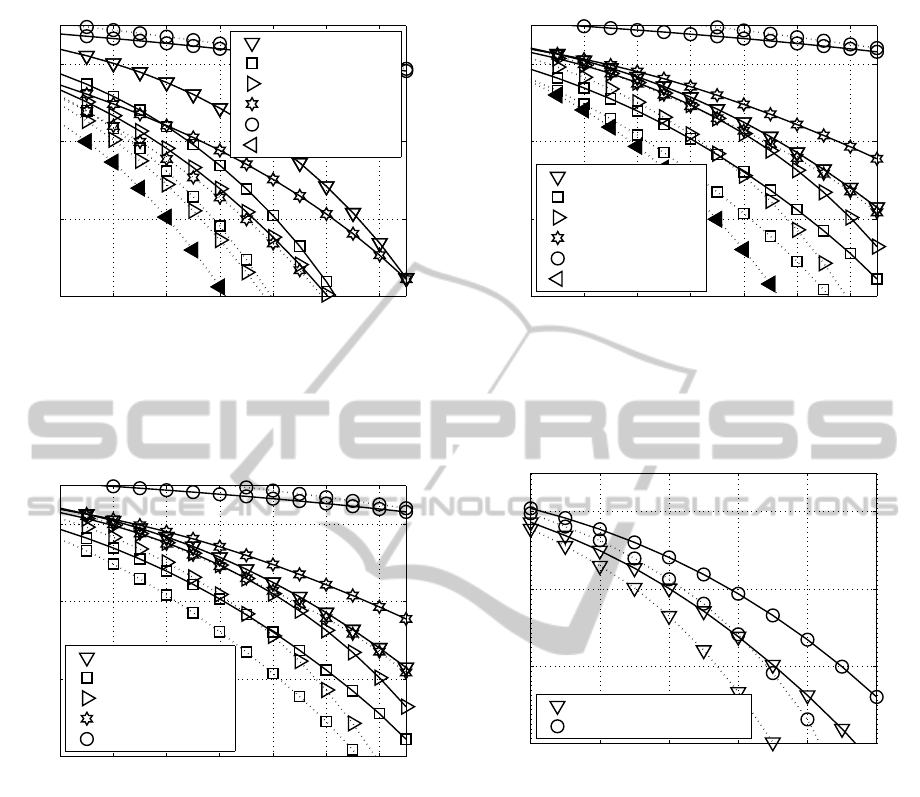
bit/s/Hz). Fig. 15 shows the PDF of the transmis-
sion modes in bold introduced in Tab 2 and trans-
mitting 8 bit/s/Hz over uncorrelated, weak and strong
(channels profiles listed on Tab. 1) frequency non-
selective (4×4) MIMO channels. Here is highlighted
how the correlation effect modifies the QAM trans-
mission mode chosen. The resultant BER curves with
fixed QAM constellation are depicted in Fig. 16 and
Fig. 18 for the two different investigated channel pro-
files from Tab. 1, when transmitting at a bandwidth
efficiency of 8 bit/s/Hz. Here it is highlighted that
not all MIMO layers have to be activated in order
to achieve the best BERs. The target is find out the
best combination of the QAM mode and the number
of MIMO layers, which gives the best possible BER
performance at 8 bit/s/Hz bandwidth efficiency. Sub-
sequently, PA techniques were applied for minimizing
the bit-error probability.
On the other hand, by comparing Fig. 16 and
Fig. 18 the BER increase due to antennas correlation
is noticed.
0
0,2
0,4
0,6
0,8
1,0
Transmission Mode
pdf →
MIMO
WC MIMO
SC MIMO
(64,4,0,0)
(16,16,0, 0)
(16,4,4,0)
Figure 15: PDF (probability density function) of choosing
different transmission modes when using the transmission
modes introduced in Tab. 2 and transmitting 8 bit/s/Hz over
uncorrelated, weak correlated (WC) and strong correlated
(SC) frequency non-selective (4×4) MIMO channels.
12 14 16 18 20 22 24
10
−8
10
−6
10
−4
10
−2
10 ·lg(E
s
/N
0
) (in dB) →
bit-error rate →
(256,0,0, 0) QAM
(64,4,0,0) QAM
(16,16,0, 0) QAM
(16,4,4,0) QAM
(4,4,4,4) QAM
Figure 16: BER with equal-SNR PA (dotted line) and with-
out PA (solid line) when using the transmission modes in-
troduced in Tab. 2 and transmitting 8 bit/s/Hz over fre-
quency non-selective (4 ×4) MIMO channels under weak
antenna correlation.
IterativeBit-andPowerAllocationinCorrelatedMIMOSystems
91
12 14 16 18 20 22 24
10
−8
10
−6
10
−4
10
−2
10 ·lg(E
s
/N
0
) (in dB) →
bit-error rate →
(256,0,0, 0) QAM
(64,4,0,0) QAM
(16,16,0, 0) QAM
(16,4,4,0) QAM
(4,4,4,4) QAM
IBPA, fixed data rate
Figure 17: BER with equal-SNR PA (dotted line) and with-
out PA (solid line) when using the transmission modes in-
troduced in Tab. 2 and transmitting 8 bit/s/Hz over fre-
quency non-selective (4×4) MIMO channels under weak
antenna correlation.
12 14 16 18 20 22 24
10
−8
10
−6
10
−4
10
−2
10 ·lg(E
s
/N
0
) (in dB) →
bit-error rate →
(256,0,0, 0) QAM
(64,4,0,0) QAM
(16,16,0, 0) QAM
(16,4,4,0) QAM
(4,4,4,4) QAM
Figure 18: BER with equal-SNR PA (dotted line) and with-
out PA (solid line) when using the transmission modes in-
troduced in Tab. 2 and transmitting 8 bit/s/Hz over fre-
quency non-selective (4×4) MIMO channels under strong
antenna correlation.
4.2 IBPA Combined With Equal-SNR
PA
Due to the QAM transmission modes are previously
defined in the fixed QAM constellation approach,
some kind of rigidity in terms of resource allocation is
introduced. In order to increase the degree of freedom
in the MIMO performance design, iterative bit alloca-
tion with adaptive QAM constellation sizes per time
slot is developed in this contribution. Furthermore,
a optimal transmit power allocation with equal-SNR
not uniformly distributed per active layers is used for
minimizing the overall BER.
From Tab. 4 it is possible to compare the effect of
12 14 16 18 20 22 24
10
−8
10
−6
10
−4
10
−2
10 ·lg(E
s
/N
0
) (in dB) →
bit-error rate →
(256,0,0, 0) QAM
(64,4,0,0) QAM
(16,16,0, 0) QAM
(16,4,4,0) QAM
(4,4,4,4) QAM
IBPA, fixed data rate
Figure 19: BER with equal-SNR PA (dotted line) and with-
out PA (solid line) when using the transmission modes in-
troduced in Tab. 2 and transmitting 8 bit/s/Hz over fre-
quency non-selective (4×4) MIMO channels under strong
antenna correlation.
10 12 14 16 18 20
10
−8
10
−6
10
−4
10
−2
10 ·log
10
(E
s
/N
0
) (in dB) →
bit-error rate →
uncorrelated MIMO
strongly correlated MIMO
Figure 20: BER based IBPA at a fixed data rate (solid line)
and at variable data rate (dotted line) when transmitting an
average data throughput of 8 bit/s/Hz over frequency non-
selective (4×4) MIMO channels with and without antenna
correlation.
the investigated correlated channel profiles listed in
Tab. 3 over BER performance in (4 ×4) MIMO sys-
tem with IBPA fixed data rate. Due to the increasing
correlation effect from CM-1 to CM-2, the bit-error
probability increases.
The resultant BER curves are depicted in Fig. 17
and Fig. 19 when transmitting at 8 bit/s/Hz using
the iterative bit and power allocation algorithm pre-
viously described. Comparing the IBPA fixed data
rate BER curves, in both investigated channels pro-
files weak and strong correlated, it is possible to show
the significant BER performance improvement com-
pared with the fixed QAM constellation sizes after ap-
plying optimal resources allocation techniques.
The constraint in the investigated IBPA algorithm
PECCS2014-InternationalConferenceonPervasiveandEmbeddedComputingandCommunicationSystems
92

Table 4: Investigated channel profiles assuming a
(4 × 4) MIMO system with IBPA fixed data rate at
10log
10
(E
s
/N
0
) = 20 dB.
Profile bit/s/Hz QAM TM BER
CM-1 8 (64,4,0,0) 1.6·10
−4
CM-2 8 (64,4,0,0) 1.8·10
−4
concerning to the requirement of fixed data rate at
a given bit/s/Hz per time slot can be modified for a
variable data rate approach where the given bit/s/Hz
in average is assured with the aim to improve the
overall BER performance. From Tab. 5 it is possi-
ble to compare the effect of the investigated correlated
channel profiles, listed on Tab. 3, over BER perfor-
mance in (4 ×4) MIMO system with IBPA variable
data rate. Depending on the transmitting number of
bits the QAM transmission mode is modified. The
higher the transmit data rate the higher the BER per-
formance.
Fig. 20 shows the comparison between MIMO
system performances when using fixed and variable
data rate when transmitting an average data through-
put of 8 bit/s/Hz over frequency non-selective (4×4)
MIMO channels with and without antenna correla-
tion. As highlighted by the BER curves, from the
variable data rate schema a noticeable better BER per-
formance is obtained.
Table 5: Investigated channel profiles assuming a (4 ×
4) MIMO system with IBPA variable data rate at
10log
10
(E
s
/N
0
) = 20 dB.
Profile bit/s/Hz QAM TM BER
CM-1 7 (32,4,0,0) 1.4 ·10
−6
CM-1 8 (32,4,2,0) 3.2 ·10
−5
CM-1 12 (64,16,4, 0) 7.2·10
−3
CM-2 7 (32,4,0,0) 5.8 ·10
−6
CM-2 8 (64,4,0,0) 1.8 ·10
−4
CM-2 9 (128,4, 0,0) 2.5 ·10
−3
5 CONCLUSIONS
The chance to design and determine the number of ac-
tive MIMO layers, the number of the overall data rate,
the QAM modulation schema per layer and per time
slot and all combined with the appropriate allocation
technique of the transmit power can remarkably im-
provethe performanceof a correlated MIMO commu-
nication system. In this work a noteworthy BER per-
formance improvement has been accomplished by us-
ing optimal bit and power allocation techniques based
on iterative allocation methods over frequency non-
selective (4 × 4) MIMO channels with and without
antenna correlation. Additionally, in order to develop
these iterative power allocation algorithms (due to the
transmit power is not uniformly distributed over ac-
tive layers any longer) a new approach of suboptimal
power allocation parameter p
(ℓ,k)
IBPA
has been perfected
from the previous uniformly distributed power param-
eter p
(ℓ,k)
.
REFERENCES
Ahrens, A., Cano-Broncano, F., and Benavente-Peces, C.
(2013). Power Distribution for SVD-aided MIMO
Transmission with Receiver-Side Antennas Correla-
tion. In 10th IASTED International Conference on
Signal Processing, Pattern Recognition, and Applica-
tions (SPPRA), Innsbruck (Austria).
Ahrens, A., K¨uhn, V., and Weber, T. (2008). Iterative De-
tection for Spatial Multiplexing with Adaptive Power
Allocation. In 7th International Conference on Source
and Channel Coding (SCC), Ulm (Germany).
Cano-Broncano, F., Benavente-Peces, C., Ahrens, A., Or-
tega, F., and Pardo, J. (2012). Analysis of MIMO
Systems with Antennas Correlation with Linear and
Non-linear Spatial Distribution. In International Con-
ference on Pervasive and Embedded Computing and
Communication Systems (PECCS), pages 278–283,
Rome (Italy).
Goldfeld (2002). Systems BER Power Loading for OFDM
in Fading Channel. IEEE Transactions on Communi-
cations, 50:1729–1733.
Krongold, B., Ramchandran, K., and Jones, D. (2000).
Computationally Efficient Optimal Power Allocation
Algorithm for Multicarrier Communication Systems.
IEEE Transactions on Communications, 48:23–27.
Weng, C.-C., Chen, C.-Y., and Vaidyanathan, P. (2010).
MIMO Tranceivers with Decision Feedback and Bit
Loading: Theory and Optimization. IEEE Transac-
tions on Signal Processing, 58:1334–1346.
Yang, P., Xiao, Y., Yu, Y., and Li, S. (2011). Adaptive
Spatial Modulation for Wireless MIMO Transmission
Systems. IEEE Communications Letters, 15:602–604.
Zheng, L., Stuber, G., Wang, D., and Cao, Y. (2013). Dy-
namic Bound Restriction Iterative Algorithm Frame-
work and Application to Power and Bit Allocation in
OFDM Systems. IEEE Transactions on Communica-
tions, 61:1160–1170.
Zhou, Z., Vucetic, B., Dohler, M., and Li, Y. (2005). MIMO
Systems with Adaptive Modulation. IEEE Transac-
tions on Vehicular Technology, 54:1828 – 1842.
IterativeBit-andPowerAllocationinCorrelatedMIMOSystems
93
