
The Effect of Filtering on the OSNR
For a 40- and 100 Gb/s DWDM System
Morad Khosravi Eghbal
Photonics Laboratory, Department of Microtechnology and Nanoscience MC2,
Chalmers University of Technology, SE-412 96, Gothenburg, Sweden
Keywords: 100 Gb/s DP-QPSK, 40 Gb/s DPSK, OSNR, BER.
Abstract: Quality measures like Bit Error Rate (BER) and Optical Signal to Noise Ratio (OSNR) are important
indicators for verifying the quality of a received signal in the optical fiber communication. Different
components like Wavelength Selective Switches and Optical Interleaver Units used in a Dense Wavelength
Division Multiplexed network can decrease the operating bandwidth. This work investigates the effect of
bandwidth narrowing on the OSNR value in an optical fiber link.
1 INTRODUCTION
One of the advantages of high bit rates like 40- and
100 Gb/s in fiber optical communication is
increasing the bandwidth efficiency. This leads to an
increased capacity that is a key factor for a number
of bandwidth-demanding services. However, service
providers have widely invested in 10 Gb/s.
Therefore, it would be too costly to build new
infrastructures for higher bitrates while they
technically keep losing what they have spent in the
legacy bit rate. As a result, it is much more
affordable to use existing structure to transmit higher
bit rates systems. Birk et al. (2010:2-3) discussed
about coexistence of 10 Gb/s OOK and 40 Gb/s
DPSK with 100 Gb/s DP-QPSK in a 900 Km fiber
link. The filtering effect of Wavelength Selective
Switch (WSS) in the ROADMs at 10, 40 and 100
Gb/s have been presented in the literature.
(Heismann, F., Collings, B. and Reimer, C., 2009:2-
3; Zhang et al., 2010:2-3; Nelson et al. 2011;
Pinceman et al., 2011:2; Birk et al., 2011:1-2;
Heismann 2010). Also Mikkelsen et al. (2006:1)
have demonstrated the filtering effect of interleaver
units on a 40 Gb/s DPSK system.
The purpose of the work described in this paper
is to evaluate the destructing effect of narrowing the
bandwidth on OSNR value for a BER of 1.0E-12 for
40 Gb/s and 100 Gb/s .Signal bandwidth becomes
narrower when it passes through components that
have bandwidth smaller than that of 40 Gb/s and 100
Gb/s signals. For this work, these components are
Multiplexer/Demultiplexer units, Wavelength
Selective Switch, Optical Interleaver Unit and
finally Wavelength-Blocker. The 40 Gb/s (33%
Return-to-Zero) DPSK pseudorandom bit sequence
(PRBS) data stream in the C-band and 100 Gb/s DP-
QPSK optical signal transmitted in a network that
has been designed for 10 Gb/s OOK optical signals.
Because of the nature of higher bitrate signals, their
bandwidth is wider (compared to 10 Gb/s
signal).Various components like ROADMs,
interleaver units and filters have a tightening effect
on the effective bandwidth according to their active
bandwidth. This imposes a penalty on the quality of
the received signal. Such penalties are investigated
and the components which impose the tightest
filtration on the bandwidth are presented.
2 EXPERIMENTAL SETUP
The link shown in figure 1 is established for the
OSNR measurements. The input signals are
generated by a) 40 Gb/s NRZ-DPSK 300-pin MSA
transceiver with 191.70 to 196.10 THz C-band
frequency range on 50 GHz ITU grid and 38 GHz
spectrum width (3-dB Band width) and b) 100 Gb/s
PM-QPSK CFP 100 GbE with 191.70 to 196.10
THz C-band frequency range on 50 GHz ITU grid.
The frequency of the signal has been chosen as
193975 THz as it is in the middle of C-Band to
97
Khosravi Eghbal M..
The Effect of Filtering on the OSNR - For a 40- and 100 Gb/s DWDM System.
DOI: 10.5220/0004714000970101
In Proceedings of 2nd International Conference on Photonics, Optics and Laser Technology (PHOTOPTICS-2014), pages 97-101
ISBN: 978-989-758-008-6
Copyright
c
2014 SCITEPRESS (Science and Technology Publications, Lda.)
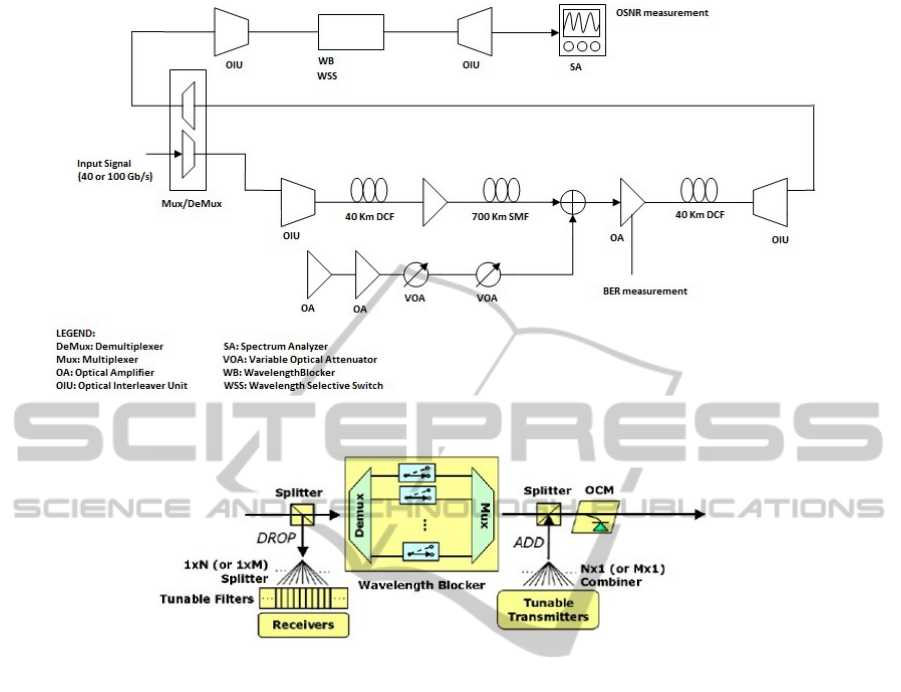
Figure 1: BER vs. OSNR measurement setup.
Figure 2: Wavelength Blocker schematic block diagram.
maintain a moderate response. The optical signal is
initiated from a multiplexer and propagates in the
link depicted in figure 1.It passes through a number
of optical amplifiers, variable optical attenuators and
a 700 Km single mode fiber; reaches the
demultiplexer and is directed to a number of
components to verify the filtering effect. Finally a
spectrum analyzer measures the OSNR of the signal.
Thus the BER of the signal is measured in the last
optical amplifier stage along the link and OSNR at
the end of the link. Those components that cause the
bandwidth to be narrowed are Optical Interleaver
units, ROADM’s Wavelength Selective Switch and
a Wavelength-Blocker unit (figure 2).
The components that determined the filtration
were cascaded interleaver units with a) WSS and b)
Wavelength-Blocker.
3 RESULTS AND ANALYSIS
The unfiltered spectrum of both 40 and 100 Gb/s
signals are depicted in figure 3. The green line
shows the 3-dB reference and by that, 3-dB
bandwidth can be calculated as ~33 GHz for 40 Gb/s
and ~27 GHz for 100 Gb/s signals.
Also the Bandwidth of components (OIU+MUX,
WSS and Wavelength-Blocker) are shown in figure
4. Figure 5 gives a clearer view of the different
bandwidth arrangements of the Wavelength-
Blocker, from 50 GHz down to 20 GHz.
The BER versus OSNR curve of 40 Gb/s signal
passing through the network illustrated in figure 1 is
shown in figure 6. The OSNR level is degraded for
filtering tighter than 33 GHz. The OSNR penalty at
tight filtration is about 2 dB. The reason is that some
significant portion of the signal (unfiltered
bandwidth equal to 33 GHz) is cut that leads to an
increase in the BER and degradation of the OSNR.
For 100 Gb/s, the BER versus OSNR curve is
shown in figure 7 .It can be seen that filtering even
as tight as 32 GHz has a negligible effect on the
OSNR levels.
There is a very small penalty in the BER when
decreasing the filter bandwidth from 46 GHz down
to 30 GHz. This penalty is illustrated in figure 8.
PHOTOPTICS2014-InternationalConferenceonPhotonics,OpticsandLaserTechnology
98
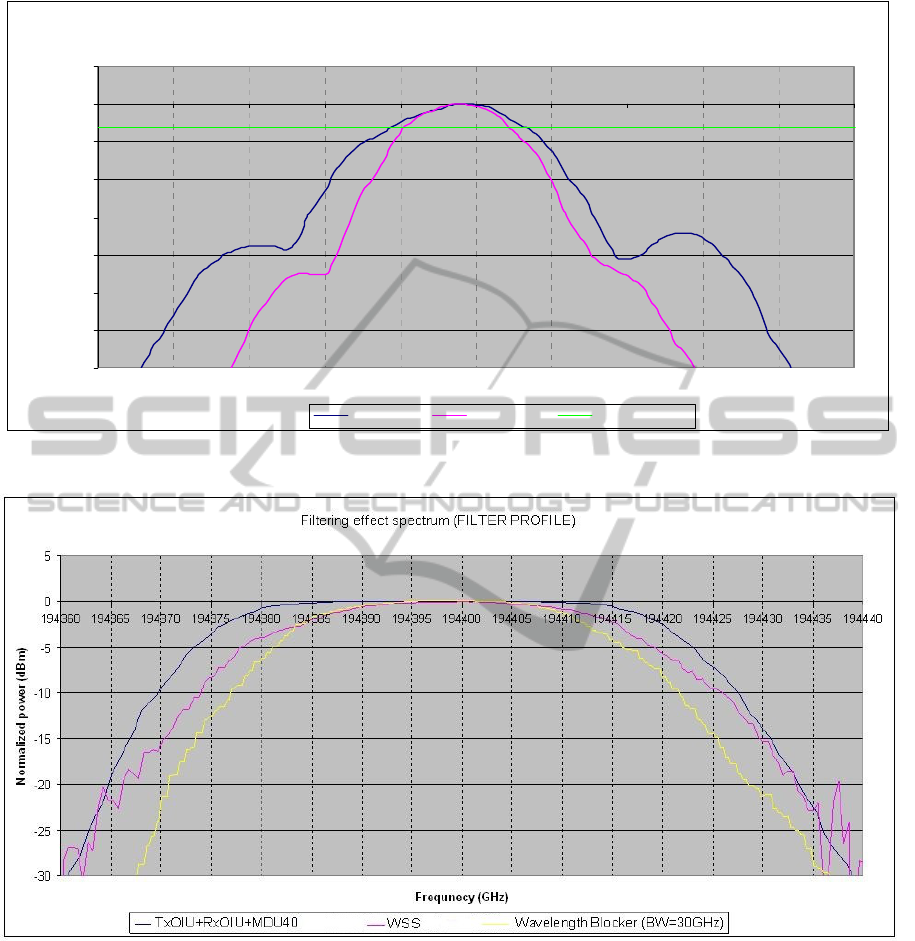
Figure 3: Unfiltered 40 G and 100 G signal spectrum.
Figure 4: Various components’ filtering profiles.
The Wavelength-Blocker’s bandwidth decrease
is stepwise, therefore the next bandwidth setting is
26 GHz which is smaller than ~28 GHz (unfiltered
bandwidth of 100 Gb/s signal) so the signal is lost
with filtration tighter than 30 GHz and no BER can
be achieved for this filtration.
4 CONCLUSIONS
It is demonstrated that tight filtering imposes a
penalty of around 2 dB for 40 Gb/s but it is less than
1 dB for 100 Gb/s. This is because 40 Gb/s signal
has wider spectrum than 100 Gb/s. The highest
penalty is for the wavelength-Blocker that has a 30
GHz bandwidth.
There is very small BER penalty for 100 Gb/s
Unfiltered signal spectrum comparison (40G vs. 100G)
-35,00
-30,00
-25,00
-20,00
-15,00
-10,00
-5,00
0,00
5,00
193880 193900 193920 193940 193960 193980 194000 194020 194040 194060 194080
Fr e que n cy ( GHz)
Power (dBm)
No f ilter-40G No f ilter-100G 3-dB BandWidth
TheEffectofFilteringontheOSNR-Fora40-and100Gb/sDWDMSystem
99
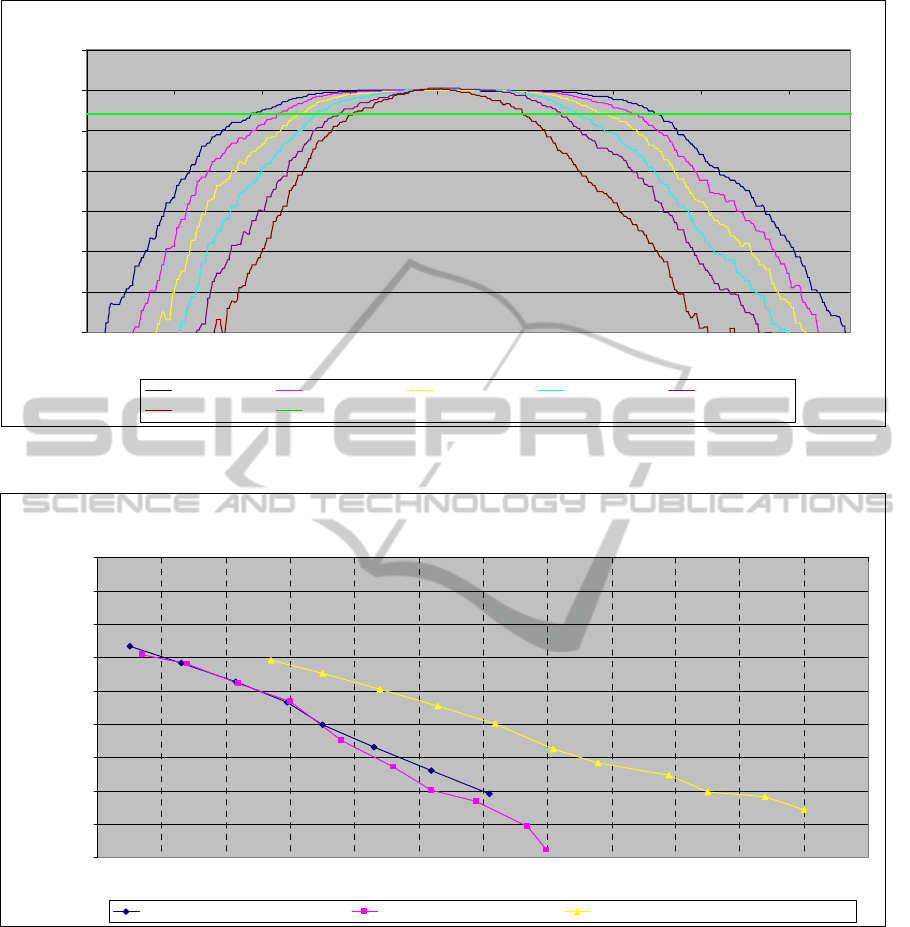
Figure 5: Wavelength-Blocker’s filtering profile from 50 GHz down to 20 GHz.
Figure 6: BER vs. OSNR for filtered 40 G signal.
signal when its bandwidth decreases from 46 GHz to
30 GHz (loss of signal limit).
ACKNOWLEDGMENTS
This work has been funded by and performed in
Transmode Systems AB, Stockholm, Sweden. The
Author would like to acknowledge the technical
assistance of the staff at the R&D department.
REFERENCES
Birk, M., et al., 2010. Field trial of a real-time, single.
wavelength, coherent 100 Gbit/s PM-QPSK channel
upgrade of an installed 1800km link. OFC/NFOEC,
PDPD1.
Heismann, F., Collings, B. and Reimer, C., 2009.
Dependence of the Transmission Impairment on the
WSS Port Isolation Spectral Profile in 50GHz
ROADM Networks with 43Gb/s NRZ-ADPSK
Signals. OFC/NOFOEC, OThJ3.
Filter spectrum for wavelengthBlocker
-30,00
-25,00
-20,00
-15,00
-10,00
-5,00
0,00
5,00
193935 193945 193955 193965 193975 193985 193995 194005 194015
Fr e que nc y ( GHz )
Power (dBm)
Filter BW 50GHz Filter BW 44GHz Filter BW 38GHz Filter BW 32GHz Filter BW 26GHz
Filter BW 20GHz 3-dB BandWidth
BER vs. OSNR for filtered 40 G signal
1,00E-09
1,00E-08
1,00E-07
1,00E-06
1,00E-05
1,00E-04
1,00E-03
1,00E-02
1,00E-01
1,00E+00
12 13 14 15 16 17 18 19 20 21 22 23 24
OSNR (dB)
BER
40 G signal ( interleaver + interleaver) 40 G signal ( interleaver + WSS) 40 G signal ( interleaver + filter (BW=30 GHz))
PHOTOPTICS2014-InternationalConferenceonPhotonics,OpticsandLaserTechnology
100
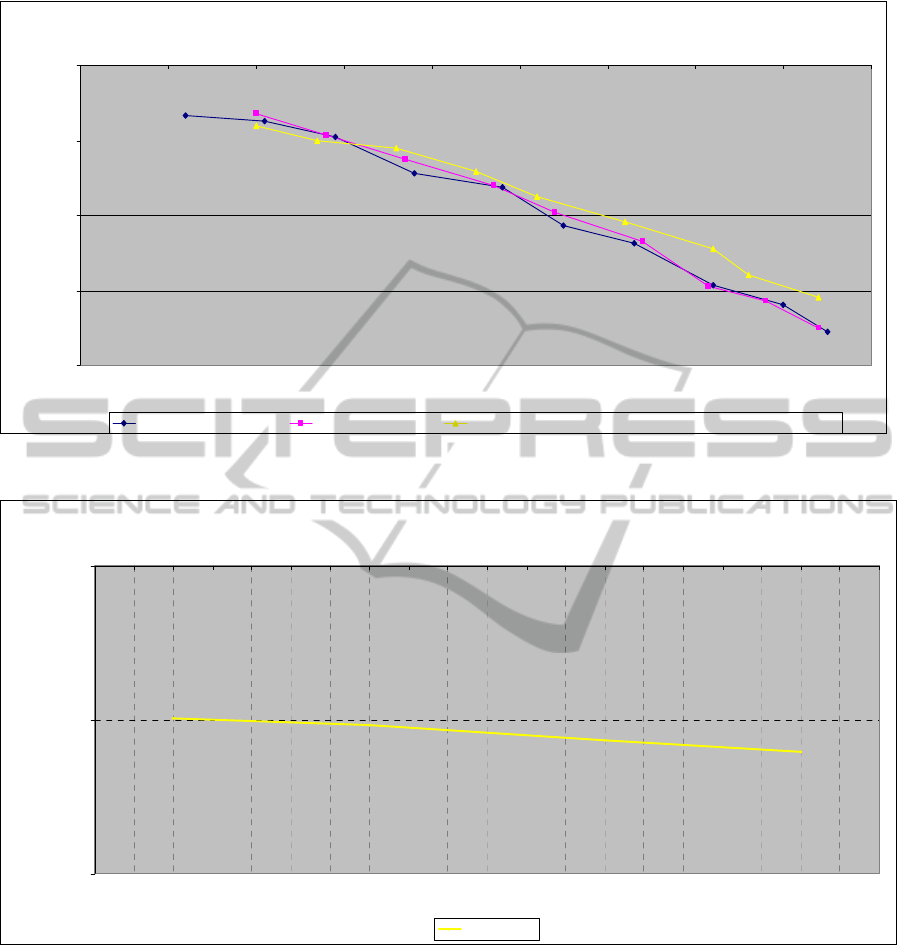
Figure 7: BER vs. OSNR for filtered 100 G signal.
Figure 8: BER penalty for decreasing BW from 46 GHz to 30 GHz.
Zhang, B., et al., 2010. Penalty-Free Transmission of 127-
Gb/s Coherent PM-QPSK over 1500-km of NDSF
with 10 Cascaded 50-GHz ROADMs. OFC/NFOEC,
NTuC5.
Nelson, L., et al., 2011. 100Gb/s dual-carrier DP-QPSK
performance after WDM transmission including
50GHz Wavelength Selective Switches. OFC/NFOEC,
NWA2.
Pinceman, E., et al., 2011. ‘Challenges of 40/100 Gbps
and higher-rate deployments over long-haul transport
networks’. Optical Fiber Technology vol. 17 (2011)
pp.335–362.
Birk, M., et al., 2011. ‘Real-Time Single-Carrier Coherent
100 Gb/s PM-QPSK Field Trial’. Journal of
Lightwave Technology, vol. 29, no. 4, pp. 417-425.
Heismann, F., 2010. System Requirements for WSS Filter
Shape in Cascaded ROADM Networks. JDS Uniphase
Corporation August 2010.
Mikkelsen, B., et al., 2006. ‘Partial DPSK with excellent
filter tolerance and OSNR sensitivity’. Electronics
Letters, vol. 42, no. 23, pp. 1363-1364.
BER vs. OSNR for filtered 100 G signal
1,00E-05
1,00E-04
1,00E-03
1,00E-02
1,00E-01
11 12 13 14 15 16 17 18 19 20
OSNR (dB)
BER
100 G (interleaver + interleaver) 100 G (interleaver + WSS) 100 G (interleaver + WavelengthBlocker with 32 GHz BW (ChannelNarrow=9))
100 G BER for decreasing BW (46 GHz to 30 GHz)
1,00E-08
1,00E-07
1,00E-06
28 29 30 31 32 33 34 35 36 37 38 39 40 41 42 43 44 45 46 47 48
BW (GHz)
BER
BER vs. BW
TheEffectofFilteringontheOSNR-Fora40-and100Gb/sDWDMSystem
101
