Model Adaptation via MAP for Speech Recognition in Noisy
Environments
Tatiane Melo Vital and Carlos Alberto Ynoguti
Instituto Nacional de Telecomunicações, Av. João de Camargo, 510, Santa Rita do Sapucaí-MG, Brazil
Keywords: Robust Speech Recognition, HMM, Model Compensation, MAP.
Abstract: The accuracy of speech recognition systems degrades severely when operating in noisy environments,
mainly due to the mismatch between training and testing environmental conditions. The use of noise
corrupted training utterances is being used with success in many works. However, as the type and intensity
of the noise at operation time is unpredictable, the present work proposes a step beyond: the use of the MAP
method to use samples of the actual audio signal that is being processed to adapt such systems to the real
noise condition. Experimental results show an increase of almost 2% on average in the recognition rates,
when compared to systems trained with noisy utterances.
1 INTRODUCTION
A fundamental question for the automatic speech
recognition area is noise robustness: after decades of
research this is still a big challenge (Furui, 2007).
One of the reasons for this poor performance is the
mismatch between the environments in which the
training utterances were acquired and the one in
which recognition systems operate. Under such
conditions, humans perform far better in the task of
speech recognition when compared to automatic
systems. This issue is especially important as this
technology is being more and more incorporated into
mobile devices.
Several approaches have been proposed in the
literature to tackle this question. In rough, they can
be divided into one of the three classes shown below
(Grimm and Kroschel, 2007):
Robust Utterance Representation: if the utterance
is represented by a parameterization scheme that is
little affected by noise, it can be assumed that the
mismatch between the training and testing
conditions do not differ substantially. The goal
here is to look for speech characteristics that are
relatively immune to noise. One common
assumption for these methods is that the speech
signal is independent of noise. Among the
techniques that use this method, we can cite:
cepstral filtering (liftering), auditive model based
methods; cepstrum in mel scale, discriminative
parameterizations, slow variation removal and time
derivative parameters (delta and delta-delta);
Compensation of Noisy Utterance: the goal is to
reduce the noise captured by the acquisition
system and use a system trained with clean
utterances. Parameter mapping, spectral
subtraction, statistical improvement and clean
speech model compensation are some of the
techniques that belong to this class;
Model Adaptation: in this case, the recognition
system parameters are adapted to the actual noise
condition of the utterance being processed. Some
of the methods that use this approach are: HMM
decomposition, state dependent Wiener filtering
and statistical HMM adaptation.
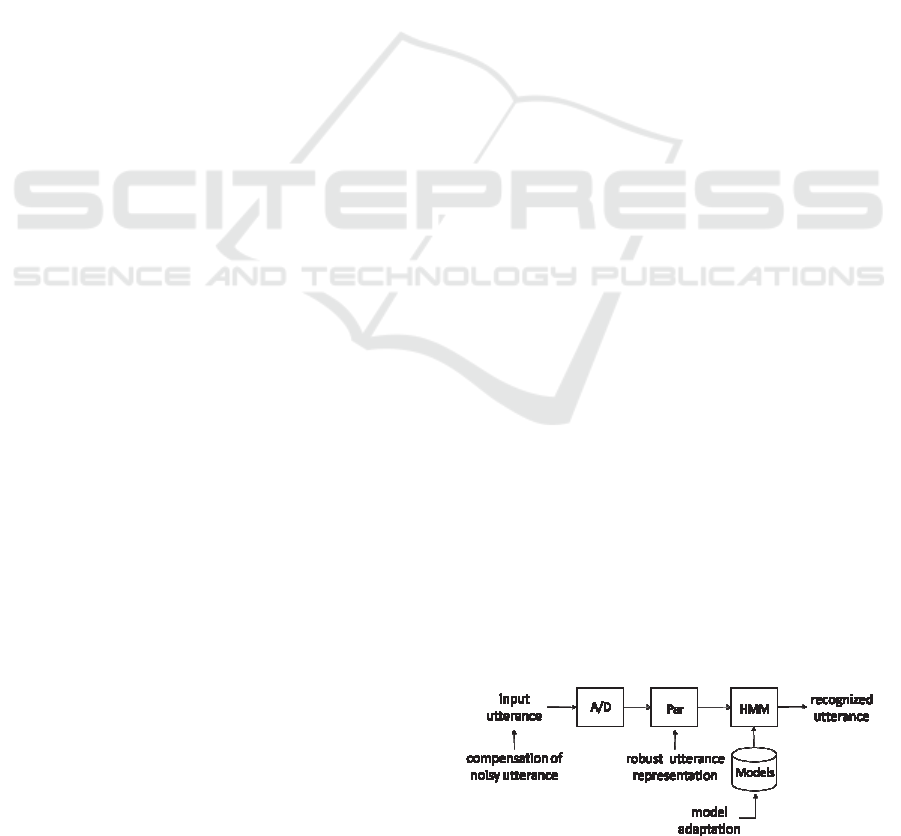
Figure 1: Compensation of noisy utterance techniques
focus on the incoming speech signal; on the other hand,
robust utterance representation techniques act on the
acoustic parameter extraction block; finally, model
adaptation techniques try to modify the parameters of the
acoustic models to improve the system performance under
noisy conditions.
91
Melo Vital T. and Alberto Ynoguti C..
Model Adaptation via MAP for Speech Recognition in Noisy Environments.
DOI: 10.5220/0004718400910096
In Proceedings of the International Conference on Bio-inspired Systems and Signal Processing (BIOSIGNALS-2014), pages 91-96
ISBN: 978-989-758-011-6
Copyright
c
2014 SCITEPRESS (Science and Technology Publications, Lda.)

Figure 1 shows a schematic view of where each
of these methods actuate.
This work proposes the use of the MAP
(Maximum a Posteriori) method to adapt the
parameters of a continuous density HMM system to
improve the overall performance for the actual noise
that is corrupting the utterance being recognized.
Therefore, this method falls in the third category:
model adaptation.
The MAP method is briefly described in the next
section.
2 MODEL ADAPTATION USING
MAP
Instead of hypothesizing the transformation form
that represents the differences between the training
and testing acoustic environments, it is possible to
use statistical approaches to obtain it. A common
one is the maximum a posteriori (MAP), sometimes
known as Bayesian adaptation. This technique was
successfully used for the speaker recognition task
(Reynolds, 2003), where a canonical model is
generated from several speakers; the specific model
for each individual speaker can then be generated
from this canonical model using only a few training
data.
In the present work, the canonical model is
represented by a continuous density HMM already
trained with noisy utterances, and transformations
are used to adapt this canonical model to the actual
noise condition of the utterance being recognized.
The MAP adaptation is a two step estimation
process. In the first step estimates of the sufficient
statistics of the noise sample are computed for each
mixture. In the second step, these new sufficient
statistic estimates are used to adapt the canonical
model parameters.
For each state of an HMM there is an associated
stochastic process that models the symbol emission.
For the continuous density HMMs the most common
approach is to use a mixture of M Gaussian
densities, each one of dimension d. Each mixture
component is characterized by a weight coefficient
w
i
, a mean vector
i
and a covariance matrix
i
2
.
If it is assumed that the d dimensions are
independent from each other, the covariance matrix
assumes a diagonal form. Therefore, it can be
represented as a vector instead of a matrix. This
simplification is very common in the literature and it
was used in the present work.
Next, the mathematical MAP adaptation
modelling is presented.
Let
T
xxxX
,,,
21
be an observation sequence.
The conditional probability of the Gaussian i given
this observation sequence is
M
j
t
x
j
p
j
w
t
x
i
p
i
w
t
xiP
1
)(
)(
)|(
(1)
where p(i|x
t
) is the value of the Gaussian density i at
point x
t
.
With this result, the sufficient statistics, the
weight (n
i
), the mean vector (E
i
(x)) and the power of
this noise sample (E
i
(x
2
)) can be calculated as
follows:
T
t
t
xiP
i
n
1
)|(
(2)
t
x
T
t
t
xiP
i
n
x
i
E
1
)|(
1
)(
(3)
2
1
)|(
1
)
2
(
t
x
T
t
t
xiP
i
n
x
i
E
(4)
Finally, these statistics are used to update the
canonical model parameters, creating the adapted
parameters for the i-th Gaussian density:
i
w
w
i
T
i
n
w
ii
w )1(
ˆ
(5)
i
m
i
x
i
E
m
ii
)1()(
ˆ
(6)
2
ˆ
)
22
)(1()
2
(
2
ˆ
iiii
x
i
E
ii
(7)
where the adaptation coefficients
i
w
,
i
m
and
i
that control the balance between the old and new
estimates for weights, means and variances,
respectively, are positive numbers in the (0,1) range.
Observe that the adapted model is a linear
combination of noise statistics and canonical model.
The contribution of each one of these models for the
final model depends on the parameter
i: larger
values of
i
emphasize the noise statistics, while
smaller values do not significantly modify the
canonical model. Thus, the choice of an appropriate
value for this parameter is fundamental for the
adapted system overall performance.
3 EXPERIMENTAL APPARATUS
In this section, the database and the recognition
BIOSIGNALS2014-InternationalConferenceonBio-inspiredSystemsandSignalProcessing
92
engine are described.
3.1 Database
As the focus of this work is on the quantification of
the performance difference due to the acoustic
mismatch between training and testing materials,
two databases were used: a clean speech database
and a noise only database. With this arrangement it
is possible to precisely control the type and amount
of noise to be added in each situation. These two
databases are described in the sequel.
3.1.1 Clean Speech Corpus
The speech corpus comprises 40 adult speakers (20
male and 20 female) (Ynoguti, 1999). Each of these
speakers recorded 40 phonetically balanced
sentences in Brazilian Portuguese. Therefore, this
corpus has 1600 utterances. 30 speakers (15 of each
gender) were used to train the systems (1200
utterances) and remaining ones were selected for the
performance tests (400 utterances).
The sentences were drawn from (Alcaim,
Solewicz and Moraes, 1992) and comprise 694
different words. Thus, this database was built for
continuous speech recognition with speaker
independence, for a medium vocabulary.
All the utterances were manually transcribed
using a set of 36 phonemes. The recordings were
performed in a low noise environment, with 11025
Hz sampling rate and coded with 16 bit linear PCM
per sample. For this work, the sampling frequency
was lowered to 8 kHz because the noise database
was acquired at this rate.
3.1.2 Noisy Speech Corpus
To generate the noise corrupted versions of the
speech utterances, the Aurora Database (Pearce and
Hirsch, 2000) noises were used. This database is
actually a noise corrupted speech corpus, but it also
provides recordings of the noises alone.
The available noise types are: airport, exposition,
restaurant, street, subway, train, babble and car. All
noise types were used to train the system. From
these, only car noise type was used to evaluate the
performance of the system in order to reduce the
total simulation time. For each clean utterance of the
training speech corpus, 8 noise corrupted versions
were created, combining each noise type with
signal-to-noise ratios of 15 and 20 dB. Therefore,
the noise corrupted training speech corpus has now
1200 clean speech recordings × 8 noise types × 2
SNR levels = 19200 utterances. Similarly, for each
clean utterance of the testing speech corpus, 1 noise
corrupted version was created, combining a noise
type with signal-to-noise ratios from 0 to 20 dB,
with steps of 1 dB. Therefore, the noise corrupted
testing speech corpus has now 400 clean speech
recordings ×21 SNR levels = 8400 utterances.
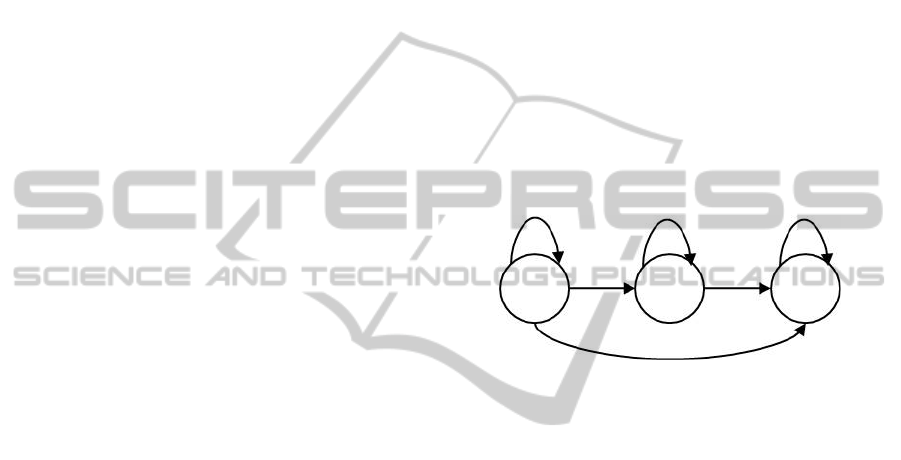
3.1.3 Speech Recognition Engine
A continuous density HMM based recognition
engine developed by (Ynoguti and Violaro, 2000)
was used for the tests. This system uses the One Pass
(Ney, 1984) search algorithm and context
independent phones as fundamental units where
each one of them was modeled with a 3 state
Markov chain as shown in Figure 2. For each HMM
state, a mixture of 10 multidimensional Gaussian
distributions with diagonal covariance matrix was
used.
Figure 2: Markov chain for each phone model.
As acoustic parameters, 12 mel-cepstral coefficients,
together with their first and second derivatives were
used. Therefore, the feature vectors have dimension
36.
Finally, a bigram language model was used to
improve the recognition rates.
These choices were chosen based on previous
tests (Ynoguti and Violaro, 2000).
3.2 Performance Evaluation Method
The recognition performance can be determined by
comparing the hypothesis transcription (recognized
by the speech recognizer) with the reference
transcription (correct sentence).
There are different metrics that are used to
evaluate the performance of an automatic speech
recognition system, being the following the most
common:
Sentence error rate: number of correctly
recognized sentences divided by the total number
of sentences;
Word error rate: for this metric, the word
sequences are compared using a dynamic
alignment algorithm based on word chains in order
to find the deletion (D), substitution (S) and
ModelAdaptationviaMAPforSpeechRecognitioninNoisyEnvironments
93
insertion (I) errors. The word error rate (WER) is
then calculated as follows:
%100*
)(
N
ISD
WER
(8)
where N is the number of word in the reference
transcription.
The second approach was used in this work. The
Sclite tool (NIST, 2011) was used to evaluate the
system performance. Instead of WER, it provides the
word recognition rate that is simply (100 - WER) %.
It is important to note that if the WER is too high
(mainly due a large number of insertion errors), the
word accuracy can assume negative values. It is
sometimes observed when recognizing utterances
that are severely corrupted by noise.
4 RESULTS
To test our hypotheses 3 tests were performed:
System trained with clean speech and tested with
noisy utterances (baseline);
System trained with noisy speech and tested with
noisy utterances;
System trained with noisy speech, adapted for the
actual noise of the utterance being recognized.
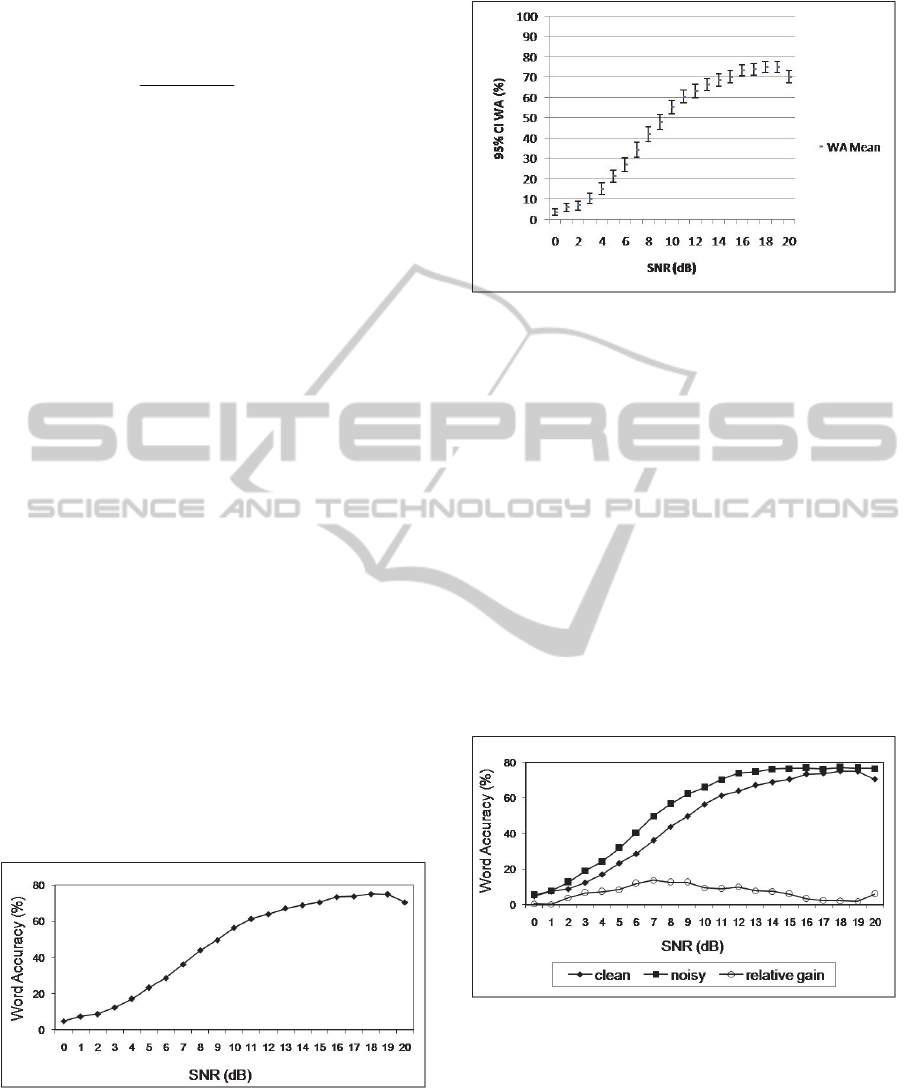
4.1 System Trained with Clean Speech
The baseline performance was established with a
system trained only with clean speech. This system
achieved a word accuracy of 75.6 % when tested
with clean utterances. However, this performance
dropped dramatically when tested with corrupted
utterances, as shown in Figure 3.
Figure 3: Recognition rates for a system trained with clean
speech and tested against noisy utterances. The SNR in the
horizontal axis refers to the test utterances.
The confidence interval for each SNR of the
experimental results for continuous speech
recognition is shown in Figure 4.
Figure 4: Confidence interval for a system trained with
clean speech and tested with noisy utterances.
4.2 System Trained with Noisy
Utterances
Given the hypothesis that the acoustic mismatch
between the training and testing conditions is the
main reason for the performance loss, a possible
strategy is to train the system with noisy utterances.
Considering that the performance for system trained
with all SNRs is affected when recognizing higher
SNRs (Valerio and Ynoguti, 2011) presenting just a
small improvement due to loss speech information, a
second system was built, trained with utterances
corrupted with all noise types at higher SNRs only
(15 dB and 20 dB). The recognition results are
shown in Figure 5.
Figure 5: Comparison of recognition rates for a system
trained with clean speech and with utterances of 15 dB and
20 dB SNRs.
From Figure 5, the performance of both systems is
similar for lower SNRs, but the proposed strategy
produces a better result for higher SNRs.
The confidence interval for each SNR of the
experimental results is shown in Figure 6.
The next step is to test if is it possible to use the
MAP adaptation strategy to further improve this
BIOSIGNALS2014-InternationalConferenceonBio-inspiredSystemsandSignalProcessing
94
performance. The results are shown in the sequel.
Figure 6: Confidence interval for a system trained and
tested with noisy utterances.
4.3 System Trained with Noisy
Utterances and Adapted for the
Specific Noise of the Utterance
Being Recognized
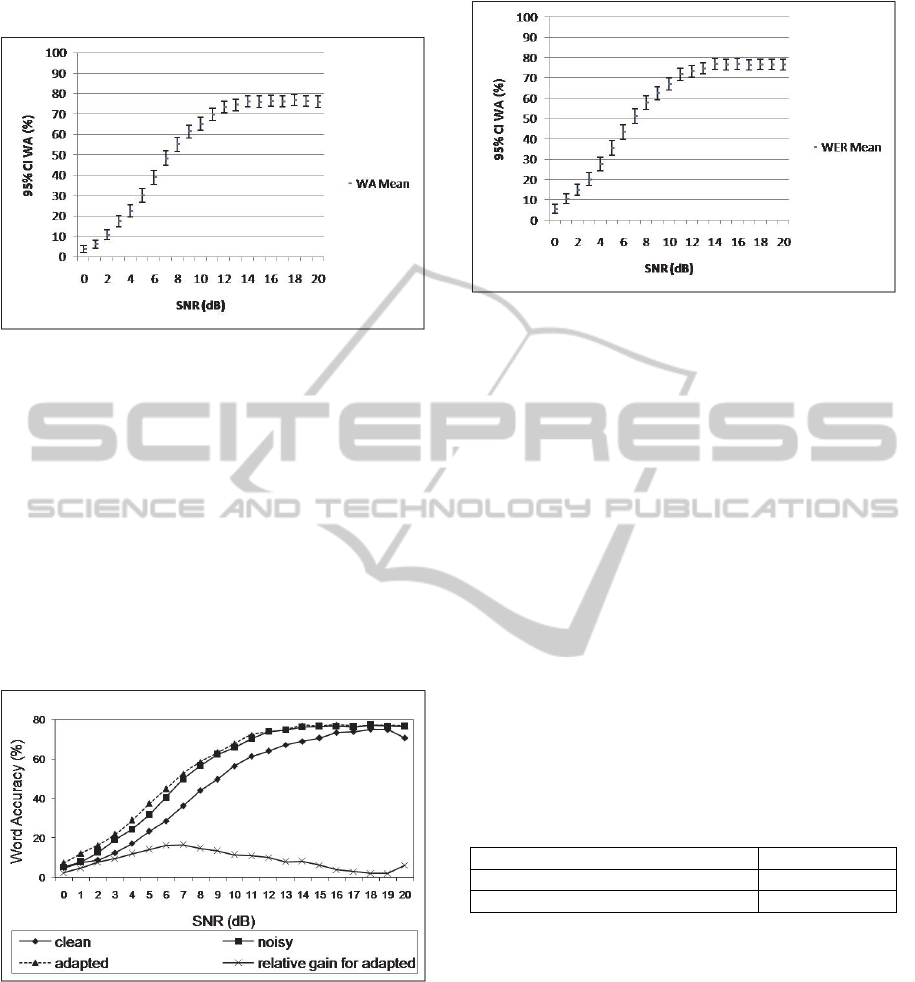
To improve the matching between the acoustic
conditions of the training and testing conditions, an
excerpt (approximately 500 ms) of the actual noise
of the utterance being recognized was used to adapt
the HMM parameters using the MAP strategy. The
recognition rates for this test are shown in Figure 7.
Figure 7: Recognition rates for a system trained with noisy
speech, adapted with the actual noise and tested against
noisy utterances.
The results show that the adaptation step provides a
little but consistent improvement of the recognition
rates over all SNR range.
The confidence interval for each SNR of the
experimental results is shown in Figure 8.
Figure 8: Confidence interval for a system trained with
corrupted utterances, adapted for the specific noise of the
speech being recognized.
4.4 Analysis
From the observation of Figures 3, 5 and 7 the
following analysis can be made:
A system trained only with clean utterances has
poor performance in noisy environments;
Training the system with all noise types with
SNRs of 15 dB and 20 dB improves its
performance, but this improvement is lower when
recognizing utterances with lower SNRs;
Adapting system parameters to the actual noise
that is present in the utterance being recognized
causes a further improvement in the recognition
rate.
On average, the recognition rate gain over the
baseline system is shown in Table 1.
Table 1: Recognition rate gain over the baseline system
for each strategy.
Strategy Gain
Noisy utterances (15 dB and 20 dB) 6.79 %
Adapted 8.63 %
5 CONCLUSIONS
In this work we propose an adaptation scheme of the
acoustic models of a speech recognition system
using the MAP method and samples of ambient
noise.
This approach allows a single system trained
with noisy utterances to be modified according to
the type and level of noise present along with the
speech signal, using the portions where the speaker
is not talking.
The combined strategy of training the
ModelAdaptationviaMAPforSpeechRecognitioninNoisyEnvironments
95

recognition system with noise corrupted utterances
and adapting the system parameters according to the
specific noise present in the utterance being
recognized led to an average improvement of 8.63%
in the recognition rate when compared to the
baseline system.
A question that needs further investigation is the
choice of the
parameter in the adaptation
equations for each noise type and level.
REFERENCES
Alcaim, A., Solewicz, J. A. and Moraes, J. A., 1992.
Frequência de ocorrência dos fones e listas de frases
foneticamente balanceadas no português falado no Rio
de Janeiro. Revista da Sociedade Brasileira de
Telecomunicações, 7(1), pp.23-41.
Furui, S., 2007. 50 years of progress in speech recognition
technology: Where we are, and where we should go?
from a poor dog to a super cat. In: ICASSP
(International Conference on Acoustics, Speech, and
Signal Processing), 2007 International Conference on
Acoustic, Speech, and Signal Processing. Honolulu,
Hawaii, USA 15-20 April 2007. Piscataway, NJ:
IEEE.
M. Grimm and K. Kroschel, Robust Speech Recognition
and Understanding, InTech, 2007, pp. 439-460.
Ney, H., 1984. The use of a one-stage dynamic
programming algorithm for connected word
recognition. IEEE Transactions on Acoustic, Speech
and Signal Processing, 32(2), pp.263-271.
NIST, 2011. National Institute o Standards and
Technology. 01 February 2010. (online) Available at:
<http://http://www.itl.nist.gov/iad/mig//tools/>
[Accessed 10 January 2011].
Pearce, D. and Hirsch H. G., 2000. The aurora
experimental framework for the performance
evaluation of speech recognition systems under noise
conditions. In: ISCA (International Speech Conference
Association), ISCA ITRW ASR2000 “Automatic
Speech Recognition: Challenges for the Next
Millennium”. Paris, France 18-20 September 2000. .
Paris: ISCA.
Reynolds, D. A., 2003. Channel robust speaker
verification via feature mapping. In: ICASSP
(International Conference on Acoustics, Speech, and
Signal Processing), 2003 International Conference on
Acoustic, Speech, and Signal Processing. Hong Kong,
Hong Kong, 06-10 April 2003. New York, NY: IEEE.
Valerio, T. A. F. and Ynoguti, C. A., 2011. Multi-style
training analysis for robust speech recognition.
Discriminative feature extraction for speech
recognition in noise. In: IWT (International Workshop
on Telecommunications), 2011 International
Workshop on Telecommunications, Rio de Janeiro,
Brazil 03-06 May 2011. Santa Rita do Sapucaí:
INATEL.
Ynoguti, C. A., 1999. Reconhecimento de fala contínua
usando modelos ocultos de Markov. Ph. D.
Universidade Estadual de Campinas.
Ynoguti, C. A. and Violaro, F., 2000. Um sistema de
reconhecimento de fala contínua baseado em modelos
de Markov contínuos. In: SBrT (Sociedade Brasileira
de Telecomunicações), XVIII Simpósio Brasileiro de
Telecomunicações. Gramado-RS, Brazil 03-06
September 2000. Brazil: SBrT.
BIOSIGNALS2014-InternationalConferenceonBio-inspiredSystemsandSignalProcessing
96
