
Evaluation of the Effects of Dose on Lung Ventilation Calculated
from 4D-CT using Deformable Image Registration
An Application of a Ventilation Calculation Algorithm based on 4D-CT
Kujtim Latifi, Thomas J. Dilling, Craig W. Stevens, Vladimir Feygelman,
Eduardo G. Moros and Geoffrey G. Zhang
Department of Radiation Oncology, Moffitt Cancer Center, Tampa, Florida, U.S.A.
Keywords: Deformable Image Registration, Ventilation Calculation, 4D-CT, Lung Ventilation, Radiotherapy,
Radiation Dose.
Abstract: Ventilation derived from 4D-CT using deformable image registration (DIR) has been found correlate to the
result from a conventional modality very well. How radiation affects ventilation in lungs is still not clearly
studied. In this paper, ventilation versus radiation dose is investigated using ΔV method, a ventilation
calculation algorithm based on 4D-CT and DIR. Diffeomorphic morphons was used as the DIR tool. Tidal
volume normalized ventilation was used in this study. A total of 20 SBRT lung cancer patients’ 4D-CT and
planning dose data were retrospectively analysed. All the patients had two sets of 4D-CT, one at pre-
treatment and one post treatment. Ventilation distributions were calculated based on the two sets of 4D-CT
for each case. The two ventilation data sets were aligned using DIR. Radiation dose distributions were
resampled to match the resolution of CT images. A ventilation (or ventilation change) and dose values were
thus associated to each voxel of the CT images. A function (ventilation change) – dose – volume surface
was generated for each case. Average ventilation was found degraded in higher than 20 Gy dose regions for
16 out of the 20 cases. This result can be applied in treatment planning to spare functional lung volumes.
1 INTRODUCTION
Lung functional information has been proposed to be
used in radiation therapy (RT) treatment planning to
spare normal functional lung volumes (Lavrenkov et
al., 2007; Shioyama et al., 2007). Conventionally
and clinically, lung functional data are acquired
using nuclear medicine techniques (Petersson et al.,
2004; Suga, 2002). Recently, algorithms have been
developed to derive ventilation distribution matrix
from four-dimensional computed tomography (4D-
CT) images using deformable image registration
(DIR) (Guerrero et al., 2005; Reinhardt et al., 2008;
Zhang et al., 2009). Promising comparison result has
been made between ventilation images using 4D-CT
and a conventional method (Ding et al., 2012). The
advantages of ventilation data derived from 4D-CT
include its quantitativeness, high resolution and low
cost. As 4D-CT is routinely taken for treatment
planning purposes when treating lung cancer
patients using radiotherapy, ventilation data can be
derived from the 4D-CT without any extra imaging
procedure.
Functional lung images were suggested to be
used in treatment planning to spare functional lung
volumes in order to safely escalate radiation dose in
patients and improve disease control (Yaremko et
al., 2007). However, without a thorough
understanding of the effect of radiation dose on lung
functions, it is not meaningful setting up objectives
or constraints in treatment planning. To
meaningfully implement functional lung sparing in
treatment planning in clinical practice, a study of
ventilation change versus radiation dose needs to be
performed.
Ventilation imaging using 4D-CT was proposed
to be used to evaluate the ventilation change due to
radiation therapy by Ding et al in which two
patients’ data were analysed (Ding et al., 2010). This
study uses derived ventilation from 4D-CT scans to
evaluate the effects of radiation treatment on lung
ventilation. Besides more patient data, a different
DIR algorithm and ventilation calculation algorithm
were used in this study. In addition, ventilation data
5
Latifi K., J. Dilling T., W. Stevens C., Feygelman V., G. Moros E. and G. Zhang G..
Evaluation of the Effects of Dose on Lung Ventilation Calculated from 4D-CT using Deformable Image Registration - An Application of a Ventilation
Calculation Algorithm based on 4D-CT.
DOI: 10.5220/0004719700050011
In Proceedings of the International Conference on Bioimaging (BIOIMAGING-2014), pages 5-11
ISBN: 978-989-758-014-7
Copyright
c
2014 SCITEPRESS (Science and Technology Publications, Lda.)
in this study were normalized to tidal volume for a
more accurate analysis.
2 MATERIALS AND METHODS
The use of patients’ de-identified 4D-CT image and
3D dose distribution data in this retrospective study
using the ventilation calculation algorithm based on
4D-CT and DIR closely followed an institutional
review board (IRB) approved protocol.
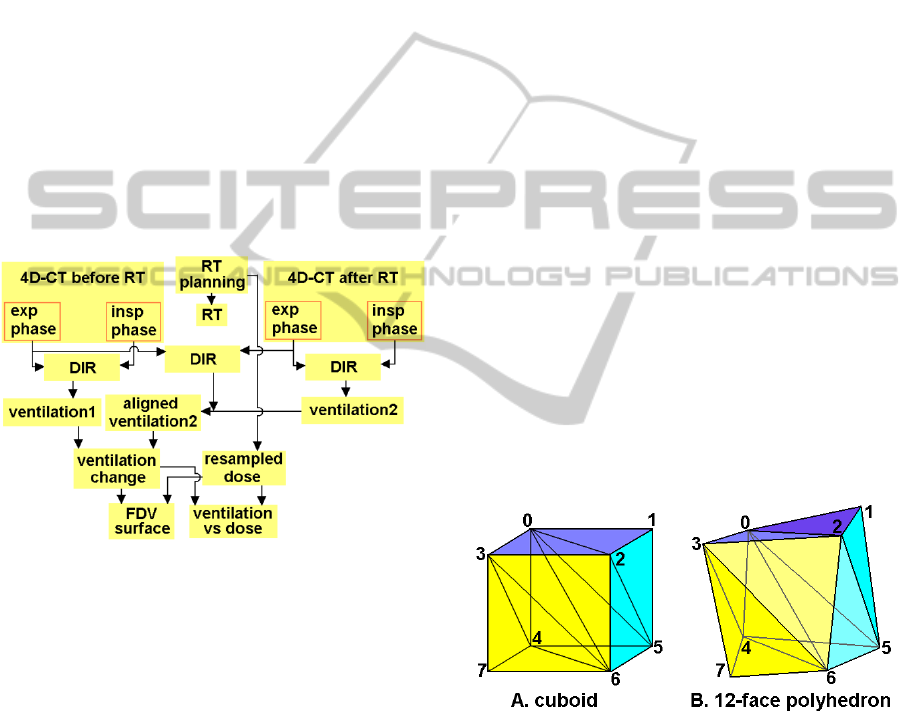
Figure 1 shows the flow diagram of the analysis
of ventilation change due to radiotherapy using 4D-
CT and DIR. Two phases, expiration and inspiration,
from each 4D-CT data set were used for ventilation
distribution calculation. DIR was applied 3 times for
each case, one for each ventilation calculation of the
2 data sets and one to map the 2
nd
ventilation data
(post RT treatment) to the 1
st
one (pre RT
treatment).
Figure 1: Flow chart of the ventilation change – dose
analysis using 4D-CT and DIR. In the diagram, RT =
radiation therapy, exp = expiration, insp = inspiration, DIR
= deformable image registration, FDV = function
(ventilation change) – dose – volume.
The dose distribution from treatment planning
usually used 2×2×2 or 3×3×3 mm
3
dose grid. To
calculate the function (ventilation change)-dose-
volume surface and ventilation change versus dose
data, the 3D dose distribution data were resampled
to match the CT resolution, usually about 1×1×3
mm
3
. The dose distribution was not recalculated in
the treatment planning system with the new dose
grid size. Linear interpolation was applied in the
dose data resampling.
After the DIR and resampling, the two
ventilation distributions and thus the ventilation
change distribution were aligned with the expiration
phase in the pre RT 4D-CT, and so was the dose
distribution. The quantitative analysis was based on
the aligned distribution data.
2.1 Deformable Image Registration
(DIR)
This study uses the diffeomorphic morphons (DM)
DIR method (Janssens et al., 2009). In the validation
of the DM algorithm, the average target registration
error (TRE), for normal end-expiration to end-
inspiration registration in a 4D-CT data set, is
1.4±0.6 mm (Latifi et al., 2013c). DM DIR of the
normal end-expiration and end-inspiration phases of
4D-CT images was used to correlate the voxels
between the two phases.
DM DIR is also used in the 2
nd
ventilation
mapping from the post treatment CT to the pre-
treatment CT. After the mapping, the two ventilation
data sets are aligned on the pre-treatment CT set.
The DIR is performed between the expiration phase
of the post treatment 4D-CT and the expiration
phase of the pre-treatment 4D-CT. The deformation
matrix resulted from the DIR was used to map the
ventilation data from the post treatment CT frame to
the pre-treatment CT frame.
2.2 Ventilation Calculation
This study uses the ΔV ventilation calculation
algorithm (Zhang et al., 2011; Zhang et al., 2009) to
derive ventilation from 4D-CT scans.
Figure 2: (A) A cuboid can be divided into 6 tetrahedrons.
(B) The corresponding 12-face polyhedron (deformed
cuboid) is composed of 6 deformed tetrahedrons.
The ΔV method, which is a direct geometrical
calculation of the volume change, was used to
calculate the local lung expansion or contraction
(Zhang et al., 2009). In the expiration phase of a 4D-
CT data set, each voxel is a cuboid defined by 8
vertices. In the inspiration phase, this cuboid is
changed into a 12-face polyhedron which is still
comprised of the corresponding 8 vertices. Any
hexahedron or 12-face polyhedron can be divided
BIOIMAGING2014-InternationalConferenceonBioimaging
6

into 6 tetrahedrons (Figure 2). The volumes of the
cuboid and the 12-face polyhedron (deformed
cuboid) are the sums of the volumes of their 6
corresponding tetrahedrons. In the inspiration phase,
DIR calculates the corresponding locations of the 8
vertices that define the cuboid in the expiration
phase. The volumes of each cuboid and the
corresponding deformed cuboid are calculated using
the corresponding vertices of each respective
polyhedron.
The fundamental volume calculation is based on
the volume calculation for each tetrahedron. The
coordinates of the 4 vertices of a tetrahedron are
used to determine its volume:
V = (b - a) · [(c - a) × (d - a)] / 6 (1)
where a, b, c, d are the vertices’ coordinates
expressed as vectors. The volumes of the six
tetrahedrons are summed up to generate the volume
of the given polyhedron.
The ventilation distribution was calculated as the
distribution of
P = ΔV/V
ex
p
, (2)
where ΔV is the volume change between expiration
and inspiration and V
exp
is the initial volume at
expiration (Simon, 2000).
There is often tidal volume (TV) difference
between two 4D-CT scans of the same patient. The
quantitative ventilation data derived from 4D-CT
depends on the TV, since if TV is different, ΔV for
each local voxel would be different thus ventilation
P is different based on Equation (1). To remove the
ventilation dependence on the TV of the patient’s
respiration, the ventilation change was calculated
using the tidal volume normalized ventilation data
(Du et al., 2013). Tidal volume is calculated by
integrating the local volume change ΔV over the
entire lung volume. For two 4D-CT sets, taken
before and after treatment, there are two TVs from
the ventilation calculations: TV1 from the pre-
treatment data set and TV2 from the post-treatment
one. In the normalization process, the pre-treatment
ventilation distribution is not changed, while the
post-treatment ventilation distribution is normalized
to TV1 by applying a multiplication factor,
TV1/TV2, to every voxel in the lungs. After this
normalization, both ventilation data sets have the
same tidal volume, TV1, thus removing the final
result dependency on the TV. In this study, two sets
of ventilation data were compared using this
normalization method for each patient.
A reduced lung mask was used in order to avoid
any possible artifacts near the lung boundary due to
sliding motion (Loring et al., 2005). The margin of
the lung mask reduction was 1 mm. The lung masks
were automatically generated by density threshold
method on the CT images using a homemade
computer program.
Ventilation data were calculated and
superimposed on the normal end-expiration phase of
the 4D-CT before and after RT for each case. DM
was also applied to register the two normal end-
expiration phases of the 2 sets of 4D-CT, and the
resulted deformation matrix was used to deform the
ventilation matrix from the after RT data frame to
the before RT data frame. The ventilation change
distribution was then calculated between the
registered ventilation data sets.
Dice similarity coefficient (DSC) index was used
to calculate the similarity between the two
ventilation volumes (Dice, 1945). When volume A
and B are compared, DSC is calculated as
BA
BA
DSC(A,B)
2
(3)
The values of DSC index range between 1.0 and
0.0. A DSC index of 1.0 indicates a complete
overlap of the two volumes examined whereas a
DSC index of 0.0 indicates no overlap between the
volumes examined, and intermediate values describe
proportional amount of overlap. To calculate the
DSC for the two sets of ventilation data in each case,
the ventilation data were converted to relative
percentile ventilation distribution (Castillo et al.,
2010). Similar to the cumulative dose-volume
histogram, if a certain percentage lung volume is
covered by a certain ventilation value and below,
this ventilation value is converted to the
corresponding percentage value of the lung volume
in the percentile distribution. The volumes for the
DSC index were generated based on the percentile
ventilation values. The two aligned ventilation data
sets were compared for the similarity of the higher
50% of ventilation volume.
2.3 Patient Data
As 4D-CT is not clinically taken in patient follow-up
scans after radiotherapy, patient selection has to be
within the group that had second tumor treatment. A
4D-CT is taken for the treatment planning before the
second tumor treatment, which can also serve as the
follow-up 4D-CT of the first tumor treatment.
Among the hundreds of lung cancer patients treated
with stereotactic body radiotherapy (SBRT), 20
patients who had second lung tumor treated were
selected for this study.
4D-CT sets from before and after RT were used
EvaluationoftheEffectsofDoseonLungVentilationCalculatedfrom4D-CTusingDeformableImageRegistration-An
ApplicationofaVentilationCalculationAlgorithmbasedon4D-CT
7
to derive ventilation for the patients, following an
IRB approved protocol. The resolution in the 4D-CT
was about 1×1×3 mm
3
. All CT data covered the
lungs completely. Time between end of treatment
and the follow up scan ranged from 1-25 months.
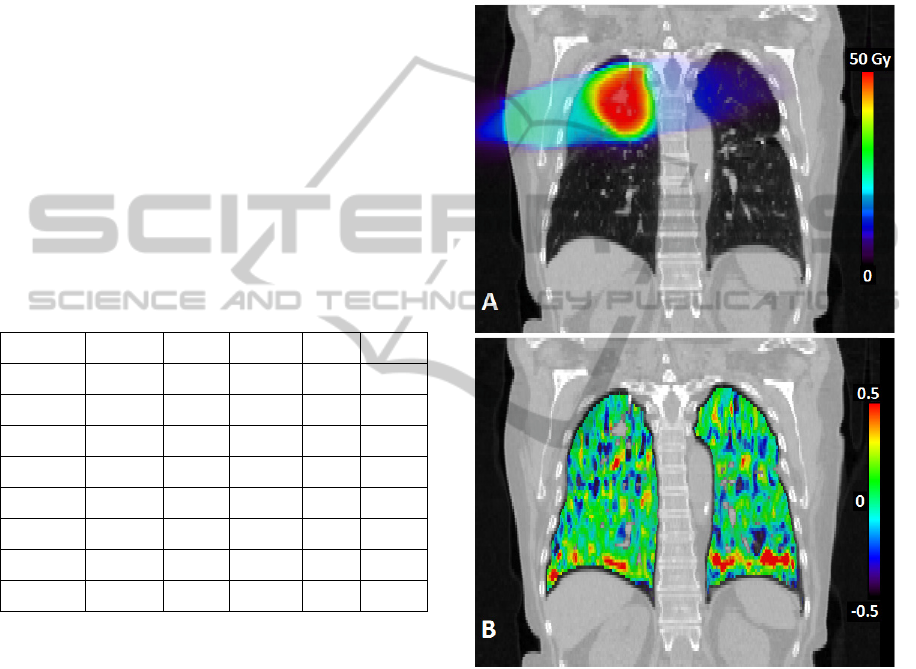
Table 1 lists the statistic data of target volume
and dose level volumes in lungs for the 20 patients.
Notice that the lung and dose level volumes exclude
the gross target volume (GTV). Also, the low dose
volumes (<1Gy) were much larger than the high
dose volumes (>30Gy, 20~30Gy), usually by 2
orders of magnitude. The internal gross target
volume (IGTV) was derived from (at a minimum)
the union of the GTV volumes on two extreme
phases of the 4D-CT scan and the free breathing
scan. The standard IGTV to the planning target
volume (PTV) expansion was 5mm axially and 7mm
superiorly and inferiorly. The treatment plans were
optimized to cover 100% of the IGTV and at least
95% of the PTV by the prescribed dose. Doses
ranged from 40-60 Gy delivered in 4-5 fractions.
Table 1: Target volume and dose level volumes in lungs.
Volume Average SD Median Min Max
Lung 2447.6 1062.1 2338.7 837.0 4599.6
PTV 34.3 28.2 24.9 5.5 106.7
>30Gy 78.1 85.4 53.5 6.7 359.4
20~30Gy 65.1 66.7 38.2 10.2 276.1
10~20Gy 159.8 128.7 139.4 23.3 536.4
5~10Gy 195.6 145.0 145.6 51.4 589.7
1~5Gy 540.5 436.1 391.2 166.1 1737.5
<1Gy 1402.9 614.6 1372.7 418.5 2778.9
Dose and normalized ventilation were
superimposed on the CT volume resulting in each
voxel having a volume, normalized ventilation
change and a dose and therefore leading to a 3-
dimensional histogram, or function (ventilation
change) – dose – volume (FDV) surface. An FDV
surface was generated for each case based on the
aligned data. Accumulating the volumes in different
ventilation change ranges in the FDV surface data,
2D dose – volume histograms for the corresponding
ventilation change range were generated. Mean TV
normalized ventilation within the 1, 5, 10, 20 and 30
Gy regions was calculated before and after RT. The
cases were binned into 3 groups with follow-up time
of less than 5 months (n = 6), 5 months to 1 year (n
= 6) and longer than 1 year (n = 8). The ventilation
change versus dose of different follow-up time was
compared.
3 RESULTS
Figure 3 shows an example of the dose and
calculated ventilation change distributions
overlapped on the expiration phase of the 4D-CT.
More negative ventilation change, or ventilation
degradation, around the tumor (high dose region)
can be seen in this example.
Figure 3: A coronal view of an example of the dose (A)
and ventilation change (B) distributions overlapped with
the expiration phase of the pre-treatment 4D-CT.
Figure 4 shows a typical FDV surface. Since
most of the lung volume is under low dose coverage
(Table 1), the surface is peaked close to 0 dose. The
maximum value of % volume (vertical axis) in this
figure is set at 0.1% to make the high dose surface
visible.
Figure 5 shows a typical ventilation change
versus dose histogram. For sixteen out of 20 cases,
ventilation after treatment was lower within the high
dose region compared to that before treatment,
which is reflected by the “get worse” curve being
BIOIMAGING2014-InternationalConferenceonBioimaging
8
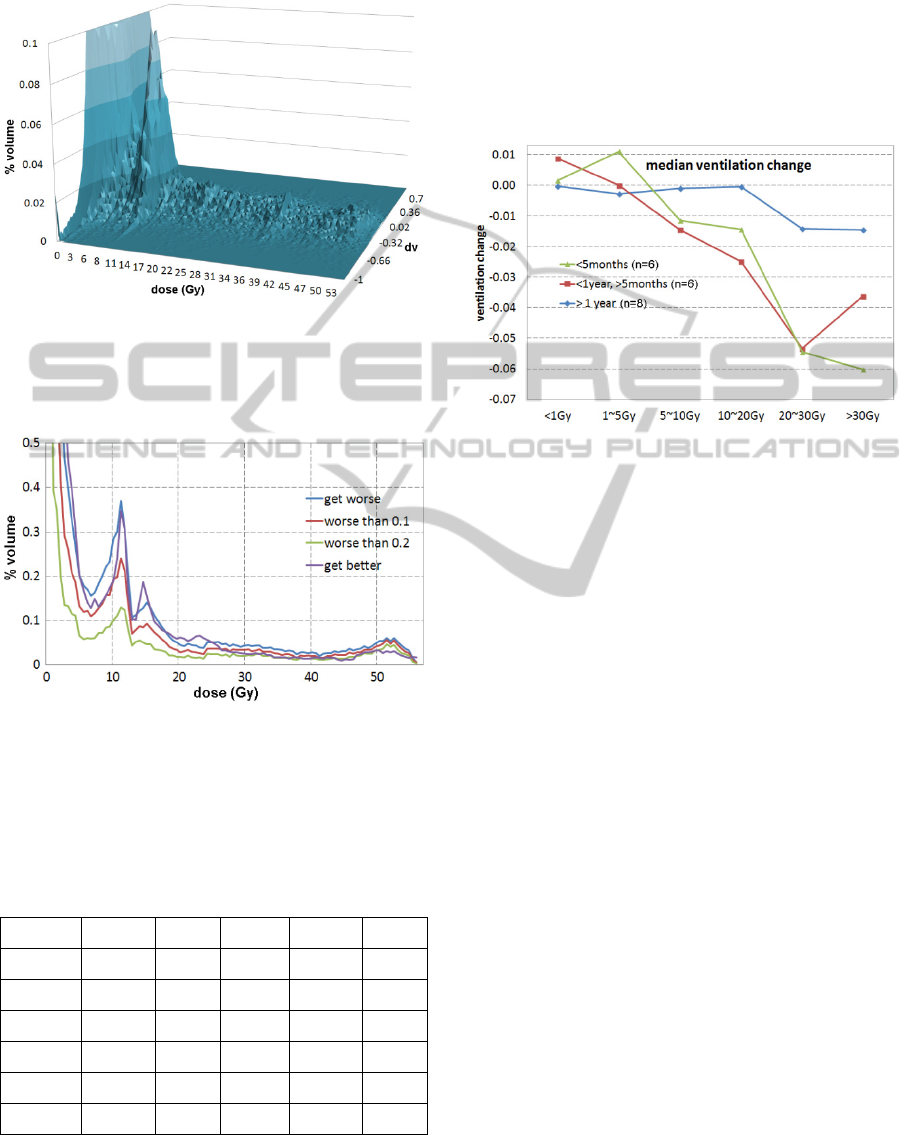
higher than “get better” curve in the high dose
region in Figure 5.
Figure 4: A typical function (ventilation change)-dose-
volume (FDV) surface. The volume of the lungs is
normalized to 100%. The maximum value of the %
volume (vertical axis) is set to 0.1% to make the high dose
surface visible. In the figure, dv = ventilation change.
Figure 5: A typical ventilation change versus dose
histogram. Curve “get worse” is the volume integration at
a certain dose level for lower (worse) ventilation after
treatment and “get better” is the volume for higher (better)
ventilation. In the figure, worse than 0.1 means the TV
normalized ventilation decreased more than 10%
after
treatment.
Table 2: Ventilation change versus dose over the 20 cases.
Region Average SD Median Min Max
<1Gy 0.0002 0.0178 -0.0010 -0.0339 0.0376
1~5Gy 0.0075 0.0365 0.0035 -0.0444 0.1403
5~10Gy 0.0096 0.0522 -0.0004 -0.0427 0.2051
10~20Gy -0.0074 0.0491 0.0026 -0.1293 0.0764
20~30Gy -0.0189 0.0664 -0.0091 -0.1805 0.1100
>30Gy -0.0239 0.0529 -0.0188 -0.0927 0.1448
Figure 6 demonstrates that the trend of the
average ventilation change is less dependent on
dose. In other words, the average ventilation change
versus dose tends to be flattened with time.
Table 2 lists the statistical ventilation change
data over the 20 cases. The trend is that the average
ventilation degrades with dose when the dose is
greater than 20 Gy. The ventilation change
difference was statistically significant in the dose
regions covered by < 1 Gy and > 30 Gy (p = 0.006).
Figure 6: The median values of average ventilation
changes in various dose level regions of different groups
of follow-up time.
Mean DSC index for the above 50% ventilation
volume was 0.60 ± 0.04 (1 SD) with a range 0.52 to
0.69.
For lung tissue regions receiving more than 20
Gy, a decrease in ventilation was observed in 16 of
20 patients. For the 16 cases ventilation within the
20 Gy dose was reduced by an average of 6.4%
(range 0.3 to 18.1%). For regions receiving more
than 30 Gy, 15 out of 20 patients had an average
decrease of ventilation by 4.4% (range 0.6 to 9.3%).
Four patients had an average increase of ventilation
of 4.1% within the 20 Gy and five patients had an
average increase of 3.8% within the 30 Gy region.
4 DISCUSSION
The use of normalized ventilation data in the
comparison is to remove the tidal volume
dependence. However, the normalization gives
prominence to the relativity feature of the ventilation
data. In other words, the ventilation change is
relative after normalization. If ventilation gets better
in some regions, there must be some regions where
ventilation gets worse, since the total volume change
in each data set must be the same tidal volume, or
the total ventilation change over the whole lung
must be zero between two normalized data sets. This
EvaluationoftheEffectsofDoseonLungVentilationCalculatedfrom4D-CTusingDeformableImageRegistration-An
ApplicationofaVentilationCalculationAlgorithmbasedon4D-CT
9

relativity feature is the reason that the FDV surface
often shows symmetry with ventilation axis (Figure
4). Here is an easy example to help understanding
the relativity feature. Assuming half of a uniformly
ventilated lung becomes no ventilation (half A) and
the other half is still uniformly ventilated (half B).
After normalization, half A gets worse by 100%
while half B gets better by 100% since half B is
normalized to the tidal volume of before the change.
Without normalization, the comparison would really
depend on how deep the subject breathes (tidal
volume dependence).
To spare functional lung volumes in treatment
planning for SBRT, an objective or constraint thus is
suggested that good ventilation regions derived from
the pre-treatment 4D-CT should avoid radiation dose
of higher than 20 Gy, based on this study.
Based on the linear-quadratic model, the
biological effective dose (BED) of 4 Gy × 5
fractions = 20 Gy isodose line in the normal lung
tissue is the same of 35 Gy isodose line in the
conventional treatment of the prescription dose 2 Gy
× 35 fractions = 70 Gy, and the 30 Gy isodose line
in the SBRT is equivalent to 58 Gy isodose line in
the conventional treatment. In the above calculation,
the α/β ratio for the normal lung tissue is set at 3.1
Gy (Dubray et al., 1995). The analysis on the 20 and
30 Gy dose levels thus can be applied to the
conventional treatment at dose levels of 35 and 58
Gy.
A related study evaluated whether dose to the
highly ventilated regions in the lung resulted in
increased incidence of clinical toxicity, in which
only the pre-RT 4D-CT was used for each patient to
generate ventilation distribution and dose-ventilation
histogram (Vinogradskiy et al., 2013). By
comparison, our study used two sets of 4D-CT, one
pre-RT and the other one post-RT, for each patient
to directly calculate dose-induced ventilation
change, which generated more statistically
significant results.
For each case, there are two calculated
ventilation data sets. The DSC is a measure of the
similarity between the two data sets. The DSC data
showed that there are some changes between the two
data sets. The ventilation changes mostly are
because of the radiation therapy treatments.
However, the errors introduced in ventilation
calculation may cause some ventilation variation.
Although the reproducibility of ventilation derived
from 4D-CT has been shown good in some studies
(Du et al., 2013; Du et al., 2012), and the
comparison between this method and other standard
modality is good (Ding et al., 2012), some other
studies also show that the ventilation calculation
depends on DIR algorithm and ventilation
calculation algorithm (Latifi et al., 2013a). The
reason for the dependence is deemed that different
algorithms handle 4D-CT artifacts differently.
Artifacts in 4D-CT could cause errors in DIR
(Zhang et al., 2008), which in turn introduces errors
in the derived ventilation data. To minimize the
errors introduced by artifacts in 4D-CT, data sets
with obvious mushroom artifacts in the diaphragm
region, which are usually caused by irregular
diaphragm motion, were excluded in this study.
Since this is a retrospective study, this kind of
exclusion would cause exclusion of clinical cases. If
this method is used in a prospective study, timely
review the 4D-CT data before the patient getting off
the table is recommended. If obvious mushroom
artifacts are present, re-scan with a slower
respiration should be performed.
Quantum noise is another source of DIR errors.
High quality 4D-CT is essential for accurate
ventilation data (Latifi et al., 2013b).
5 CONCLUSIONS
Lung ventilation prior to and following radiotherapy
can be measured using 4D-CT and DIR techniques.
Changes in ventilation were observed with a
correlation between ventilation change and radiation
dose of greater than 20 Gy. These data suggest that
ventilation calculated from 4D-CT may be a reliable
tool for measuring/predicting the effects of dose on
ventilation. Incorporating 4D-CT calculated
ventilation in treatment planning would aid in
avoiding well ventilated regions and possibly
preventing lung injury.
ACKNOWLEDGEMENTS
This work was partially supported by a research
grant from Varian Medical Systems, Inc., Palo Alto,
CA. We thank Kenneth Forster for his involvement
in the early stages in this project.
REFERENCES
Castillo R., Castillo E., Martinez J., and Guerrero T, 2010
Ventilation from four-dimensional computed
tomography: density versus Jacobian methods Phys
Med Biol 55 4661-85.
BIOIMAGING2014-InternationalConferenceonBioimaging
10

Dice L. R. 1945 Measures of the amount of ecologic
association between species Ecology 26 297-302.
Ding K., Bayouth J. E., Buatti J. M., Christensen G E and
Reinhardt J M 2010 4DCT-based measurement of
changes in pulmonary function following a course of
radiation therapy Med Phys 37 1261-72.
Ding K., Cao K., Fuld M. K., Du K., Christensen G. E.,
Hoffman E. A. and Reinhardt J. M. 2012 Comparison
of image registration based measures of regional lung
ventilation from dynamic spiral CT with Xe-CT Med
Phys 39 5084-98.
Du K., Bayouth J. E., Cao K., Christensen G. E., Ding K.
and Reinhardt J. M. 2012 Reproducibility of
registration-based measures of lung tissue expansion
Med Phys 39 1595-608.
Du K., Bayouth J. E., Ding K., Christensen G. E., Cao K.
and Reinhardt J. M. 2013 Reproducibility of intensity-
based estimates of lung ventilation Med Phys 40
063504.
Dubray B., Henry-Amar M., Meerwaldt J. H., Noordijk E.
M., Dixon D. O., Cosset J-M and Thames H. D. 1995
Radiation-induced lung damage after thoracic
irradiation for Hodgkin's disease: the role of
fractionation Radiother Oncol 36 211-7.
Guerrero T., Sanders K., Noyola-Martinez J., Castillo E.,
Zhang Y., Tapia R., Guerra R., Borghero Y. and
Komaki R. 2005 Quantification of regional ventilation
from treatment planning CT int J Radiat Oncol Biol
Phys 62 630-4.
Janssens G., de Xivry J. O., Fekkes S., Dekker A., Macq
B., Lambin P. and van Elmpt W. 2009 Evaluation of
nonrigid registration models for interfraction dose
accumulation in radiotherapy Med Phys 36 4268-76.
Latifi K., Forster K. M., Hoffe S. E., Dilling T. J., Elmpt
W. v., Dekker A. and Zhang G. G. 2013a Dependence
of ventilation image derived from 4D CT on
deformable image registration and ventilation
algorithms J Appl Clin Med Phy 14 150-62.
Latifi K., Huang T-C, Feygelman V., Budzevich M. M.,
Moros E. G., Dilling T. J., Stevens C. W., Elmpt W.
v., Dekker A. and Zhang G. G. 2013b Effects of
quantum noise in 4D-CT on deformable image
registration and derived ventilation data Phys Med
Biol 58 7661-72.
Latifi K., Zhang G., Stawicki M., van Elmpt W., Dekker
A. and Forster K. 2013c Validation of three
deformable image registration algorithms for the
thorax J Appl Clin Med Phys 14 19-30.
Lavrenkov K., Christian J. A., Partridge M., Niotsikou E.,
Cook G., Parker M., Bedford J. L. and Brada M. 2007
A potential to reduce pulmonary toxicity: the use of
perfusion SPECT with IMRT for functional lung
avoidance in radiotherapy of non-small cell lung
cancer Radiother Oncol 83 156-62.
Loring S. H., Brown R. E., Gouldstone A. and Butler J. P.
2005 Lubrication regimes in mesothelial sliding J.
Biomech. 38 2390-6.
Petersson J., Sánchez-Crespo A., Rohdin M., Montmerle
S., Nyrén S., Jacobsson H., Larsson S. A., Lindahl S.
G. E., Linnarsson D., Glenny R. W. and Mure M.
2004 Physiological evaluation of a new quantitative
SPECT method measuring regional ventilation and
perfusion J Appl Phisiol 96 1127-36.
Reinhardt J. M., Ding K., Cao K., Christensen G. E.,
Hoffman E. A. and Bodas S. V. 2008 Registration-
based estimates of local lung tissue expansion
compared to xenon CT measures of specific
ventilation Med. Image Anal. 12 752-63.
Shioyama Y., Jang S. Y., Liu H. H., Guerrero T., Wang
X., Gayed I. W., Erwin W. D., Liao Z., Chang J. Y.,
Jeter M., Yaremko B. P., Borghero Y. O., Cox J. D.,
Komaki R. and Mohan R. 2007 Preserving functional
lung using perfusion imaging and intensity-modulated
radiation therapy for advanced-stage non–small cell
lung cancer Int J Radiat Oncol Biol Phys 68 1349-58.
Simon B. A. 2000 Non-invasive imaging of regional lung
function using X-ray computed tomography J Clin
Monitoring Computing 16 433-42.
Suga K. 2002 Technical and analytical advances in
pulmonary ventilation SPECT with Xenon-133 gas
and Tc-99m-Technegas Ann. Nucl. Med. 16 303-10.
Vinogradskiy Y., Castillo R., Castillo E., Tucker S. L.,
Liao Z., Guerrero T. and Martel M. K. 2013 Use of 4-
dimensional computed tomography-based ventilation
imaging to correlate lung dose and function with
clinical outcomes Int J Radiat Oncol Biol Phys 86
366-71.
Yaremko B. P., Guerrero T. M., Noyola-Martinez J.,
Guerra R., Lege D. G., Nguyen L. T., Balter P. A.,
Cox J. D. and Komaki R. 2007 Reduction of normal
lung irradiation in locally advanced non-small-cell
lung cancer patients, using ventilation images for
functional avoidance Int J Radiat Oncol Biol Phys 68
562-71.
Zhang G., Huang T-C, Dilling T., Stevens C. and Forster
K. 2011 Comments on 'Ventilation from four-
dimensional computed tomography: density versus
Jacobian methods' Phys Med Biol 56 3445-6.
Zhang G., Huang T-C, Guerrero T., Lin K-P, Stevens C.,
Starkschall G. and Forster K. 2008 Use of three-
dimensional (3D) optical flow method in mapping 3D
anatomic structure and tumor contours across four-
dimensional computed tomography data J Appl Clin
Med Phy 9 59-69.
Zhang G. G., Huang T. C., Dilling T., Stevens C. and
Forster K. M. 2009 Derivation of high-resolution
pulmonary ventilation using local volume change in
four-dimensional CT data. In: World Congress on
Medical Physics and Biomedical Engineering, ed O
Dössel and W C Schlegel (Munich, Germany:
Springer) pp 1834-7.
EvaluationoftheEffectsofDoseonLungVentilationCalculatedfrom4D-CTusingDeformableImageRegistration-An
ApplicationofaVentilationCalculationAlgorithmbasedon4D-CT
11
