
In-chair Movements of Healthy People during Prolonged Sitting
Elisa Marenzi, Gian Mario Bertolotti and Giovanni Danese
Department of Electrical, Computer and Biomedical Engineering, University of Pavia, via Ferrata 3, Pavia, Italy
Keywords: In-chair Movements, Interface Pressure, Centre of Pressure.
Abstract: This paper describes a program designed to detect and give a classification of the in-chair movements done
by healthy people while seated for long periods of time. The purpose of this work is to identify the
frequency, duration and typology of movements performed by subjects that need to remain seated for a
prolonged time. The software finds the time instants of each movement, its duration and whether it is in the
sagittal or the lateral plane; in particular it distinguishes between a left and right movement (in the lateral
plane) and a forward or backward trunk movement. This information can be useful in many different
domains: first of all to monitor the fidgeting phenomenon and consequently the feeling of discomfort in the
office environment; it can be adopted to evaluate the fatigue of car and truck drivers; but the most important
outcome concerns the clinical setting, in which it can be very helpful for the medical staff in determining an
appropriate and personalized rehabilitation strategy for patients with motor limitations in order to prevent
the development of pressure ulcers.
1 INTRODUCTION
Pressure ulcers are defined as areas of localized
necrosis and tissue damage of the skin, that result
from prolonged excessive loading on a support
surface (Mak, Zhang and Tam, 2010). Pressure sores
are frequent in subjects with motor and sensory-
motor limitations; among them, people with spinal
cord injuries, who are thus wheelchair bound. Their
treatment is based on pressure, shear and friction
stress reduction, on attention to bacterial
contamination and on nutritional deficit correction
(Scena and Steindler, 2011). In fact, these
individuals, especially those with limited trunk
stability and limited motor function, sit in a
wheelchair for long, consecutive periods of time,
mostly in one posture. As a consequence, pressure
ulcers can develop because of an unbalanced match
between the external load and the ability of the skin
and subcutaneous tissue to withstand that load
(Reenalda et al., 2009).
Data on prevalence of pressure sores gathered in
America and in Europe help comprehend the
dimension of the phenomenon. Prevalence values in
general are high and have been reported to be 15.5%
in U.S. healthcare facilities, with 28.0% of the
pressure ulcers located at the sacrum and 17.2% at
the buttocks (Vangilder, Macfarlane and Meyer,
2008). In Canada, the total prevalence is estimated
in about 26% (Woodbury and Houghton, 2004),
while prevalence values of 18.1% have been
reported in European standard and academic
hospitals (Vanderwee et al., 2007). In particular, in
The Netherlands and in Germany the prevalence has
been estimated in 11,1% in hospitals and 11,8% in
nursing homes (Tannen et al., 2004).
Current clinical practices for assessing the risk of
pressure ulcers focus in monitoring the intensity and
duration of interface pressure (Sakai et al., 2009),
which is defined as the pressure on the skin
occurring by contact with a surface such as a
mattress or cushion (Braden and Bergstrom, 1987;
Jones, 2005). However, despite the fact that much
research has been performed on the aetiology and
prevention of pressure ulcers, a threshold value for
the development of deep pressure ulcers, in terms of
magnitude or duration, is still lacking (Reenalda et
al., 2009). Moreover, developed pressure time
curves predict that pressure ulcers will develop even
with optimal pressure distribution (Kosiak, 1959;
Reswick and Rogers, 1976).
It is important to note that maintaining a
prolonged seating position is not a natural condition
for human beings, thus the body structure is
seriously affected by the amount of time during
which this position is sustained. However, it is
145
Marenzi E., Bertolotti G. and Danese G..
In-chair Movements of Healthy People during Prolonged Sitting.
DOI: 10.5220/0004723101450152
In Proceedings of the International Conference on Physiological Computing Systems (PhyCS-2014), pages 145-152
ISBN: 978-989-758-006-2
Copyright
c
2014 SCITEPRESS (Science and Technology Publications, Lda.)

demonstrated that healthy people are able to perform
unconscious mechanisms that preserve the integrity
of tissues (Hermann, 2005; Branton, 1969). The
little postural adjustments done to acquire a new
comfortable posture are identified as “fidgeting”
(Fenety and Walker, 2002; Fenety, Putnan and
Walker, 2000).
From a clinical point of view, the most
significant method for pressure ulcers prevention is
that of training patients to change their posture
frequently (Merbitz et al., 1985); however, there are
not many data on the correct periods for these
manoeuvres, thus useful input can be obtained by
studying the spontaneous kinematic behaviour of
healthy subjects during long periods of sitting
(Scena and Steindler, 2011). In fact, the constant
adjustment of the seated position in general is
realized through numerous movements of reduced
entity on the seat, with the aim of redistributing the
pressure stresses on the seat surface and of searching
comfort. The periodic movements on the support are
denominated in-chair movements (ICM) and they
represent the factor that prevents the development of
decubitus ulcers (Hermann, 2005). Without ICM,
every subject forced to remain in a seated position
for many hours would quickly develop pressure
sores, in particular in the ischial tuberosities (Fenety,
Putnan and Walker, 2000). However, it is not
possible to indicate a specific exposure time interval
that can be stated as the critical time for the
development of such ulcers, because it varies
according to various factors depending on the
subject and on the situation.
For this reason it would be appropriate to execute
a continuous monitoring of the interface pressure
distribution on the seat surface, in order to
immediately identify potential risk situations.
This procedure could be very useful not only in
the clinical environment, but also to evaluate the
fatigue (Nakane, Toyama and Kudo, 2011) and the
discomfort of individuals, in an unobtrusive way,
during office work and during prolonged periods of
car or truck driving (Marenzi, Bertolotti and
Cristiani, 2012).
The aim of this work is to develop a program that
identifies the time instants, duration and type of in-
chair movements executed by a seated subject. The
software has been tested on a group of 10 people to
evaluate the efficacy of the program. After the
introduction to the problem of decubitus ulcers and
their prevention through the evaluation of healthy
sitting behavior, the parameters used for the
movement identification are described, together with
the monitoring device. The third section explains the
detection algorithm, followed by the results obtained
on healthy subjects seated on a foam chair and, at
last, by conclusions and future developments.
2 IN-CHAIR MOVEMENT
DETECTION
The characterization of the behaviour of seated
people concerns the identification of the number,
frequency, duration and type of movements
executed; thus we designed an algorithm that
calculates all these features, given the data regarding
interface pressure distributions recorded during a
prolonged time.
2.1 Centre of Pressure (CoP)
From the analysis of previous studies it can be
observed that the centre of pressure (CoP) is one of
the most used parameters for studying human
posture (Bertolotti et al., 2012) and it is defined as
the point of application of the resultant of the
vertical forces that act upon the support surface
(Hermann, 2005), in this case the seat. It can be
measured in a non-invasive way and there isn’t a
unique method of calculation, because it depends on
the requirements of the specific application (Marenzi
et al., 2012).
In biomechanics, clinical settings, motor and
rehabilitation sciences, the CoP is often used to
study the feet-ground interface of a standing person;
in fact this parameter allows the recording of little
postural sways related to motor control. Other
studies use the CoP to analyse the seated position:
every time a person moves (doing the so-called
ICM) the CoP position changes too.
In this work we decided to use CoP as a
parameter for the monitoring of postural changes
during the seated position, in fact it is demonstrated
that there is a linear relationship between the
localization of CoP and the trunk lateral flexion and
tilt angles (Fenety, Putnan and Walker, 2000). A
change in CoP position can be considered the reflex
of a movement, given the following conditions: the
seat has to support the majority of the body load
(backrest, armrest and ground should have the
minimum contribution); the dynamic components
(such as the accelerations during postural shifts)
should be minimal, in order to consider the seated
posture as a succession of static positions.
When a person moves some body segments, a
pressure redistribution at the seat interface occurs,
PhyCS2014-InternationalConferenceonPhysiologicalComputingSystems
146

for this reason it is possible to register the CoP
movements in a non-invasive way through the use of
sensorized mattresses and this makes this parameter
particularly useful in evaluating the sitting behaviour
of healthy people. The coordinates are calculated as
follows:
∑
∑
(1)
∑
∑
(2)
t is the time in which the sample is acquired; n is
the total number of sensors of the mattress; P
i
(t) is
the pressure on the i
th
sensor; x
i
and y
i
are the
coordinates of the i
th
sensor
Together with the CoP, the CoP speed, that is the
amount of activity required to maintain stability
(Geurts et al., 1993), is very useful in detecting the
ICM of a seated person; the following equations
show how it is obtained (Bertolotti et al., 2012):
(3)
(4)
(5)
2.2 Materials and Methods
The algorithm has been defined using a commercial
sensorised mattress: the purpose of the work is in
fact to develop a solution that is used after the
recording done by the mattress, to evaluate the
seated posture and to give suggestions on the anti-
decubitus device and the repositioning strategy. The
device is the Novel Pliance
®
Sensor Mat 392 (Novel
Inc.), composed of 256 square capacitive sensors,
distributed on a 16x16 matrix. To obtain the pressure
data useful to develop the algorithm, 10 healthy
subjects sat for one hour on an office chair, with no
armrests and with a 5 cm thickness foam support and
they could not lean on the backrest.
The Pliance Mat records pressure distributions at
a sampling frequency of 50 Hz and produces two
different text files: the first contains the time instant
in which the sample is registered (the first column),
together with the pressure of every sensor (one row
contains a single and complete pressure map); the
second one shows, for every sample, the CoP
coordinates (in centimeters) and the total force
exercised on the mattress. We analysed these files
with Labview and designed a program that is able to
identify the ICM after a test. This program could be
used not only with the Novel Pliance Sensor Mat
but, with minimal adjustments, with every
commercial device that produces ASCII files of the
pressure data. It can be used also with a prototype
device that has been developed in the laboratory in
order to obtain a more robust, but at the same time
less expensive (compared to the other devices on the
market), electronic instrument (Marenzi et al.,
2012).
2.3 Movement Detection Algorithm
The first step in identifying the detection algorithm
is to adjust the ASCII files produced by the Novel
software into a format that is compatible with
Labview. Together with this, it is useful to reduce
the number of samples to analyse, since seated
subjects, as observed in previous works, move at
frequencies approaching 0.5 Hz (Fenety, Putnam
and Walker, 1995). In this way, we created new files
of the interface pressure distributions and of the CoP
coordinates, using a new sampling frequency of 2
Hz, to respect the Shannon Theorem. This procedure
better highlights the pressure variations on the same
sensor and on adjacent capacitors. We also
considered only the CoP coordinates and not the
force column, since the latter is not useful for our
purpose. Once the files are compliant with our
system, we didn’t analyse the first minute of
registration (the first 120 samples) because this is
the period in which a person first seats and reaches
the most comfortable posture.
2.3.1 CoP Speed Calculation and ICM
Identification
After the pre-elaboration previously described, we
calculated the CoP speed, according to equations (3),
(4) and (5), for every sample, in particular the
coordinates are recorded in centimeters using the
lowest point at the right of the matrix as the
reference, as it can be observed in Figure 1. We used
this parameter to set up a threshold that can perform
a first and basic identification of the ICM and we
chose to use 15 cm/s, because we observed that it is
appropriate to discriminate between pressure
changes due to the device reading and effective
movements. Therefore, only if the speed is above
this value, it is considered an ICM and further
processing is done (Figure 2).
In-chairMovementsofHealthyPeopleduringProlongedSitting
147
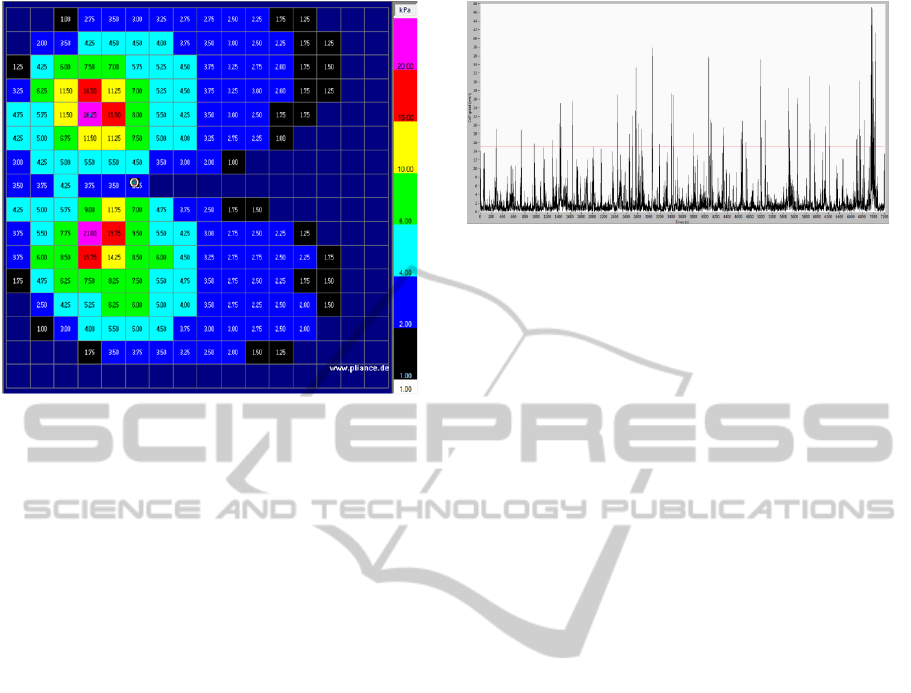
Figure 1: The image shows a pressure map, recorded with
the Novel Pliance, of one of the subjects used for the tests:
the sensors are numbered from 1 to 256, starting from the
lowest right capacitor, going ahead on the rows. The
column on the right is the pressure legend (only the lower
pressure limit of every range is written, but the matrix can
sense 60 kPa at maximum), while the grey circle
positioned between the tuberosities represents the CoP. In
the image, the ischial tuberosities are clearly visible, with
the highest pressures.
The speed value (when above the threshold) and
the corresponding time are recorded and if two or
more instants are consecutive, they are considered as
part of a single movement and only the instants to
the extremes are stored. From this procedure, we
find all the initial and final instants of the
movements according to the threshold, that form the
rows of a new table. These values however don’t
represent the real time intervals, because the CoP
speed above the threshold represents only a
sufficient condition in detecting the movements. The
later elaborations are necessary in order to define the
true time duration. Every row coincide with one
ICM, thus a portion of the file storing the pressure
maps is extracted, and more specifically, the rows
comprised in the time interval defined by the
instants found, together with the 10 s before the
initial time and the 10 s (20 samples) after the final
value.
From the matrix thus obtained, we have
eliminated three groups of sensors: the ones that are
not loaded or that never change their pressure during
the ICM and the capacitors that show variations of
only ±0,25 kPa (because in this case the difference
in pressure could not be directly correlated with a
movement but it could be due to the instrument). In
the new data set we have found all the indexes of the
Figure 2: This graph, obtained with Labview, shows the
CoP speed during one test (in black), with the threshold
value of 15 cm/s, in red: only the values above the red line
are considered for successive elaborations.
array in which there is a pressure variation and we
have selected three of them: the index that is exactly
at half the time interval, the preceding and the
following ones. This choice is made because at least
one of these values should coincide with an instant
of movement detected by the CoP speed: if this isn’t
the case, that means that the pressure variation is not
related to a movement, thus the corresponding
sensor doesn’t have to be considered. Therefore we
have checked if at least one of these indexes satisfies
the requirement. For every movement in this
category and for every sensor that varies the
pressure in the temporal interval selected, we have
divided the array of the indexes: the first sub-array
contains the first set of indexes, up to the mid-
interval one; the second comprehends all the others.
This is useful to identify the real instants of the
movement: the first element of the second sub-array
is subtracted with the last element of first sub-array
and, if they are not consecutive, it means that the
first index of the second sub-array coincides with the
initial instant of the movement. If this isn’t the case,
this procedure is repeated in decreasing order in the
first sub-array until we found two non-consecutive
indexes; then, the greater of the two represents the
initial instant. An analogous procedure has been
implemented to find the final instant of the ICM but
in this case only the second sub-array is used and we
proceeded from the beginning until we found two
non-consecutive indexes: here, the lesser is chosen
as the final instant. At last, for a single ICM we
obtained two arrays of time indexes: the first
contains the initial value from every sensor
considered and the second stores the final indexes.
To define the real interval, we chose the minimum in
the array of the initial times and the maximum of the
second array. However, since up until now we have
worked only with indexes, we converted the indexes
obtained for all movements in the corresponding
PhyCS2014-InternationalConferenceonPhysiologicalComputingSystems
148
time values. At the end we found a matrix composed
of two columns: the initial and final time instants of
all ICM. From the observation of these results, it can
be stated that sometimes two or more movements
partially overlap, mainly because the instants
identified with the CoP speed are close to each other
but not consecutive, consequently the system treats
them as separate situations. This however represents
a complex or prolonged movement, therefore in this
case we jointed all these rows to form a single ICM,
with the initial instant coinciding with the initial
value of the first movement and the final instant that
is the final one of the last movement. This procedure
will be completely automated in the next version of
the software.
2.3.2 ICM Classification
With all the ICM identified, we calculated the total
number of movements registered in a test, the
duration of each one of them, the time interval
between successive movements and the typology. A
portion of the file resulting from the elaborations is
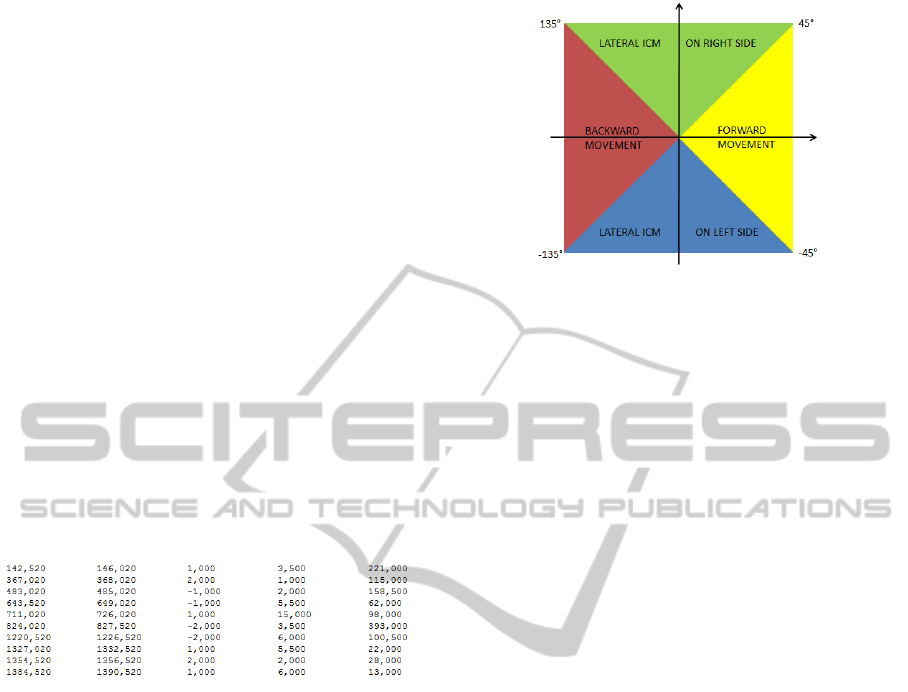
shown in Figure 3.
Figure 3: Output file of the movement detection software:
the first two columns represent the initial and final times
of an ICM, the third column shows the type of movement
(as described in detail in Figure 4), the fourth column is
the duration of the movement, while the final column
reports the interval between the current ICM and the
following one.
For this last feature we used again the CoP, in
particular, for every ICM we considered the CoP at
the beginning and we calculated the distance
between this value and all the successive CoP
coordinates during the movement. We selected the
maximum distance and thus the corresponding CoP
coordinates, in order to calculate the tangent of the
angle.
According to the value obtained, we considered
four different movements (each of them indicated
with a code number), two in the lateral and two in
the longitudinal plane (Figure 4): a movement on the
right side of the body; a movement on the left side; a
movement forward; a movement backward.
Figure 4: The image shows how the movements are
classified according to the tangent value: if the angle is
between ±45° the ICM is forward (on the longitudinal
plane, with code number of “2”); if the angle is between
45° and 135° the movement is lateral on the right side
(code “1”); if the angle is between 135° and -135° the
ICM is backward (“-2”) and if the angle is between -135°
and -45°, the movement is lateral on the left (code “-1”).
3 EXPERIMENTAL TESTS
3.1 Evaluation Tests
After completing the program, it was necessary to
test its correct functioning. For this reason, we
developed a protocol for a simple but effective
evaluation: two of the 10 healthy subjects engaged
for the successive tests (a man and a woman) sat on
the same foam chair and were asked to perform the
four ICM described at the end of chapter 2.3 in the
order in which they are written, and at prefixed time
instants (with a time interval of at least 10 s between
consecutive movements). An operator observed the
execution of the test while indicating to the subject
the instant in which to perform the repositioning and
the type of movement. Before the execution of the
first movement, after performing the last one and
between two consecutive displacements the person
remained still for 10 s or more. This sequence of
movements was repeated 10 times in each test,
resulting in 40 movements per person. The aim of
these experiments was to compare the results of the
software with the experimental conditions of the
protocol and then to determine the efficacy of the
software. The results are shown in Table 1: in one of
the subject all the movements are detected and
classified correctly, while in the other experiment
the first movement is seen as two separated ICM,
thus 41 displacements are recorded. In the second
subject the detection of lateral ICM, and in particular
between right and left displacements, is good with
In-chairMovementsofHealthyPeopleduringProlongedSitting
149

only one ICM (the first one is not a real ICM) on the
right side is considered as a left side displacement,
compared with the identification of forward versus
backward movements.
Table 1: Number, time duration, interval between
consecutive movements and typology for both subjects
involved in the tests.
ICM Subject 1 Subject 2
Total number 40 41
Lateral, right side 10 9
Lateral, left side 10 12
Forward 10 18
Backward 10 2
Time duration 1.675 3.85
Time interval 13.55 11.67
Probably subject 2 performed the longitudinal
movements with slight oscillations of the trunk that
resulted in an incorrect classification of the ICM.
However, in general, the program can detect all the
ICM performed and it can discriminate between
movements in the lateral plane from those in the
sagittal plane. Lastly, regarding the intervals
between movements, the seconds subject shows a
mean value that is closer to the 10 s indicated, but in
both cases, the values are near the reference. One
ulterior important comment is that the 10 s time
interval is not reported by a watch or a similar
instrument as the fixed amount of time that has to
elapse between two consecutive movements, but
represents only the minimum time that has to pass
before executing the new ICM; thus values greater
than 10 s are correct.
3.2 Tests on Healthy Subjects
The program has been used on a group of 10 healthy
subjects that were asked to seat on a foam chair for 1
hour while performing some office task at the PC
(e.g. reading a document, browsing the Internet).
The group is composed of 5 men and 5 women, with
age of 37 ± 12 years. We recorded height, weight
and BMI (Body Mass Index) for everyone, as shown
in Table 2, while the total number of ICM done by
the subjects during the tests and the statistical values
are shown in Tables 3 and 4.
In all cases the standard deviations are high, even
when the two subjects with highest number of ICM
are eliminated from the calculus. This indicated that
the number of movements (and thus the feeling of
discomfort) is highly subjective, thus it is not
sufficient to evaluate the behaviour of seated people.
Maybe the number of ICM performed is correlated
with some anatomical characteristics of the subjects:
Table 2: Physical characteristics of the subjects tested; the
first column indicates the gender.
SUBJECT WEIGHT (kg) HEIGHT (m) BMI
M 1 65 1.74 21.47
F 1 59 1.68 20.9
M 2 65 1.77 20.75
M 3 90 1.85 26.3
M 4 70 1.85 20.45
M 5 85 1.77 27.13
F 2 55 1.70 19.03
F 3 53 1.65 19.47
F 4 55 1.68 19.49
F 5 65 1.63 24.46
Table 3: Total number of ICM performed by the test
people during the 1hour recordings.
SUBJECT NUMBER OF ICM
M 1
41
F 1
19
M 2
167
M 3
18
M 4
84
M 5
29
F 2
59
F 3
27
F 4
78
F 5 102
Table 4: Mean and standard deviation for all the subjects
and for the two genders, also without one subject in both
genders that is considered an outlier because the number
of ICM is significantly higher compared to the other
people.
SUBJECTS MEAN STANDARD
DEVIATION
all
62.4 47.04
males
63.4 46.11
females
58 31.55
all with outliers
53.5 30.59
males no outliers
55.1 30.07
females no outliers
55.6 28.61
to verify this hypothesis, a new set of experiments
are planned and related results will be presented in a
further publications. The duration of the ICM also
has been evaluated (Table 5): depending on the
person, the interval of movement can be
homogeneous or quite different, but in this case
there is no such difference among the subjects, like
in the case of the number of ICM. In particular, it
can be observed that the mean duration varies
between 2.32 s and 6.74 s, but the majority of the
people performs movements that last about 4-5 s in
general. Regarding the time interval between
consecutive movements (Table 6), it can be noted
PhyCS2014-InternationalConferenceonPhysiologicalComputingSystems
150

that the lower the number of ICM done, the higher
the time intervals are, and vice versa. This leads to
conclusions analogous to the case of the total
number of movements: in fact, among the people
involved in these tests there is high variability. At
last, we considered the typology of ICM executed by
every subject (Table 7): in general, the most
common ICM are the lateral displacements (372 out
of 618, more than half the total movements), with
prevalence on the right side. This is a symptom that
the ischial tuberosities, being the areas with the
highest pressures, in a prolonged seated position,
need to be unloaded and the lateral ICM seems to be
the better solution.
Table 5: Mean time duration and statistical parameters of
all the ICM, for every subject.
SUBJECT MEAN
(s)
STANDARD
DEVIATION
M 1 6.74 5.54
F 1 2.32 2.45
M 2 4.24 5
M 3 5.69 2.76
M 4 4.11 2.8
M 5 3.5 2.83
F 2 4.42 3.2
F 3 3.33 1.9
F 4 3.22 3.77
F 5 2.71 2.07
Table 6: Mean time intervals between consecutive
movements for every subject.
SUBJECT MEAN
(s)
STANDARD
DEVIATION
M 1 6 5.87
F 1 182.44 397.57
M 2 17.19 19.87
M 3 102.77 91.9
M 4 39.01 39.49
M 5 123.75 139.41
F 2 57.23 68.57
F 3 130.08 181.3
F 4 43.32 44.55
F 5 31.9 42.65
However, also the discomfort plays a role when a
person seats for long periods of time, therefore even
movements in the sagittal plane are necessary. The
fact that the forward displacements are fewer than
those backward, can be explained by remembering
that the subjects could not lean on the backrest, thus
they were induced in a curved forward position;
therefore, the better way to relieve the spinal column
was to move backward.
Table 7: Total number of movements for every typology,
for every subject and in all the tests.
Subject Right
lateral
Left
lateral
Forward Backward
M 1 13 6 6 10
F 1 6 7 1 5
M 2 76 52 5 34
M 3 5 9 2 2
M 4 32 19 12 21
M 5 12 7 3 7
F 2 11 18 8 22
F 3 2 2 5 18
F 4 23 19 21 28
F 5 34 19 21 28
Total 214 158 74 172
4 CONCLUSIONS AND FUTURE
DEVELOPMENTS
This paper describes a program that identifies the in-
chair movements, that can be used in various
domains: from the clinical environment to prevent
pressure sores, to the automotive field to evaluate
fatigue and discomfort, and in ergonomics for the
design of office chairs and armchairs. In particular,
regarding the clinical setting, it is believed that
studying the behaviour of healthy seated people
could be useful and important in evaluating effective
strategies for the prevention of pressure ulcers
(mainly in the decubitus area). The software is able
to detect the ICM and records the time extremes of
each movement, its duration, the typology and the
interval between consecutive movements. It has
been tested on two subjects to evaluate the
effectiveness of the algorithm and after that, 10
healthy people were enrolled in a prolonged test.
The results show that the system can correctly detect
the movements and also differentiate between
different displacements, thus it can be implemented
with bigger sets of pressure data. Future
developments of the program can involve a better
detection of the appropriate movement typology,
with the aim of finding a more precise way to define
it. The software will be also applied for further
experimental tests with healthy people, in order to
better characterize their behaviour in many more
conditions. Regarding medical applications, the
program will be implemented in clinical experiments
involving patients hospitalized in rehabilitation
structures, in order to evaluate and compare the
behaviour of people with motor limitations and
disabilities. The aim is twofold: on one hand it is
very important to prevent the development of
In-chairMovementsofHealthyPeopleduringProlongedSitting
151

decubitus ulcers, thus it is necessary to find the
appropriate and personalized prevention strategy,
that can involve self-repositioning and the use of
new devices for the redistribution of the body load
on the seat support. On the other hand, this program
can be useful for the medical personnel to monitor
the various phases of the rehabilitation and to help in
evaluating the progresses made.
REFERENCES
Bertolotti, G. M., Cristiani, A., Lombardi, R., Serbedzija,
N., 2012. The seat adaptation system of REFLECT
Project: implementation of a biocybernetic loop in an
automotive environment. In: IEEE, 15
th
Euromicro
Conference on Digital System Design (DSD), 2012.
Izmir, Turkey 5-8 September 2012. IEEE.
Braden, B., Bergstrom, N., 1987. A conceptual schema for
the study of the etiology of pressure sores.
Rehabilitation Nursing, 12(1), pp. 8–12.
Branton, P., 1969. Behavior, body mechanics and
discomfort. Ergonomics, 33, pp. 316-327.
Fenety, P. A., Putnan, C., Walker, J. M., 2000. In-chair
movement: validity, reliability and implications for
measuring seat comfort. Appl. Ergonomics, 31, pp.
383-393.
Fenety, P. A., Walker, J. M., 2002. Short-term effects of
workstation exercises on musculoskeletal discomfort
and postural changes in seated video display unit
workers. Phys. Therapy, 83(6), pp. 578-589.
Geurts, A. C., Nienhuis, B., Mulder, T.W., 1993. Intra-
subject variability of selected force-platform
parameters in the quantification of postural control.
Arch. Phys. Med. Rehabil. 74(11), pp. 1144-1150.
Hermann, S., 2005. Exploring sitting posture and
discomfort using nonlinear analysis methods. IEEE
Transactions of Information Technology in
Biomedicine, 9(3), pp. 392-401.
Jones, J., 2005. Evaluation of pressure ulcer prevention
devices: a critical review of the literature. Journal of
Wound Care, 14(9), pp. 422–425.
Kosiak, M., 1959. Etiology and pathology of ischemic
ulcers. Arch Phys Med Rehabil, 40(2), pp. 62-69.
Mak, A. F. T., Zhang, M., Tam, E. W. C., 2010.
Biomechanics of pressure ulcer in body tissues
interacting with external forces during locomotion.
Annu. Rev. Biomed. Eng., pp. 29–53.
Marenzi, E., Lombardi, R., Bertolotti, G.M., Cristiani, A.,
Cabras, B., 2012. Design and development of a novel
capacitive sensor matrix for measuring pressure
distribution. In: IEEE, Sensors Applications
Symposium (SAS) 2012. Brescia, Italy 7-9 February
2012. IEEE.
Marenzi, E., Bertolotti, G. M., Cristiani, A., 2012. Design
and development of a monitoring system for the
interface pressure measurement of seated people.
IEEE Transactions on Instrumentation and
Measurement, 62(3), pp. 570-577.
Merbitz, C. T., King, R. B., Bleiberg, J., Grip, J. C., 1985.
Wheelchair push-ups: measuring pressure relief
frequency. Arch. Phys. Med. Rehabil., 66, pp. 433-
438.
Nakane, H., Toyama, J., Kudo, M., 2011. Fatigue
detection using a pressure sensor chair. In: IEEE,
International Conference on Granular Computing.
Kaohsiung, Taiwan 8-10 November 2011, pp. 490-
495. IEEE.
Novel. [online] Available at: <http://www.novel.de>.
Reenalda, J., Van Geffen, P., Nederhand, M., Jannink, M.,
IJzerman, M., Rietman, H., 2009. Analysis of healthy
sitting behavior: interface pressure distribution and
subcutaneous tissue oxygenation. Journal of
Rehabilitation Research & Development, 46(5),
pp.577-586.
Reswick, J. B., Rogers, J. E., 1976. Experience at Rancho
Los Amigos Hospital with devices and techniques to
prevent pressure sores.
Bedsore biomechanics, pp.
301-310.
Sakai, K., Sanada, H., Matsui, N., Nakagami, G., Sugama,
J., Komiyama, C., Yahagi, N., 2009. Continuous
monitoring of interface pressure distribution in
intensive care patients for pressure ulcer prevention.
Journal of advanced nursing, 65(4), pp. 809-817.
Scena, S., Steindler, R., 2011. A facility for the study of
pelvis and trunk displacements during sitting posture.
Strain, 47, pp. 426-431.
Tannen, A., Dassen, T., Bours, G., Halfens, R., 2004. A
comparison of pressure ulcer prevalence: concerted
data collection in the Netherlands and Germany.
International Journal of Nursing Studies, 41, pp. 607-
612.
Vanderwee, K., Clark, M., Dealey, C., Gunningberg, L.,
Defloor, T., 2007. Pressure ulcer prevalence in
Europe: A pilot study. Journal Eval. Clin. Pract.,
13(2), pp. 227-235.
Vangilder, C., Macfarlane, G. D., Meyer, S., 2008. Results
of nine international pressure ulcer prevalence
surveys: 1989 to 2005. Ostomy Wound Manage, 54(2),
pp. 40-54.
Woodbury, M. G., Houghton, P. E., 2004. Prevalence of
pressure ulcers in Canadian Healthcare settings.
Ostomy Wound Management, 50, pp. 22-38.
PhyCS2014-InternationalConferenceonPhysiologicalComputingSystems
152
