
An EOG-based Sleep Monitoring System and Its Application on On-line
Sleep-stage Sensitive Light Control
Chih-En Kuo
1
, Sheng-Fu Liang
3
, Yi-Chieh Li
2
, Fu-Yin Cherng
2
, Wen-Chieh Lin
2
, Peng-Yu Chen
3
,
Yen-Chen Liu
3
and Fu-Zen Shaw
1
1
The Institute of Cognitive Science, National Cheng Kung University, Tainan, Taiwan
2
Department of Computer Science, National Chiao Tung University, Hsinchu, Taiwan
3
Department of Computer Science and Information Engineering, National Cheng Kung University, Tainan, Taiwan
Keywords:
Sleep, Sleep Stage, Adaptive System, Electrooculogram (EOG), Interaction Design, Sleep Quality.
Abstract:
Human beings spend approximately one third of their lives sleeping. Conventionally, to evaluate a subjects
sleep quality, all-night polysomnogram (PSG) readings are taken and scored by a well-trained expert. The
development of an automatic sleep-staging system that does not rely upon mounting a bulky PSG or EEG
recorder on the head will enable physiological computing systems (PhyCS) to progress toward easy sleep and
comfortable monitoring. In this paper, an electrooculogram (EOG)-based sleep scoring system is proposed.
Compared to PSG or EEG recordings, EOG has the advantage of easy placement, and can be operated by
the user individually. The proposed method was found to be more than 83% accurate when compared with
the manual scorings applied to sixteen subjects. In addition to sleep-quality evaluation, the proposed system
encompasses adaptive brightness control of light according to online monitoring of the users sleep stages.
The experiments show that the EOG-based sleep scoring system is a practicable solution for home-use sleep
monitoring due to the advantages of comfortable recording and accurate sleep staging.
1 INTRODUCTION
In recent years, physiologically sensing technologies
have been applied to human computer interaction.
They can not only help people with disabilities but
also be integrated into general user interfaces used by
healthy people. They also create more diverse inter-
active ways and help users keep healthy (Silva et al.,
2011). Electrooculography (EOG), which measures
our eye movement, is a kind of physiological sensing
technologies. Several studies in the human computer
interaction (HCI) field have shown that EOG can
be used to track eye gazes (Manabe and Fukumoto,
2006; Bulling et al., 2009). In addition to detecting
eye gazes, a recent study also suggested that EOG can
be used to classify people’s sleep stage(Virkkala et al.,
2007).
Sleep is important for human health. Sleep dis-
eases, such as insomnia and obstructive sleep ap-
nea, seriously affect quality of life. Sleep is not
a static stage but a dynamic process (Rechtschaf-
fen and Kales, 1968). Sleep can be divided into
six periods: wakefulness (Wake); the four stages
of non-rapid eye movement (NREM, numbered 1-
4); and rapid eye movement (REM). Stages 3 and 4
have also been combined, and referred as the slow
wave sleep stage (SWS). Conventionally, to evaluate
a subjects sleep quality, all-night PSG tests includ-
ing electroencephalograms (EEG), EOG, and elec-
tromyograms (EMG) are usually recorded and scored
by a well-trained expert (Rechtschaffen and Kales,
1968). Due to their high cost and bulk, conventional
PSG systems are not suitable for sleep recording at
home. Some easy-to-use alternative products such as
Fitbit, Bodymedia Fit, and Zeo, along with the corre-
sponding analysis software, have been developed for
home sleep testing.
The HCI field has begun to take note of sleep-
related issues (Aliakseyeu et al., 2011; Choe et al.,
2011), and additional interaction designs to aid sleep
have been proposed. Several studies identify factors
that would affect sleep quality, and provide sugges-
tions to improve it (Stepanski and Wyatt, 2003). In
addition to self-management, advances in interaction
designs may assist users to achieve better sleep qual-
ity and habits (Aliakseyeu et al., 2011). One prior
20
Kuo C., Liang S., Li Y., Cherng F., Lin W., Chen P., Liu Y. and Shaw F..
An EOG-based Sleep Monitoring System and Its Application on On-line Sleep-stage Sensitive Light Control.
DOI: 10.5220/0004725600200030
In Proceedings of the International Conference on Physiological Computing Systems (PhyCS-2014), pages 20-30
ISBN: 978-989-758-006-2
Copyright
c
2014 SCITEPRESS (Science and Technology Publications, Lda.)

study (Bauer et al., 2012) applied the concept of pe-
ripheral display to the design of mobile applications
that can encourage users to keep good sleeping habits.
There are also various systems using sensors on mo-
bile phones to help users record sleep stages (Law-
son et al., 2013) and to understand their sleep quality.
Some products focus on waking users up by adjusting
light levels during the period near the preset wake-up
time, e.g., the Philips Wake-up Light.
Choe et al. (2011) have indicated many factors af-
fecting sleep quality, including caffeine, the bedroom
environment, and fears. Aliakseyeu et al. (2011),
meanwhile, have suggested several design opportuni-
ties for improving sleep, some of which would need
the support of real-time sleep-stage monitoring. In-
deed, the results of these studies inspired us to de-
velop an automatic scoring system. Recently, several
proposals have been made for phone-based applica-
tions (apps) and wearable devices to monitor sleep ef-
ficiency (wake-sleep states), using accelerometers to
detect body movements during sleep. These devices
are easy to use, but cannot accurately recognize sleep
stages and they may not function at all if used other
than in bed, e.g. while having a nap in the office. The
development of an online sleep-staging system that
does not require the mounting of a bulky PSG sys-
tem on the head will allow PhyCS to progress toward
easier sleep and more comfortable monitoring.
This paper proposes an EOG-based sleep moni-
toring system including EOG acquisition and a sleep-
staging method based on EOG signal analysis. Com-
pared to all-night PSG or EEG recordings, EOG has
the advantage of easy placement, and can be mea-
sured by the individual user without assistance. An
automatic EOG sleep-scoring method integrating the
time-domain EOG feature analysis and a linear clas-
sifier is proposed. The agreement between the pro-
posed method and the expert scoring is higher than
83%, placing it within the range of inter-score agree-
ment (Norman et al., 2000). Active control of envi-
ronmental light/brightness, based on online monitor-
ing of the users sleep stages by the proposed system,
is also demonstrated.
2 BACKGROUND AND RELATED
WORK
2.1 Stages of Sleep
Depending on whether EEG, EOG, or EMG has been
utilized, sleep states can be roughly separated into
NREM and REM sleeps, which alternate throughout
a night in a roughly 90-minute cycle. In wakeful-
ness with the eyes closed, alpha rhythms (8-13 Hz)
can be observed using EEG in more than 50% of each
epoch (i.e. each 30 seconds of data). According to
the American Academy of Sleep Medicine (AASM)
manual for the scoring of sleep (Iber, 2007), NREM
sleep can be further classified into three stages: stage
1 (S1), stage 2 (S2) and SWS. S1 is a transitional
stage from wakefulness to sleep. In S1, alpha rhythms
are attenuated and replaced by low-amplitude, mixed-
frequency activity (4-7 Hz) for more than 50% of the
epoch, coupled with slow eye movements (SEM) and
vertex sharp waves (V waves). S2 is characterized by
sleep spindles with frequencies of 11-16 Hz, and/or
K complexes. Stage SWS is defined by 20% or more
of an epoch consisting of slow wave activity, that is,
waves of frequency 0.5-2 Hz and peak-to-peak ampli-
tude > 75 µ V. In REM sleep, low-amplitude, mixed-
frequency activity (4-7 Hz) similar to that in S1 can
be observed via EEG, in combination with rapid eye
movements and low chin EMG tone. Therefore, sleep
stages can be distinguished from one another by ob-
serving different waveform patterns in EEG, EOG and
EMG.
2.2 PhyCS for Sleep
In addition to assistive technologies for healthy living,
researchers have started to develop PhyCSs that inte-
grate sensing and computing technologies to support
healthy sleep. Choe et al. (2011) conducted large-
scale surveys and interviews to identify the design
opportunities for supporting healthy sleep. Accord-
ing to their study, healthy people care almost as much
about their sleep quality as insomnia patients do. In-
stead of clinical sleep diagnosis based on all-night
PSG recording (including EEG, EOG and EMG), new
portable recording devices with automatic analysis
software have been developed for home applications;
these include Zeo
R
, Fitbit
R
, and Bodymedia
R
. In
addition, a number of phone apps have been devel-
oped to help users analyze their sleep processes (Law-
son et al., 2013). The main purposes of these tech-
nologies are to monitor users sleep quality and to re-
mind them of their sleep problems. Prior study (Ali-
akseyeu et al., 2011) has suggested some interaction
designs for sleep applications, which may help people
to enhance sleep quality, and accommodate the differ-
ing sleep habits of individuals.
2.3 Sleep Monitoring Devices
Recently, many novel techniques for online moni-
toring of physiological signals have been developed
AnEOG-basedSleepMonitoringSystemandItsApplicationonOn-lineSleep-stageSensitiveLightControl
21

to help patients with sleep disorders (Chandra et al.,
2012). Patients can wear wireless sensors that al-
low caregivers to monitor their conditions and provide
help when needed (Silva et al., 2011). Some prod-
ucts for improving sleep quality have already reached
the market, and these include both sleep-management
systems and sleep clocks (Kay et al., 2012). It is rea-
sonably clear that people have begun to pay particular
attention to their sleep efficiency and quality. A sleep-
management system usually consists of one or more
sensors and a monitoring system (or a user interface).
A user wears the sensors on their body and pre-sets
up a wake-up time; the system will then wake up the
user at a proper sleep stage at or before the wake-up
time.
Zeo is a sleep-management product, shaped like
a sports headband with three sensors attached on the
forehead. Fitbit provides the user with a sleep qual-
ity score by measuring how long they sleep and how
many times they wake up. Fitbit also has a silent
wake-up alarm that gently vibrates to wake up the
user by their preset time. The functionalities of Body-
media Fit are similar to those of Fitbit. It lets users
know the quality and efficiency of their sleep. In gen-
eral, Zeo, Fitbit and Bodymedia Fit provide users with
helpful information such as sleep efficiency (wake-
sleep states) for sleep management; however, they
may not be able to accurately recognize the whole
range of sleep stages.
2.4 EOG-based Sleep Scoring Method
Wearable EOG systems have been used for eye track-
ing in the past. They are easy to use and do not ob-
scure users field of view. For example, Bulling et al.
(2009) embedded an EOG system into goggles that
can recognize eye gestures in real time (Bulling et al.,
2009). Manaby and Fukumoto also attempted to de-
sign an all-day-wearable gaze detector based on EOG
(Manabe and Fukumoto, 2006). These systems show
that EOG can potentially be used in our daily life.
Besides eye tracking, Virkkala et al. (2007) fur-
ther proposed that EOG can be utilized to classify
sleep stages effectively. The agreement between com-
puter analysis/scoring of EOG signals, on the one
hand, and the expert scoring of PSG signals is nearly
73%. This is not in the range of inter-score agree-
ment (>82%, Norman et al., 2000), but if its accuracy
can be improved, the EOG-based sleep staging sys-
tem will be a very practicable solution for home-use
sleep monitoring, due to the advantages of comfort-
able recording (as compared to PSG) and complete
sleep staging (as compared to actigraphy).
3 AN EOG-BASED AUTOMATIC
SLEEP SCORING METHOD
Our EOG-based sleep-stage scoring method includes
three parts: preprocessing, feature extraction, and
classification. The following subsections introduce
each part in greater detail.
3.1 Preprocessing
The sampling rate of our EOG signals is 256 Hz. Ac-
cording to Rechtschaffen and Kales (1968) (hereafter,
R&K rules), the major brain activity during sleep con-
sists of low-frequency rhythms (< 30 Hz), and there-
fore an eighth-order Butterworth band-pass filter with
a 0.5-30 Hz pass-band is used to filter the recordings
for artifact rejection and enhancement of sleep-related
physiological activities. Multi-scale entropy (MSE)
has been used to analyze the filtered signals, as rec-
ommended by (Costa et al., 2005). In addition, an
eighth-order Butterworth band-pass filter with a 4-8
Hz pass-band is utilized to extract the theta band com-
ponents for the autoregressive (AR) model, as recom-
mended by (Pardey et al., 1996).
3.2 Feature Extraction
Our feature extraction process includes: (a) MSE, (b)
AR modeling, and (c) multi-scale line length (MLL).
The MSE is the principal foundation of the method;
the AR model and the MLL are complementary fea-
tures for increasing the classification accuracy of S1
and REM.
a) Multi-scale Entropy. MSE is a signal-analysis
method recently proposed by Costa et al. (2005). It
estimates the complexity associated with the long-
range temporal correlation of a time series. Instead
of using a single scale, MSE measures the complex-
ity of a time series by considering entropy at multi-
ple temporal scales. MSE has been used to analyze
the complexity of various biomedical signals such as
EEG (Kang et al., 2009; Liang et al., 2012; Takahashi
et al., 2009), ECG (Costa et al., 2005), and heart rate
(Costa et al., 2003; Norris et al., 2008).
Given an EOG time series with N samples, x =
{
x
1
, x
2
, x
3
, ··· , x
N
}
, the original time series is divided
into non-overlapping time windows of length τ, which
is defined as the scale factor. A coarse-gained time
series y
τ
( j) is then calculated by averaging the data
points inside a time window,
y
τ
( j) =
1
τ
jτ
∑
i=( j−1)τ+1
x
i
, 1 ≤ j ≤
N
τ
(1)
PhyCS2014-InternationalConferenceonPhysiologicalComputingSystems
22

After obtaining each element of the coarse-gained
time series for each scale τ, the entropy of each
coarse-gained time series is calculated. Theoretically,
if the complexity of the signal is greater, the en-
tropy value will be higher. Relatively, the entropy
value is smaller. Two popular approaches for physi-
ological time series analysis are approximate entropy
(ApEn)(Pincus, 1995) and sample entropy (SampEn)
(Richman and Moorman, 2000). SampEn was pro-
posed to overcome some limitations of ApEn, such as
bias caused by incorrect counting of self-matches to
avoid the occurrence of a natural logarithm of zero in
the calculation. Therefore, in this paper, SampEn has
been utilized to calculate the entropy of the EOG time
series. More details of SampEn can be found in Rich-
man and Moorman (2000). The windows of length
τ are set as 1-8, and therefore we have eight entropy
values corresponding to different time resolutions, ex-
tracted as the features after MSE analysis.
b) Autoregressive Model. An AR model is
a parametric model used to describe a stationary
time series. It is a popular tool for EEG analysis
(Berthomier et al., 2007; Olbrich et al., 2003; Thakor
and Tong, 2004). AR models represent the current
value of a time series x(t) as the weighted sum of its
previous values x(t −i) and an uncorrelated error ε(t),
x(t) =
p
∑
i=1
a
i
x(t − i) + ε(t), (2)
where a(i) is the AR coefficients and p is the order of
the AR model. In this paper, we compute a(i) and p
from the theta band signals (4-8 Hz) extracted by an
eighth-order Butterworth band-pass filter in the pre-
processing phase. The computed a(i) and p are used
to determine EOG states.
c) Multi-scale line length. MLL calculates the
line length for each coarse-gained time series. The
line length LL of a time series is the sum of the verti-
cal distance (absolute difference) between successive
samples of the time series (Esteller et al., 2001),
LL =
1
N − 1
N−1
∑
i=1
|x
i+1
− x
i
|, (3)
where x is the time series considered, i represents the
temporal index of the time series, and N is the total
length of the time series.
Line length reflects changes of waveform dimen-
sionality and is a measurement sensitive to variations
of signal amplitude and frequency (Guo et al., 2010).
MLL has the advantage of low computational com-
plexity and is therefore suitable for online applica-
tions. It has also been used for automatic epileptic-
seizure detection in EEG (Esteller et al., 2001).
A total of 24 features, including 13 MSE values,
eight AR coefficients, and three MLL values are ex-
tracted from the EOG signals and fed in to a linear
classifier for sleep-stage classification.
3.3 Classifier
Due to its low computational cost, we chose to uti-
lize linear discriminant analysis (LDA) to classify five
sleep stages based on the extracted MSE values, AR
coefficients and MLL values. In addition, we wanted
to ensure that the proposed EOG features were effec-
tive to a point that sleep stages could be determined
simply using a linear classifier.
a) Linear discriminant analysis. LDA finds a
hyperplane that best separates two or more classes
of objects or events by adjusting the linear weighting
of their features. Usually, the within-class, between-
class, and mixture scatter matrices are used to for-
mulate the criteria for searching the hyperplane (Lin
et al., 2008; Kuo and Landgrebe, 2004). In order to
test the generalization ability of the proposed method,
the EOG data of 16 subjects were used to train the
LDA classifier, while the EOG data of a different
group of 16 subjects were used to verify the perfor-
mance of our proposed method.
b) Smoothing. Sleep-stage scoring has periodic-
ity and continuity from light to deep (R&K rules). Af-
ter classifying the sleep stage using LDA, some mis-
classified epochs can be corrected according to tem-
poral contextual information and R&K rules, which
refer to the relation between epochs prior and poste-
rior to the current epoch. For example, three consecu-
tive epochs consisting of S2, REM, and S2 should be
followed by the sequence S2, S2, S2. Similarly, con-
secutive epochs of REM, S1 and REM should be fol-
lowed by the sequence REM, REM, REM. Following
the protocols established by Iber (2007) and Virkkala
et al. (2007)(Iber, 2007; Virkkala et al., 2007), a to-
tal of 10 rules were utilized to smooth the final re-
sults and increase the accuracy of our method. Table
1 shows the 10 smoothing rules we followed.
4 SLEEP-STAGE SCORING
EXPERIMENT
4.1 Subjects and Recordings
All-night PSG sleep recordings were obtained from
32 healthy subjects (18 males and 14 females) rang-
ing in age from 18 to 24 years. The subjects were
interviewed about their sleep quality and medical his-
tory. Their sleep efficiency ranged from 56% to 97%.
AnEOG-basedSleepMonitoringSystemandItsApplicationonOn-lineSleep-stageSensitiveLightControl
23

Table 1: List of smoothing rules.
Rule No. Modification
1 An REM Epoch before the very first
appearance of SWS are replaced with
Wake epochs.
2 Wake, REM, S2 → Wake, S1, S2
3 S1, REM, S2 → S1, S1, S2
4 S2, S1, S2 → S2, S2, S2
5 S2, SWS, S2 → S2, S2, S2
6 S2, REM, S2 → S2, S2, S2
7 SWS, S2, SWS → SWS, SWS, SWS
8 REM, Wake, REM → REM, REM,
REM
9 REM, S1, REM → REM, REM, REM
10 REM, S2, REM → REM, REM, REM
None of them reported any history of neurological
or psychological disorders. The PSG recordings of
each subject were made using six EEG channels (F3-
A2, F4-A1, C3-A2, C4-A1, P3-A2, and P4-A1, fol-
lowing the international 10-20 standard system), two
EOG channels (the above-right and below-left outer
canthus), and a chin EMG channel, and were ac-
quired through the Siesta 802 PSG (Compumedics,
Inc.). The sampling rate was 256 Hz with 16-bit
resolution. The filter settings of the cut-off frequen-
cies were 0.5-30 Hz for EEG/EOG, and 5-100 Hz for
EMG. These nine-channel signals were used for man-
ual scoring, as suggested by the R&K rules, whereas
only the EOG data were used for the single-channel
sleep-stage scoring system being developed.
The 32 PSG sleep recordings were visually scored
by a sleep specialist using the R&K rules. Each 30-
second epoch was classified into Wake, REM, S1,
S2, SWS, and movement artifacts. In our exper-
iments, only epochs of the five sleep stages were
used; epochs of movement artifacts were rejected
(Berthomier et al., 2007; Schaltenbrand et al., 1996).
4.2 Performance Evaluation
Next, we evaluated the performance of our automatic
EOG-based sleep-scoring method. The performance
criterion was the agreement between computer scor-
ing, on the one hand, and expert scoring based on
all PSG channels. The proposed systems sensitivity
corresponding to each sleep stage is shown in Ta-
ble 2. The rows represent the results arrived at by
the experts visual scoring, and the columns represent
the results of our method. The sensitivities of the
proposed automatic stage-scoring method that were
associated with the five sleep stages were 81.45%
(Wake), 28.05% (S1), 88.12% (S2), 83.06% (SWS)
and 81.05% (REM), yielding an overall sensitivity of
83.33%. The sensitivities for all stages except for
S1 were higher than 81%. S1 can easily be mis-
categorized as any of the other stages except SWS,
and the number of S1 epochs is significantly lower
than that of other stages epochs. As such, it is dif-
ficult to create a model with a high sensitivity for
S1. Rosenberg et al. (Rosenberg et al., 2013) report
that inter-scorer agreement in a large group is approx-
imately 83% under current manual scoring rules, a
level similar to that reported for agreement between
expert scorers.
Comparing the recognition results achieved by the
present study against the existing, purely EOG-based
sleep-stage scoring method proposed by (Virkkala
et al., 2007), overall agreement has increased from
73% to 83%. The results of the method in Virkkala
et al. are Wake, 79.7%; S1, 30.6%; S2, 79.7%; SWS,
75.9%; and REM, 75.6%. As detailed in the preced-
ing paragraph, our method performed better in four of
the five stages (Wake, S2, SWS, and REM), and with
regard to the remaining stage, the results are similar
(28% vs. 30.6%).
5 LIGHTING CONTROL SYSTEM
BASED ON SLEEP STAGES
In addition to sleep quality evaluation, it is worth con-
sidering whether a comfortable sleep monitor can be
utilized to control the sleep environment. Accord-
ingly, the present research also incorporated an active
brightness-control system governed by online moni-
toring of the users sleep stages.
People can now purchase various lighting prod-
ucts that mimic the effect of natural sunlight. For
example, the Philips Wake-up Light
c
is a dawn-
simulation product that allows users to set up their
wake-up time, the period of dawn or dusk simulation,
and the maximal light intensity. This and other dawn-
dusk simulation products gradually modify light in-
tensity to simulate natural ambient light and help
users fall sleep and/or wake up (Fontana Gasio et al.,
2003; Fromm et al., 2011; Gim
´
enez et al., 2010).
However, these dawn-dusk simulation products do not
take any account of the users sleep stages. In partic-
ular, since every persons sleep pattern is different and
may vary from time to time, changing light intensity
according to a preset fixed program may not be ap-
propriate, and even disturb a users sleeping partners
who have different bedtime or wake-up time. Hence,
it is desirable to develop an adaptive system that can
dynamically adjust its lighting to let each user sleep
and wake up gradually and individually.
PhyCS2014-InternationalConferenceonPhysiologicalComputingSystems
24
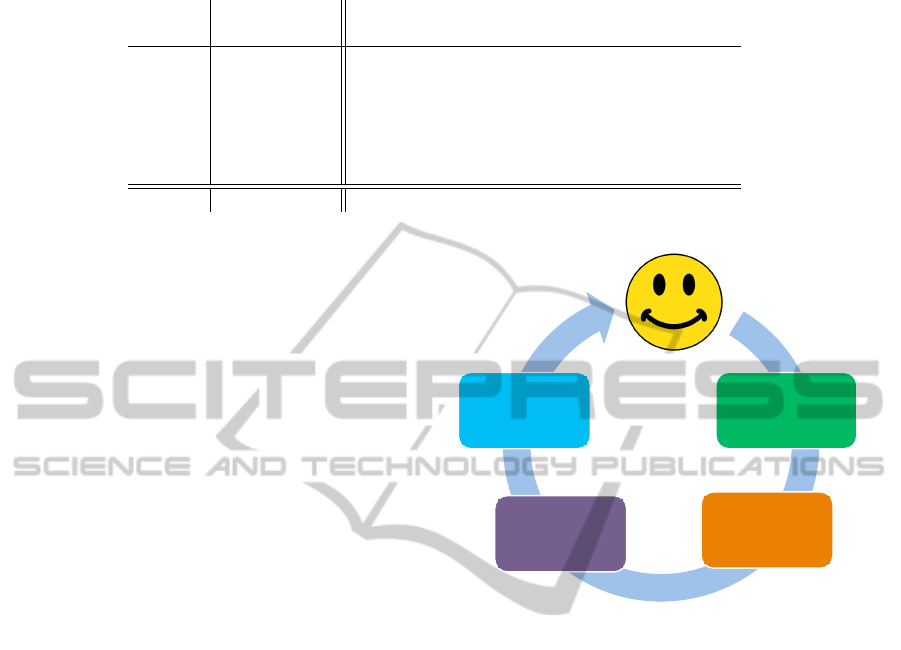
Table 2: Confusion matrix of five-stage classification comparing the proposed EOG-based sleep scoring and manual sleep
scoring based on PSG recordings.
EOG system
Wake S1 S2 SWS REM SE(%)
Expert Wake 1094 55 33 11 150 81.45
S1 100 124 76 8 134 28.05
S2 28 203 5880 380 177 88.18
SWS 5 1 376 1884 2 83.06
REM 39 326 116 2 2129 81.05
Overall 83.33
Kappa 0.75
As a separate issue, light is important for safety,
and especially for avoiding falling injuries at night.
According to the American Association of Neurolog-
ical Surgeons (AANS), falling down is the most com-
mon cause of death for people aged 65 or older. Chil-
dren under the age of 4 are also at a high risk of head
injury from falling in and around the home. To reduce
the risk of falls, a function that automatically turns on
appropriate lighting when a user wakes up at midnight
must be considered.
5.1 System Requirements and Design
Concept
In order to extend the PhyCSs-based sleep analysis for
actively controlling the sleep environment, we have
developed a lighting-control system that adaptively
varies its brightness based on the users sleep stage.
Following on from the discussion in the previous sec-
tion, our system was intended fulfill the following re-
quirements: a) Use online technology to classify a
users sleep stages; b) Use online technology to ad-
just the lighting of the sleep environment according
to the users sleep stages; c) During hours of darkness,
provide faint light when the user wakes up and moves,
to avoid falling; d) Wake up the user during a proper
sleep stage (i.e. S1, S2 and REM) at or before the
user-specified wake-up time; and e) Record and pro-
vide sleep information including sleep period, total
sleep time, sleep latency, and sleep efficiency so that
the user can learn about their sleep pattern. Figure
1 shows the concept and architecture of our adaptive
light system. The processing steps were as follows:
1. A portable wireless EOG recording unit was used
to record the users sleep EOG online.
2. The EOG signal was sent to a personal computer
via wireless transmission.
3. An automatic sleep-scoring method based on
EOG signals was utilized to classify the users
sleep stage online. The output of the automatic
User
Portable
wireless-EOG
recording system
Automatic sleep
scoring method
Light-control
algorithm
The brightness
of lamplight
EOG Signal
Send EOG Signal to PC
Sleep Stage Information
Light Level
Good Environment
for Sleeping or
Waking up
Figure 1: The concept and architecture of the proposed
adaptive light system.
sleep-scoring method is the users current sleep
stage.
4. According to the users current sleep stage, the
lighting-control algorithm gradually adjusts the
brightness of light. The lighting-control algorithm
also considers the situation of the user moving
about during the night, e.g. to go to the toilet, and
supplies adequate lighting to avoid falls.
5.2 Portable Wireless EOG Recording
Unit
In our design concept, a portable wireless EOG
recording unit (as shown in Figure 2) is integrated
with our sleep-scoring system to perform online
sleep-stage monitoring. It consists of three compo-
nents: Part A is a CC2530 wireless sender; Part B is
the amplifier circuit of electrocardiography; and Part
C is a CC2530 wireless adapter. Because the device
is designed for online automatic sleep-stage scoring,
most of the signals are in the low frequency band.
Therefore, we chose the range of 0.3-35Hz as the
AnEOG-basedSleepMonitoringSystemandItsApplicationonOn-lineSleep-stageSensitiveLightControl
25
passband of the analog filter. This system can con-
tinuously operate for, at most, 30 hours.
5.3 Control Module
Our lighting-control module consists of a circuit
board with micro-controller and a sleep-stage-based
lighting-control algorithm to control the brightness of
an LED bulb. The circuit board we used is Arduino
Uno, which has a micro-controller with a 16 MHz
clock rate and 14 digital I/O pins (of which six pro-
vide PWM output). It can be connected to a computer
via a USB cable for both data transmission and power
supply, but it can also be run on a stand-alone basis,
powered via an AC-to-DC adapter. The specifications
of the LED bulb are, Color temperature: warm white
3500 K; current: 700 mA; voltage: 3.2-3.7v; bright-
ness: 130-150 lm.
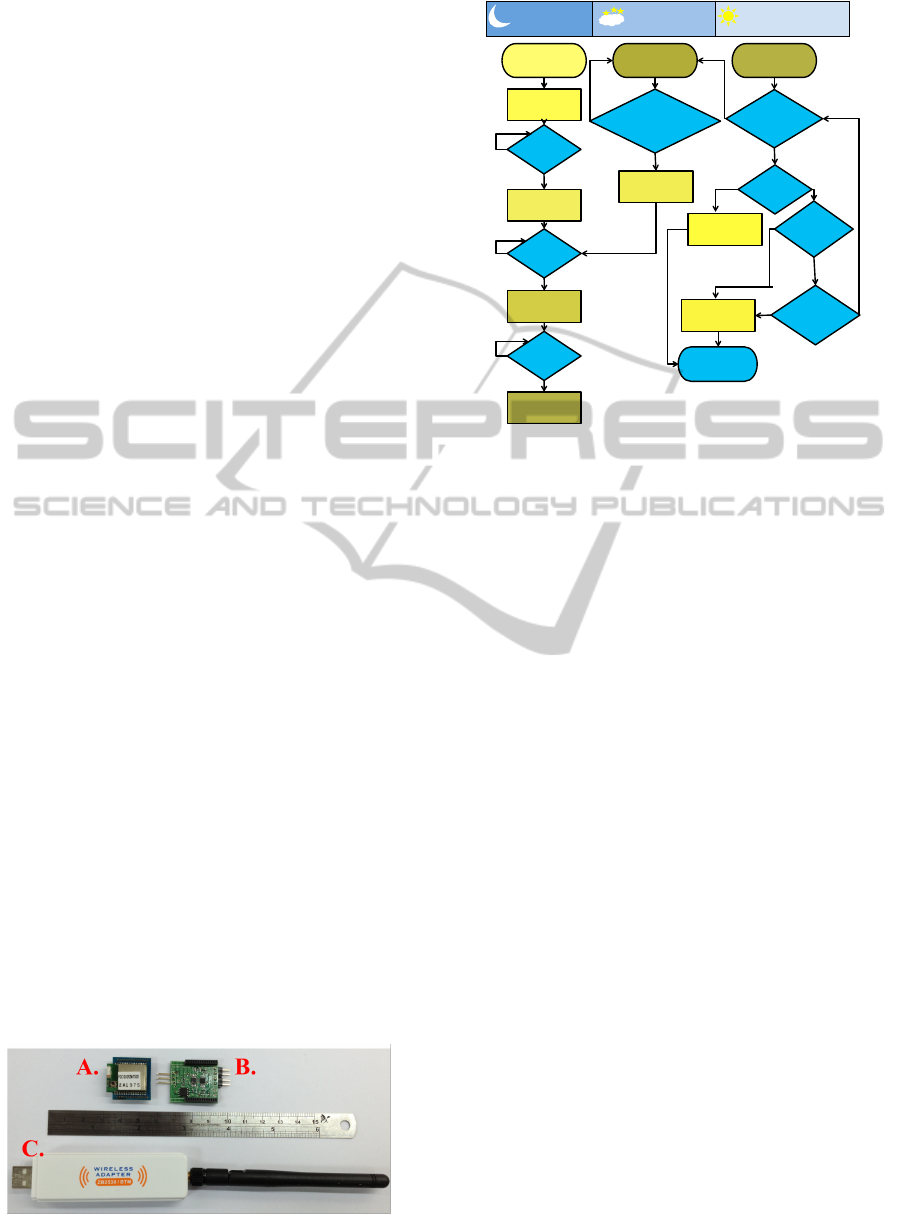
Our sleep-stage-based lighting control algorithm
is illustrated in Figure 3. When the user wears our
portable wireless-EOG recording unit and goes to
bed, the brightness decreases from 200 lux to 100
lux over the course of 90 seconds. When the users
sleep stage first reaches S1, the brightness decreases
from 100 lux to 50 lux over a period of 150 sec-
onds. Similarly, when users sleep stage enters its first
S2, the brightness decreases from 50 lux to 25 lux in
60 seconds. The light is turned off 60 seconds after
users sleep stage enters its first SWS epoch. Then, if
the user appears to experience three continuous Wake
epochs, indicating that they are likely to get up, the al-
gorithm turns on the light and the brightness increases
to 50 lux in 5 seconds. When the user goes to sleep
again, the lighting control algorithm would check the
first S2 and SWS, and the light is turned off gradually
again. On the other hand, if the users sleep stage does
not show three consecutive Wake epochs, it means
that the user has continued sleeping. Five minutes be-
fore the user-set wake-up time, the lighting control
algorithm checks the users sleep stage. If the users
stage is Wake, the brightness increases to 255 lux in
60 seconds. If, on the other hand, the users stage is
S1, S2, or REM, the brightness increases to 255 lux
in 300 seconds. If there are no Wake, S2, or REM
Figure 2: The three components of the portable wireless-
EOG recording unit.
If first
SWS?
If
S1,S2,
or
Rem?
If before
setting
alarm 10
min?
If
wake?
If before
setting
alarm 5
min?
If first
S2?
If first
S1?
If arousal?
(appears 3
continuous
Wake epochs)
Start the U
I
Lux:0 → 250
Duration: 5min
No-light state No-light state
Lux:0 → 50
Duration: 5s
Lux:0 → 255
Duration: 60s
Lux:25 → 0
Duration: 5s
Lux:50 → 25
Duration: 5s
Lux:100 → 50
Duration: 150s
Lux:200 → 100
Duration: 90s
End
N
Y
Y
Y
Y
Y
Y
Y
Y
N
N
N
N
N
N
N
Sleep Mode
Wake up at
Midnight Mode
Wake up Mode
Figure 3: The flowchart of our light control algorithm,
which has three modes: sleep, wake up at the middle of
the night, and wake up.
stages within the 10 minutes immediately preceding
the wake-up time, the brightness also increases to 255
lux in 300 seconds. The voice alarm rings when the
brightness of the light reaches 255 lux.
6 LIGHTING CONTROL
EXPERIMENT
We recruited three male subjects aged 23 ± 1.1 years
old via the Internet. All three subjects had a habit of
taking a nap at noon. They were asked about their
sleep quality. None of them reported any history of
sleep disorders. They were instructed to keep a regu-
lar sleep-wake schedule for three days prior to the ex-
periment. Subjects were required to abstain from caf-
feine and alcohol throughout the course of the study.
All subjects gave written informed consent before en-
tering the study and were paid for their participation.
The experiment began at about 1:00 PM.
6.1 Procedure
A darkened, quiet room was built for the sleep ex-
periment. A camcorder was set up to record the
experimental process. Two EOG channels, placed
right/above and left/below outer canthus, were con-
nected to our portable wireless EOG recording unit.
The LED blub was placed next to the subjects pil-
low. The total sleep time was 80 minutes for each
subject, this being the usual length of a persons first
PhyCS2014-InternationalConferenceonPhysiologicalComputingSystems
26
• 1
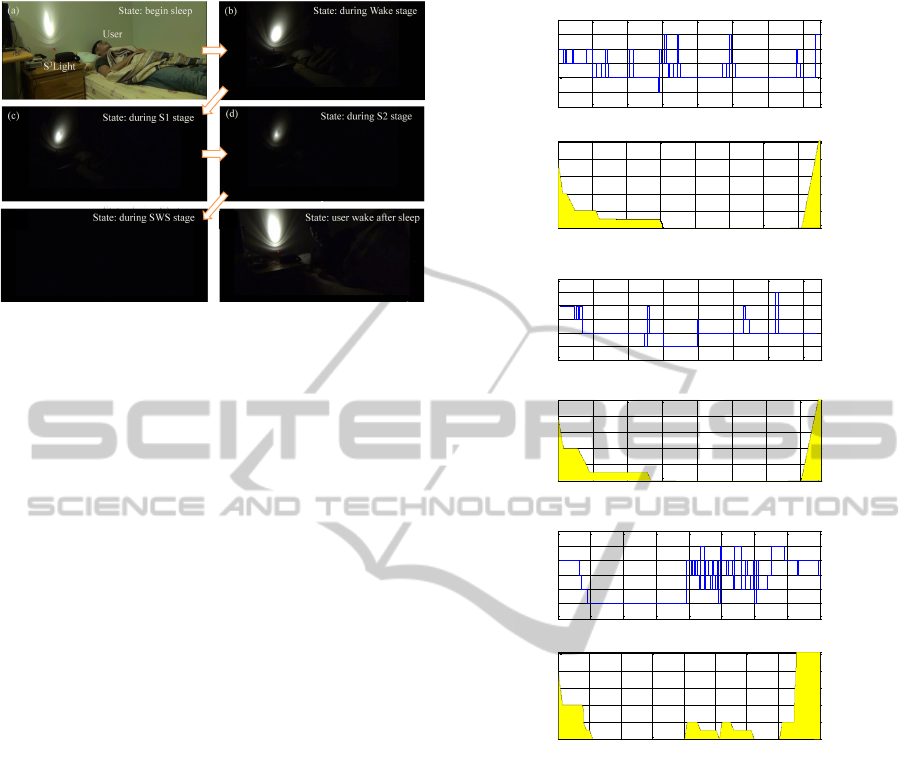
(e) (f)
Figure 4: Illustration of the actual environment and exper-
imental process. (a)-(e) show the brightness was gradually
decreased when the user transitioned from waking to deep
sleep. (f) shows how the light automatically turned on when
the user woke up.
sleep cycle. Usually, sleep stages are not stable in
the first sleep cycle; in particular, they change more
frequently in the first sleep cycle than in the later cy-
cles. Therefore, our experimental design focused on
the first sleep cycle to verify the stability of the sys-
tem in more difficult cases. Figure 4 shows the exper-
imental environment and process, where (a)-(d) indi-
cate how the brightness was gradually decreased in
the periods when the users sleep stage transited from
wake to light sleep (S1 and S2), and that the light was
turned off in the SWS stage. Figure 4 (e) shows that
the light was automatically turned on when the user
woke up.
6.2 Results
In Figure 5, (a)-(c) show the sleep hypnograms and
light levels for subjects 1, 2, and 3, respectively. The
experiments of all subjects can be deemed successful,
as the light was gradually turned off when their sleep
stage changed from Wake to SWS, and was turned on
when they woke up or were in the light sleep stage 10
minutes before the pre-set wake-up time.
From Figure 5(a), one can observe that brightness
decreased at the beginning of sleep and during the
first S1, S2, and SWS stages. The brightness of light
remained zero until 71 minutes into the experiment,
that is, nine minutes before the wake-up time set by
the subject. The sleep stage of Subject 1 at 71 min-
utes was S2. Therefore, the brightness increased to
255 lux over the following 5 minutes. However, some
Wake stages did appear between 30 minutes and 70
minutes, but all were less than three epochs in length.
They may have been caused by body movement with-
out awareness, or by misclassification by the sleep-
scoring method. In any case, as these periods were
0 10 20 30 40 50 60 70 min
REM
Wake
S1
S2
SWS
Sleep hypnogram
(A) The sleep hypnogram and brightness of subject no.1
10 20 30 40 50 60 70 min
0
50
100
150
200
250
Brightness
Lux
S1
S2
SWS
S1
S2
SWS
S2
S2
0 10 20 30 40 50 60 70 min
REM
Wake
S1
S2
SWS
Sleep hypnogram
(B) The sleep hypnogram and brightness of subject no.2
10 20 30 40 50 60 70 min
0
50
100
150
200
250
Brightness
Lux
S1
S2
SWS
S2
S1
S2
SWS
S2
0 10 20 30 40 50 60 70 min
REM
Wake
S1
S2
SWS
Sleep hypnogram
(C) The sleep hypnogram and brightness of subject no.3
10 20 30 40 50 60 70 min
0
50
100
150
200
250
Brightness
Lux
S1
S2
SWS
Wake
3 Wake
3 Wake
3 Wake
3 Wake
S1
S2
SWS
3 Wake
Wake
3 Wake
Figure 5: The sleep hypnogram and brightness of the three
subjects.
less than three consecutive epochs, the light did not
turn on. The results from Subject 2 were similar to
those of Subject 1.
Figure 5(c) shows that Subject 3 achieved SWS
quickly; however, he woke up two times between the
39-minute mark and the 51-minute mark. Our sys-
tem provided faint light for purposes of safety when
the user woke up, and turned off again when his sleep
stage had returned to SWS. It is worth mentioning that
the sleep stage of Subject 3 changed quickly between
minute 40 and minute 60. Such rapid changes of
sleep stage often result in incorrect sleep-stage scor-
ing. To avoid mistakenly turning on the light when it
is not needed, the lighting control algorithm may be
adjusted according to a users sleep pattern and effi-
ciency. Other factors affecting the sleep environment,
such as music and temperature, can also be consid-
ered in the future.
AnEOG-basedSleepMonitoringSystemandItsApplicationonOn-lineSleep-stageSensitiveLightControl
27

7 DISCUSSION
Comfortable recording and accurate sleep-stage cas-
sification are two essential criteria for sensing and
computing technologies designed to support healthy
sleep. Due to their high cost and bulk, conventional
PSG systems are not suitable for sleep recording at
home. Expert scoring of PSG recordings is also a
time-consuming process. Recently developed phone
apps and wearable devices for sleep monitoring are
easy to use, but none claim to accurately recognize
the full range of sleep stages. In this paper, an EOG-
based sleep-scoring system has been proposed. Com-
pared to PSG or EEG recordings, our EOG-based de-
vice has the advantage of easy placement and can be
operated by the individual user with minimal training.
The accuracy of the proposed method as compared
with manual scoring can reach 83.33%. This solution
balances the criteria of comfortable recording and ac-
curate sleep staging.
In addition to sleep-quality evaluation, our sys-
tem incorporates active light control. Our results
demonstrate that light can be adjusted automatically
based on the sleep stages of human subjects. Sleep
hypnograms show that the time-points of different
subjects sleep stages from awake to light sleep or
from light sleep to deep sleep were very different.
Hence, a dawn-dusk simulation should ideally con-
trol the brightness of light based on the users sleep
stage, in order to overcome individual differences in
their sleep patterns.
Prior work (Choe et al., 2011) indicated that users
were not accustomed to wearing biosensors while
asleep. This suggests that we must improve the com-
fort of this type of device in the future. Furthermore,
there is lack of long-term (i.e. month-long or longer)
studies of the use of portable sleep-monitoring de-
vices in daily life (Fontana Gasio et al., 2003). With
improvements to devices and increased user familiar-
ity, negative user experiences can be expected to de-
crease.
Previous studies (Fromm et al., 2011; Gim
´
enez
et al., 2010) have also suggested that simulated dawn-
dusk light influences sleep quality. However, the main
purpose of our work is to demonstrate that our method
can adjust the brightness of light automatically based
on users real-time sleep stages. How best to adjust
the light to improve users sleep quality needs further
studies for verification.
7.1 Benefits of Adaptive System
Most of the existing work in this area (Lawson et al.,
2013; Kay et al., 2012) only recorded users sleep
stages and helped them to analyze their sleep quality,
without providing an active system to modulate the
sleeping environment appropriately in harmony with
users individual sleep stages.
Kupfer and Reynolds (1997) indicated that televi-
sion was seen as a cause of disrupted sleep (Kupfer
and Reynolds, 1997). However, it may help those
who fear sleeping alone, or who need to be shielded
from outside noise (Aliakseyeu et al., 2011; Choe
et al., 2011). An adaptive system similar to the one
we propose could adjust the brightness and contrast
of TV screens to guide users to sleep, and shut down
the TV automatically when users fall asleep. Since it
has been demonstrated that lights can be adjusted and
turned on and off automatically based on individuals
sleep stages in real time, adaptive lighting adjustment
could also help children who are afraid of the dark. A
sleeping environment that is actively attuned to users
sleep stages will allow them to have a better quality
of sleep.
Besides improving sleep quality, an adaptive sys-
tem might bring other benefits. For example, users
could show their sleep stages to flight attendants on
long air journeys, so that the flight attendants could
avoid disrupting their rest when they are in deep sleep.
For users who sleep with a partner, timely detection
of sleep stages could modulate the sleeping environ-
ment appropriately, for example by adjusting the light
level and TV volume once the partner is asleep. These
automatic control systems need further design work
and verification, but are certainly worthy of future re-
search exploration.
7.2 Limitations
Our system still has some limitations. First, new EOG
recording devices that can be easily worn would have
to be developed if extensive use of our system was
to be made. A long-term sleep monitoring system
should be evaluated in the near future. Second, there
is still much scope for improvement of the lighting-
control algorithm, which can and should be fine-tuned
to suit different subjects and scenarios.
8 CONCLUSIONS
This paper proposed a comfortable, accurate EOG-
based sleep-monitoring system. In addition to off-
line sleep quality evaluation, its usefulness extends to
dynamic control of light levels based on users sleep
stages. This study demonstrates the feasibility of us-
ing online and closed-loop PhyCS to control a sleep-
ing environment adaptively.
PhyCS2014-InternationalConferenceonPhysiologicalComputingSystems
28

It is hoped that this work may open up new re-
search horizons and strategies with regard to both
sleep monitoring and environmental control. When
a comfortable online sleep monitor is available, this
system can be utilized to control the sleep environ-
ment for easy sleep. A system that automatically and
adaptively adjusts environmental factors based on a
users sleep stages for the purpose of sleep quality en-
hancement is feasible.
ACKNOWLEDGEMENTS
This work was supported by the National Science
Council of Taiwan under Grants NSC 102-2221-
E-009-082-MY3, 100-2410-H-006-025-MY3, and
1102-2220-E-006-001. Moreover, this paper was also
supported by ”Aiming for the Top University Pro-
gram” of the National Chiao Tung University and
Ministry of Education,Taiwan, R.O.C.
REFERENCES
Aliakseyeu, D., Du, J., Zwartkruis-Pelgrim, E., and Sub-
ramanian, S. (2011). Exploring interaction strate-
gies in the context of sleep. In Human-Computer
Interaction–INTERACT 2011, pages 19–36. Springer.
Bauer, J., Consolvo, S., Greenstein, B., Schooler, J., Wu,
E., Watson, N. F., Kientz, J., and Bauer, J. S. (2012).
Shuteye: encouraging awareness of healthy sleep rec-
ommendations with a mobile, peripheral display. In
Proceedings of the 2012 ACM annual conference on
Human Factors in Computing Systems, pages 1401–
1410. ACM.
Berthomier, C., Drouot, X., Herman-Sto
¨
ıca, M.,
Berthomier, P., Prado, J., Bokar-Thire, D., Benoit, O.,
Mattout, J., and d’Ortho, M.-P. (2007). Automatic
analysis of single-channel sleep eeg: validation in
healthy individuals. Sleep, 30(11):1587.
Bulling, A., Roggen, D., and Tr
¨
oster, G. (2009). Wearable
EOG goggles: eye-based interaction in everyday en-
vironments. ACM.
Chandra, H., Oakley, I., and Silva, H. (2012). Designing to
support prescribed home exercises: understanding the
needs of physiotherapy patients. In Proceedings of the
7th Nordic Conference on Human-Computer Interac-
tion: Making Sense Through Design, pages 607–616.
ACM.
Choe, E. K., Consolvo, S., Watson, N. F., and Kientz, J. A.
(2011). Opportunities for computing technologies to
support healthy sleep behaviors. In Proceedings of the
SIGCHI Conference on Human Factors in Computing
Systems, pages 3053–3062. ACM.
Costa, M., Goldberger, A. L., and Peng, C.-K. (2005). Mul-
tiscale entropy analysis of biological signals. Physical
Review E, 71(2):021906.
Costa, M., Peng, C.-K., L Goldberger, A., and Hausdorff,
J. M. (2003). Multiscale entropy analysis of human
gait dynamics. Physica A: Statistical Mechanics and
its applications, 330(1).
Esteller, R., Echauz, J., Tcheng, T., Litt, B., and Pless, B.
(2001). Line length: an efficient feature for seizure
onset detection. In Engineering in Medicine and Biol-
ogy Society, 2001. Proceedings of the 23rd Annual In-
ternational Conference of the IEEE, volume 2, pages
1707–1710. IEEE.
Fontana Gasio, P., Kr
¨
auchi, K., Cajochen, C., Someren,
E. v., Amrhein, I., Pache, M., Savaskan, E., and
Wirz-Justice, A. (2003). Dawn–dusk simulation
light therapy of disturbed circadian rest–activity cy-
cles in demented elderly. Experimental gerontology,
38(1):207–216.
Fromm, E., Horlebein, C., Meergans, A., Niesner, M., and
Randler, C. (2011). Evaluation of a dawn simulator
in children and adolescents. Biological Rhythm Re-
search, 42(5):417–425.
Gim
´
enez, M. C., Hessels, M., van de Werken, M., de Vries,
B., Beersma, D. G., and Gordijn, M. C. (2010). Ef-
fects of artificial dawn on subjective ratings of sleep
inertia and dim light melatonin onset. Chronobiology
International, 27(6):1219–1241.
Guo, L., Rivero, D., Dorado, J., Rabunal, J. R., and Pa-
zos, A. (2010). Automatic epileptic seizure detec-
tion in eegs based on line length feature and artificial
neural networks. Journal of neuroscience methods,
191(1):101–109.
Iber, C. (2007). The aasm manual for the scoring of sleep
and associated events: rules, terminology and techni-
cal specifications.
Kang, X., Jia, X., Geocadin, R. G., Thakor, N. V., and
Maybhate, A. (2009). Multiscale entropy analysis of
eeg for assessment of post-cardiac arrest neurological
recovery under hypothermia in rats. Biomedical Engi-
neering, IEEE Transactions on, 56(4):1023–1031.
Kay, M., Choe, E. K., Shepherd, J., Greenstein, B., Watson,
N., Consolvo, S., and Kientz, J. A. (2012). Lullaby:
a capture & access system for understanding the sleep
environment. In Proceedings of the 2012 ACM Con-
ference on Ubiquitous Computing, pages 226–234.
ACM.
Kuo, B.-C. and Landgrebe, D. A. (2004). Nonparametric
weighted feature extraction for classification. Geo-
science and Remote Sensing, IEEE Transactions on,
42(5):1096–1105.
Kupfer, D. J. and Reynolds, C. F. (1997). Management
of insomnia. New England Journal of Medicine,
336(5):341–346.
Lawson, S., Jamison-Powell, S., Garbett, A., Linehan, C.,
Kucharczyk, E., Verbaan, S., Rowland, D. A., and
Morgan, K. (2013). Validating a mobile phone appli-
cation for the everyday, unobtrusive, objective mea-
surement of sleep. In Proceedings of the SIGCHI
Conference on Human Factors in Computing Systems,
pages 2497–2506. ACM.
Liang, S.-F., Kuo, C.-E., Hu, Y.-H., Pan, Y.-H., and Wang,
Y.-H. (2012). Automatic stage scoring of single-
AnEOG-basedSleepMonitoringSystemandItsApplicationonOn-lineSleep-stageSensitiveLightControl
29

channel sleep eeg by using multiscale entropy and au-
toregressive models. Instrumentation and Measure-
ment, IEEE Transactions on, 61(6):1649–1657.
Lin, C.-T., Ken-Li, L., Li-Wei, K., Sheng-Fu, L., Bor-Chen,
K., et al. (2008). Nonparametric single-trial eeg fea-
ture extraction and classification of driver’s cognitive
responses. EURASIP Journal on Advances in Signal
Processing, 2008.
Manabe, H. and Fukumoto, M. (2006). Full-time wear-
able headphone-type gaze detector. In CHI’06 ex-
tended abstracts on Human factors in computing sys-
tems, pages 1073–1078. ACM.
Norman, R. G., Pal, I., Stewart, C., Walsleben, J. A., and
Rapoport, D. M. (2000). Interobserver agreement
among sleep scorers from different centers in a large
dataset. Sleep, 23(7):901–908.
Norris, P. R., Anderson, S. M., Jenkins, J. M., Williams,
A. E., and Morris Jr, J. A. (2008). Heart rate multi-
scale entropy at three hours predicts hospital mortality
in 3,154 trauma patients. Shock, 30(1):17–22.
Olbrich, E., Achermann, P., and Meier, P. (2003). Dynamics
of human sleep eeg. Neurocomputing, 52:857–862.
Pardey, J., Roberts, S., and Tarassenko, L. (1996). A review
of parametric modelling techniques for eeg analysis.
Medical engineering & physics, 18(1):2–11.
Pincus, S. (1995). Approximate entropy (apen) as a com-
plexity measure. Chaos: An Interdisciplinary Journal
of Nonlinear Science, 5(1):110–117.
Rechtschaffen, A. and Kales, A. (1968). A manual of stan-
dardized terminology, techniques and scoring system
for sleep stages of human subjects.
Richman, J. S. and Moorman, J. R. (2000). Physiolog-
ical time-series analysis using approximate entropy
and sample entropy. American Journal of Physiology-
Heart and Circulatory Physiology, 278(6):H2039–
H2049.
Rosenberg, R. S., Van Hout, S., et al. (2013). The ameri-
can academy of sleep medicine inter-scorer reliability
program: sleep stage scoring. Journal of clinical sleep
medicine: JCSM: official publication of the American
Academy of Sleep Medicine, 9(1):81–87.
Schaltenbrand, N., Lengelle, R., Toussaint, M., Luthringer,
R., Carelli, G., Jacqmin, A., Lainey, E., Muzet, A.,
Macher, J.-P., et al. (1996). Sleep stage scoring us-
ing the neural network model: comparison between
visual and automatic analysis in normal subjects and
patients. Sleep, 19(1):26.
Silva, H., Palma, S., and Gamboa, H. (2011). Aal+: Con-
tinuous institutional and home care through wireless
biosignal monitoring systems. In Handbook of Digi-
tal Homecare, pages 115–142. Springer.
Stepanski, E. J. and Wyatt, J. K. (2003). Use of sleep hy-
giene in the treatment of insomnia. Sleep medicine
reviews, 7(3):215–225.
Takahashi, T., Cho, R. Y., Murata, T., Mizuno, T., Kikuchi,
M., Mizukami, K., Kosaka, H., Takahashi, K., and
Wada, Y. (2009). Age-related variation in eeg com-
plexity to photic stimulation: A multiscale entropy
analysis. Clinical Neurophysiology, 120(3):476–483.
Thakor, N. V. and Tong, S. (2004). Advances in quantitative
electroencephalogram analysis methods. Annu. Rev.
Biomed. Eng., 6:453–495.
Virkkala, J., Hasan, J., V
¨
arri, A., Himanen, S.-L., and
M
¨
uller, K. (2007). Automatic sleep stage classifica-
tion using two-channel electrooculography. Journal
of neuroscience methods, 166(1):109–115.
PhyCS2014-InternationalConferenceonPhysiologicalComputingSystems
30
