
Relevant Elderly Gait Features for Functional Fitness Level Grouping
Marta S. Santos
1
, Vera Moniz-Pereira
2
, Andr
´
e Lourenco
1,3
, Ana Fred
1
and Ant
´
onio P. Veloso
2
1
Instituto de Telecomunicac¸
˜
oes,1049-001, Lisboa, Portugal.
2
Univ Tecn Lisboa, Fac Motricidade Humana,CIPER, LBMF, P-1499-002 Lisboa, Portugal
3
Instituto Superior de Engenharia de Lisboa, Lisboa, Portugal
Keywords:
Functional Fitness Level, Elderly Population, Clustering, Kinematic and Kinetic Parameters, Feature Selec-
tion.
Abstract:
Locomotor tasks characterization plays an important role in trying to improve the quality of life of a growing
elderly population. This paper focuses on this matter by trying to characterize the locomotion of two popu-
lation groups with different functional fitness levels (high or low) while executing three different tasks - gait,
stair ascent and stair descent. Features were extracted from gait data, and feature selection methods were
used in order to get the set of features that allow differentiation between functional fitness level. Unsuper-
vised learning was used to validate the sets obtained and, ultimately, indicated that it is possible to distinguish
the two population groups. The sets of best discriminate features for each task are identified and thoroughly
analysed.
1 INTRODUCTION
Fall-related morbidity and mortality rates are referred
to as one of the most common and serious prob-
lems faced by the elderly, affecting around 30% of
the population above 65 years (Todd and Skelton,
2004). Several risk factors have been associated with
falls, of which lower limb muscle weakness and gait
and balance deficit seem to have a preponderant role
(Rubenstein, 2006). Accordingly, we have found, in
a cohort of 647 Portuguese older adults, that falls
might not be an inevitable consequence of ageing
and that health, functional fitness and physical activ-
ity parameters were the most determinant factors for
both episodic and recurrent falls (Moniz-Pereira et al.,
2012). Further, we also verified that the majority of
the falls occurred in an outdoor setting, and mainly
while walking or climbing stairs. Thus, the biome-
chanical characterization of locomotor tasks in older
people with different levels of functional fitness may
have an important contribution for the prevention of
falls and the improvement of quality of life in this
population.
The particular case of locomotion data analysis
presents several inherent difficulties (Chau, 2001a),
such a: high-dimensionality (several kinetic and kine-
matic variables acquired through a period of time);
temporal dependence (there’s a quasi-periodic tempo-
ral dependence, being difficult to model); high vari-
ability (intrasubject and intersubject); data is typically
composed by curves which are hard to correlate, and
the relationships between variables are nonlinear.
Usually, gait data analysis is done through statisti-
cal studies (Horv
´
ath et al., 2001), (Prince et al., 1997)
leading to a series of means and standard deviations
of the parameters measured for pre-determined pop-
ulation groups, which can be hard to analyse and do
not reflect the relative importance of the measures in
the problem studied.
Pattern recognition systems have been explored as
an alternative way of looking into gait data. Through
the analysis of gait patterns it has been possible to
detect gait pathologies (Kohle et al., Jun; Hausdorff
et al., 1997), fatigue (Janssen et al., 2011), to eval-
uate the effects of medical procedures on gait (Ishii
et al., 1996), or to detect subject’s features (age group,
fitness level) (Reid et al., 2010). These systems usu-
ally require the following sequence of steps: (1) sens-
ing, (2) segmentation and data cleaning, (3) feature
extraction, and (4) learning. Learning can be super-
vised (where training is required and performed using
labelled samples) or unsupervised (where the system
finds natural groups in data).
One of the steps required in pattern recognition
systems is feature extraction. Most of the times, fea-
tures are empirically defined by visualization of the
153
Santos M., Moniz-Pereira V., Lourenço A., Fred A. and P. Veloso A..
Relevant Elderly Gait Features for Functional Fitness Level Grouping.
DOI: 10.5220/0004726001530160
In Proceedings of the International Conference on Physiological Computing Systems (PhyCS-2014), pages 153-160
ISBN: 978-989-758-006-2
Copyright
c
2014 SCITEPRESS (Science and Technology Publications, Lda.)

signal, which can lead to a big amount of extracted
features. Due to the ”curse of dimensionality” prob-
lem (Raudys and Jain, 1991), classification error in-
creases with the increase of the number of features
for datasets with few observations. Feature selection
is an optional step performed before (or during) learn-
ing, that eliminates irrelevant features and overcomes
this problem, leading to improvements in the perfor-
mance. As an example, (Begg and Kamruzzaman,
2005) used feature selection in gait data causing an
increase on it’s SVM classifier’s accuracy; and (Chan
et al., 2002) performed this as a pre-step of several
classifiers, resulting in an increase of the classifica-
tion rate.
In this work, we will use several kinetic and kine-
matic variables acquired from a group of elderly, to
verify the possibility to distinguish between high and
low functional fitness (FF) levels groups (Rikli and
Jones, 1999; Rose et al., 2006) and which locomo-
tion features are more relevant for the distinction of
these two groups. Due to the small sample available
and since we meant to approach the data in an explor-
ing perspective, unsupervised learning techniques are
used.
The rest of the paper is organized as follows: sec-
tion 2 gives a quick overview of related work; section
3 thoroughly explains the general methodology used
in this work, from data collection, passing by feature
extraction and selection and finally clustering and val-
idation methods used; section 4 shows the results of
applying the proposed methodology to our dataset; on
section 5 the biomechanical meaning of the selected
features is discussed; and section 6 draws the final
conclusions.
2 RELATED WORK
Even though most of the gait pattern recognition in-
vestigation has been focused on supervised learning
(Chau, 2001a) and (Chau, 2001b), some papers have
reported the use of unsupervised learning techniques
to investigate several gait characteristics. In (Xu et al.,
2006), the authors tried to find underlying gait pat-
terns among pathological and healthy gaits by apply-
ing k-means and hierarchical clustering algorithms
(Jain and Dubes, 1988) to a series of features previ-
ously extracted. Cluster evaluation was done in terms
of silhouette and mean square error (Halkidi et al.,
2002).
In (Vaughan and O’Malley, 2005) fuzzy cluster-
ing is used to identity different walking strategies in
children and young adults with cerebral palsy. In
(Toro et al., 2007) hierarchical cluster analysis is used
on sagittal kinematic gait data derived from children
with and without cerebral palsy. Different walking
strategies were distinguished by (Su et al., 2001) in
patients with ankle arthrodesis using a fuzzy cluster-
ing technique. Non-hierarchical cluster analysis was
used by (Mulroy et al., 2003) to classify the gait pat-
terns of patients recovering from a stroke based on the
temporal-spatial and kinematic parameters of walk-
ing. In (Jiang et al., 2010), affinity propagation clus-
tering is used to better grouping of gait data based on
the person’s characteristics, and help to explain its re-
lationship with human gait.
As shown there are several different clustering al-
gorithms used for gait pattern recognition. In this
study we apply the classical hierarchical clustering al-
gorithms due to its simplicity and interpretability.
3 METHODOLOGY
Having as goal the separation of two populations
(with high or low functional fitness level), the main
focus of this work was to determine which features,
from the acquired data, would be more relevant.
Several kinematic and kinetic variables were ac-
quired from 3 different locomotor tasks, further de-
scribed. The analysis is performed separately for each
of the tasks, to systematically analyse the features in-
volved, and because the tasks induce a different mor-
phology in some variables.
The features were empirically determined by in-
spection of the signals, and selected using feature se-
lection techniques. For the latter, we used a Wrapper
method (Alelyani et al., 2013) combined with clus-
tering. Finally, the obtained subsets of features were
evaluated against the true label in order to verify the
relevance of the features selected to our problem.
The methodology followed in this paper is system-
atized in figure 1.
3.1 Experimental Sets and Data
Acquisition
A convenience sample of 27 participants over 65
years was selected from (Moniz-Pereira et al., 2012).
None of them had any neurologic or orthopedic condi-
tion that would affect their gait pattern. Immediately
prior to data collection, all participants were informed
Figure 1: Methodology followed in this work.
PhyCS2014-InternationalConferenceonPhysiologicalComputingSystems
154

about the study, accepted to participate and signed an
informed consent. The Ethics Committee of Faculty
of Human Kinetics approved the study protocol.
Functional fitness level was established according
to a total score (TFFs) of 6 functional fitness tests (the
8 foot up and go, and the 30 second Chair Stand, from
Senior Fitness Test battery (Rikli and Jones, 1999),
and items 4 [step up and over] , 5 [tandem walk], 6
[stand on one leg] and 7 [stand on foam eyes closed]
from the Fullerton Advanced Balance Scale (Rose
et al., 2006)).
Three locomotor tasks were performed by each
subject: gait (G), stair ascent (SA) and stair de-
scent (SD). Several kinetic and kinematic variables
were acquired relative to one gait cycle while per-
forming each task. When performing the locomotor
tasks, participants were barefoot and wore tight black
shorts and t-shirts. Anthropometric measures (sub-
jects body mass, stature and trochanteric height) were
taken and the marker set used was based on the cal-
ibrated anatomical system technique (CAST) (Cap-
pozzo et al., 1995), using a digitizing pointer for the
ASIS markers 2(a).
Kinematic and kinetic data was collected with
a Qualisys Track Manager system (Qualisys AB,
Gothenburg, Sweden) with 8 infrared, high speed
cameras (Qualisys Oqus 300, Qualisys AB, Gothen-
burg, Sweden) working at a frequency of 200 Hz and
synchronized with two Kistler force plates (9281B
e 9283U014 Kistler Instruments Ltd, Winterthur,
Switzerland). For the stairs trials, a wooden staircase
with three steps was built. Each step had 15 cm of
height and 27 cm of depth. The last step was ex-
tended (80 cm depth) in order to avoid deceleration
during stair climbing.
Two force platforms were used. The first was em-
bedded on the floor in front of the staircase, while the
second was covering and securely fixed on the first
step. This step was built ensuring an extreme rigidity
of the structure. Each force platform was independent
of the surrounding wooden pieces to ensure adequate
measures.
Participants were asked to walk at their comfort-
able pace. Prior to data collection, training trials were
allowed so that the subjects would become comfort-
able with each task. Three trials from each task were
collected, and the order of the tasks (walking and
stairs) was randomized.
A seven segments (feet, shanks, thighs and pelvis)
model was built for each subject 2(b) and optimized
through inverse kinematics (Lu and O’Connor, 1999)
to minimize the effect of soft tissue artefact. The
joints were modelled as spherical joints, i.e. rota-
tional motion was allowed in the 3 axis, but transla-
(a) Instrumented
suject.
(b) Subject based 7 segment
3D model.
Figure 2: Aquisition set.
tions were restricted.
A fourth order Butterworth low pass filter at 10Hz
was used for both kinematic and kinetic data. Gait
variables included: (1) foot and pelvis absolute an-
gles, (2) lower limb joint angles (using a XYZ Car-
dan sequence), (3) ground reaction forces, (4) lower
limb joint moments and powers (determined through
inverse dynamics). Kinetic data was normalized to
subjects body mass. As all variables were computed
for the 3 planes of motion (X sagital plane, Y frontal
plane and Z transverse plane), a total of 34 variables
were analysed
All the aforementioned data processing was per-
formed through a continuous pipeline developed
under Visual 3D software (Professional Version
v4.80.00, C-Motion, Inc, Rockville, USA).
3.2 Feature Extraction
Each acquisition comprises a total of 34 kinetic and
kinematic variables acquired during one gait cycle
performing a certain task. The data set contained 3
acquisitions of the same task per individual (from a
total of 27 individuals). The individuals were divided
in two groups according to their total functional fit-
ness score (TFFs) - High FF level (HFFl) and Low
FF level (LFFl). The median of the TFFs was 21 and
the subjects were classified as having a Low FF score
(TFFs range from 17 to 21 in a total of 14 subjects)
and High FF score (TFFs range from 22 to 24 in a
total of 13 subjects).
Due to limitation of the acquisition setup, in gait
and stair descent tasks, a gait cycle (GC) is consid-
RelevantElderlyGaitFeaturesforFunctionalFitnessLevelGrouping
155

Table 1: Total functional fitness score of the population of
this study. Low TFFs range: 17-21; High TFFs range: 22-
24.
TFFs 17 18 19 20 21 22 23 24
Freq. 1 1 1 4 7 2 3 8
ered from toe off to toe off, and in stair ascent from
heel strike to hell strike. Also, the signal morphology
varied considerably for some variables from task to
task. So, it is not possible to simply compare the vari-
ables when acquired during different tasks, and, there-
fore, the acquisitions are further separated by task per-
formed.
The features extracted included the signals’ mean,
standard deviations, maxima, minima, area under the
curve and skewness. Through visual analysis of each
variable, a set of characteristics was extracted result-
ing in a total of 33, 31 and 37 features extracted for
the G, SA and SD tasks, respectively. The features
were then normalized in amplitude per task.
3.3 Feature Selection
One of the main problems in machine learning is the
selection of relevant features from a set of extracted
features. The feature selection can be divided in two
main tasks: subset selection and subset evaluation.
In this work we used three techniques for subset
selection (Molina et al., 2002): forward, backward
and floating forward feature selection.
Forward feature selection (FS) is a bottom up
method, i. e., it begins with an empty set and the best
features are added at each step. The best features are
the ones that, together with the rest of the subset of
features already selected, will result in a better score
according to some evaluation criteria.
Backward feature selection (BS) is similar to FS
only it uses a top-down perspective, i. e., it begins
with a full set and deletes the less relevant features.
The less relevant features are the ones which exclu-
sion will lead to a set of features with the highest
score, according to some evaluation criteria.
The main disadvantage of the forward and back-
ward feature selection methods is that they converge
to local maxima of the evaluation function. To avoid
this, and since we have a small number of features and
samples, we have evaluated all the of possible car-
dinalities of the feature subset. This means that we
have studied/evaluated the subsets resulting from set-
ting all the possible values of Min. no. of features as a
stopping criterion. This will return the full behaviour
of the evaluation function allowing us to choose its
global maximum.
Sequential floating forward feature selection
(FFS) (Pudil et al., 1994) starts with an empty subset
of features as in FS. However, the number of features
does not increase monotonously. The algorithm in-
volves both adding and deleting features. In this way
nesting of feature sets is avoided.
In this study the application of the feature se-
lection step is evaluated a clustering validity index
over the clusters obtained using the subset of fea-
tures under evaluation. We used the Ward’s hierar-
chical method in combination with two clustering va-
lidity indexes: Adjusted Mutual Information score
(AMI) (Vinh et al., 2010);Consistency Index (CI)
(Fred, 2001).
3.4 Clustering
Unsupervised learning refers to the problem of find-
ing hidden structure on the data. In this study Ward
clustering (Murtagh and Legendre, 2011) (Jain and
Dubes, 1988) is used and is, therefore, described in
the next subsection. The last subsection, explains the
validation methods used.
Other clustering methodologies, such as k-means,
where used. However their results were worse than
the ones obtained with Ward clustering therefore, and
due to space constrains, these results are not presented
nor this methodology is detailed.
3.4.1 Ward Method
Ward minimum variance method is an hierarchical
clustering method that aims to minimize the sum of
squared differences within the clusters (Murtagh and
Legendre, 2011). It starts by considering each sample
as a single cluster (singleton). Then, it will find the
two clusters that, after merging, will lead to the mini-
mum increase in the total within cluster variance. At
each step, the clusters obeying this condition will be
merged until a pre-defined total number of clusters is
reached.
3.4.2 Subset Evaluation and Clustering
Validation
After obtaining the natural clustering partitions of
the data, we need to check if the partitions revealed
are correlated with the parameter we want to investi-
gate,the functional fitness level. This is done by com-
paring the partitions obtained with the data’s true la-
bel using a validation method. The validation method
will return a score that is a measure of the similarity
between the partitions obtained and the true label.
We used two external criteria: Adjusted Mutual
Information score (AMI)(Vinh et al., 2010) and Con-
PhyCS2014-InternationalConferenceonPhysiologicalComputingSystems
156
sistency Index (CI) (Fred, 2001) to compare the ob-
tained results with the ground truth information.
As a Mutual Information function, AMI mea-
sures the agreement of the two assignments, ignoring
permutations. Furthermore, it is normalized against
chance. It is bounded between 0 and 1. Values close
to 0 indicate random or largely independent labels,
while values close to one indicate significant agree-
ment. Also, it is invariant to cluster shape so it can be
used with any clustering algorithm.
Let U and V be two clusters, H(U) (eq. 1) and
H(V) (analogous to eq. 1) the entropy of the clus-
ters, I(U, V ) the mutual information between the two
clusters (eq. 2), and E[I(U, V )] the expected mutual
information between the two clusters. The AMI score
is given by equation 3.
H(U) =
|U|
∑
i=1
P(i)log(P(i)) (1)
I(U, V ) =
|U|
∑
i=1
|V |
∑
j=1
P(i, j)log(
P(i, j)
P(i)P( j)
) (2)
AMI(U, V ) =
I(U, V ) − E[I(U, V )]
maxH(U), H(V ) − E[I(U, V )]
(3)
The consistency index (CI) reflects the fraction of
shared samples in matching clusters in two data par-
titions, over the total number of samples. It is an iter-
ative procedure that, in each step, determines the pair
of clusters having the highest matching score, given
by the fraction of shared samples. As AMI, it ignores
permutations, is bounded between 0 and 1 (0 means
no matching at all, 1 means perfect match). CI can be
generally expressed by:
CI =
1
n
min{nc
1
,nc
2
}
∑
i=1
n shared
i
(4)
where nc
i
the number of clusters in partition i and
n shared
i
is the number of samples shared for the i
th
clusters. One can say that the CI score is the cluster-
ing equivalent to an accuracy measure since it reflects
the fraction of well classified samples.
4 RESULTS
As a baseline approach, we applied the clustering al-
gorithm directly to the extracted features, without per-
forming feature selection. A total of 33, 31 and 37
features were used for clustering in the gait (G), stair
ascent (SA) and stair descent (SD) tasks, respectively.
As a result, we obtained a CI score of 0.667 for the
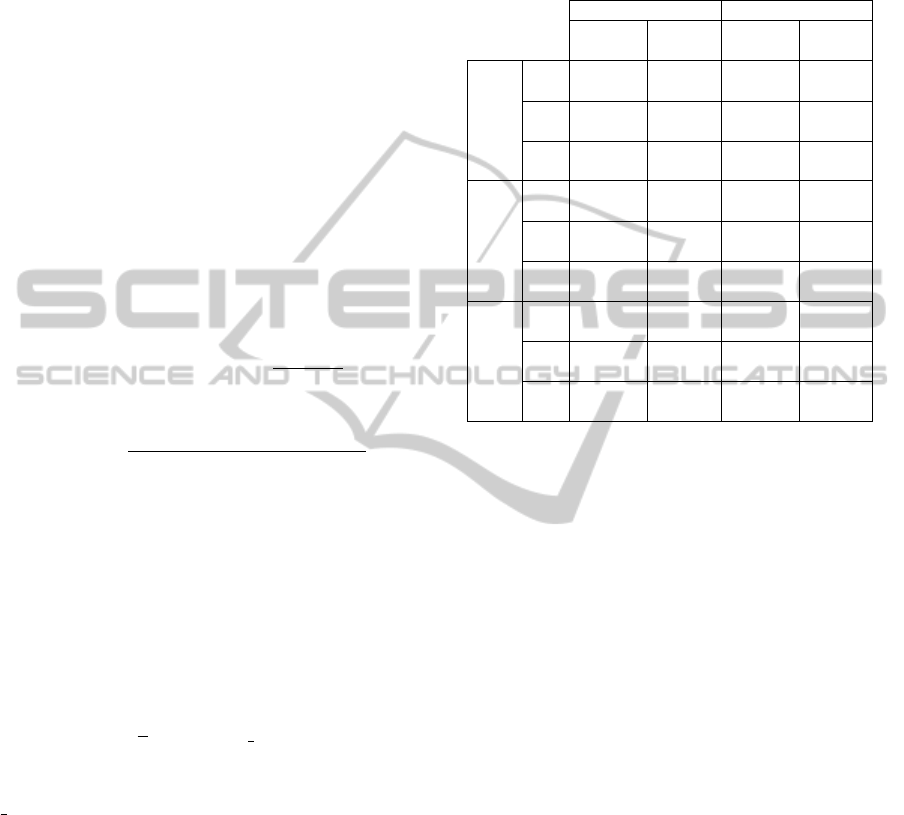
Table 2: CI score and number of features of the subsets
obtained with the different feature selection configurations.
The results were obtained with the classical feature selec-
tion algorithms, column ”Typical”, and our adapted version
to find the global maximum of the subset evaluation func-
tion, column ”Global max”. Best results are highlighted.
AMI CI
Typical
Global
max
Typical
Global
max
BS
G
0.827
(13)
0.827
(13)
0.741
(22)
0.741
(22)
SA
0.827
(23)
0.79
(4)
0.852
(14)
0.859
(11)
SD
0.778
(21)
0.815
(16)
0.704
(15)
0.778
(3)
FS
G
0.679
(1)
0.802
(5)
0.802
(5)
0.802
(5)
SA
0.79
(2)
0.889
(17)
0.889
(4)
0.889
(4)
SD
0.802
(6)
0.815
(16)
0.802
(3)
0.815
(10)
FFS
G
0.679
(1)
-
0.802
(5)
-
SA
0.78
(2)
-
0.889
(6)
-
SD
0.852
(7)
-
0.802
(3)
-
G and SD tasks, and 0.556 for the SA task, indicating
that the features selected, as a group, did not allow
a good differentiation between the locomotion of the
subjects belonging to the two functional fitness levels.
In order to investigate which features would be
relevant for this purpose, we experimented several
feature selection configurations. As referred in the
previous sections, three subset search methods where
used (forward, backward and floating forward feature
selection), combined with two subset evaluation mea-
sures (AMI and CI scores), resulting in 6 different fea-
ture selection configurations. Also, we tried the typ-
ical BS and FS approach in which the only stopping
criteria is ”no improvement in the evaluation criteria”
versus a search for the global maximum of the evalu-
ation function. We present these results in table 2.
Results improved with feature selection. Also, as
expected, results were generally better with the global
max method; there are few situations where the first
maximum coincided with the global maximum of the
evaluation function.
The best CI scores obtained were of 0.827, 0.889
and 0.852 for the G, SA and SD tasks. These results
indicate that the the features identified by the feature
selection algorithms allow to distinguish the subjects
of each group with a reasonable degree of confidence
and it is worth to analyse the subsets in detail, which
will be done in the next section.
RelevantElderlyGaitFeaturesforFunctionalFitnessLevelGrouping
157

5 SELECTED FEATURES
DISCUSSION
For the results presented in the table 2 we defined best
result as a higher CI score or a lower number of se-
lected features. However, in a biomechanical context,
fewer variables can mean results that are very difficult
to interpret. Indeed, other configurations presented
subsets with the same score but with a higher num-
ber of features. For the G and SA tasks 3 and 14
configurations, respectively, presented a score equal
to the one selected as best. For the SA task, the best
subset only contained 4 features, which is not enough
for the biomechanical analysis, so we were forced to
look into other frequently selected features present in
the subsets with the same score as the best one. The
maximum score for the SD task corresponded to a se-
lection of features with small locomotor relevance, so
we investigated the features frequently chosen by sub-
sets with the second higher score for this task - 0.815.
In the next subsections we describe and discuss
the features that are both frequently chosen by high
score subsets and relevant to the locomotor task.
5.1 Gait Task
The group of elderly subjects with lower functional
fitness level (LFFl) walked with the hip more flexed
throughout the stance (figure 3(a)). (DeVita and
Hortobagyi, 2000) have detected the same difference
when comparing young with elderly subjects. In their
work, the authors suggested that the increased hip
flexion in elderly gait pattern was probably a postu-
ral adjustment in order to be able to produce larger
extensor hip joint moment during stance and to com-
pensate for the lower plantarflexor joint moment ex-
erted. Although in this study we have not found dif-
ferences in the hip extensor joint moment, the ankle
plantaflexor joint moment peak showed to be lower
in the LFFl group, meaning that these subjects have
a significant less vigorous push off. Other authors
(Prince et al., 1997); (Winter, 1991) have also re-
ported a reduction in peak plantarflexor moment when
comparing elderly with young subjects. These differ-
ences are also in accordance with the lower ground
reaction force vertical peak showed by the LFFl peak
during the push-off phase.
In contrast with the previously referred studies,
however, we have found that subjects with a LFFl had
a higher knee extensor joint moment peak at the be-
ginning of the stance, during the weight acceptance
phase. As the LFFl subjects also presented a higher
degree of knee flexion (figure 3(b)) during this phase,
a larger knee extensor moment may be necessary to
control knee flexion and thus to properly support the
body.
Data concerning the other planes of motion is
scarce in the literature for this population. Neverthe-
less, the higher external rotation of the hip, ankle ad-
duction joint moment (figure 3(c)) and knee abduc-
tor angular impulse seem to suggest a higher effort to
control medio-lateral body stability in the LFFl group.
5.2 Stair Ascent Task
When compared to the HFFl group, the LFFl group
also showed to adopt a different strategy to deal with
the SA task. The higher hip and pelvis flexion angles
(figures 3(d) and 3(e)) and a higher abduction hip an-
gle may be a strategy of the subjects with low func-
tional fitness level in order to guarantee a safe clear-
ance of the swing leg through the intermediate step.
Also, as mention before for the walking task, a more
flexed hip during the stance may also be a postural
adjustment in order to produce a larger extensor mo-
ment of the hip during the stance (DeVita and Hor-
tobagyi, 2000). In fact, the subjects from the LFFl
group seem to compensate their lack of plantarflexor
joint moment during the stance, with a higher exten-
sor hip moment. This was also verified by (Novak and
Brouwer, 2011), when comparing young and older
subjects. Furthermore, subjects higher functionality
showed, not only to use more their plantarflexors, but
also to produce more knee extension power during the
weight acceptance phase.
On the contrary of what has been reported when
comparing young with older subjects (Novak and
Brouwer, 2011), the LFFl group showed a lower hip
abductor joint moment (figure 3(f)) when compared
to the HFFl group. It could be hypothesize that due
to the higher task demand, the subjects with a lower
functional fitness level were not able to rely as much
as the HFFl subjects on the hip abductor muscles to
control the body lateral stability.
5.3 Stair Descent Task
Finally, for the SD task the more significant features
obtained to distinguish the LFFl group from the HFFl
group were difficult to interpret in a biomechanical
point of view. However, if we consider the features
belonging to the second highest score subsets, it is
interesting to verify that in accordance to what was
verified in the previous tasks, the LFFl group had a
more flexed hip (figure 3(g)) during the SD task and
produce a higher hip extensor joint moment. Further,
similar to what we have found for the SA task, the
subjects with lower functionality produced a lower
PhyCS2014-InternationalConferenceonPhysiologicalComputingSystems
158
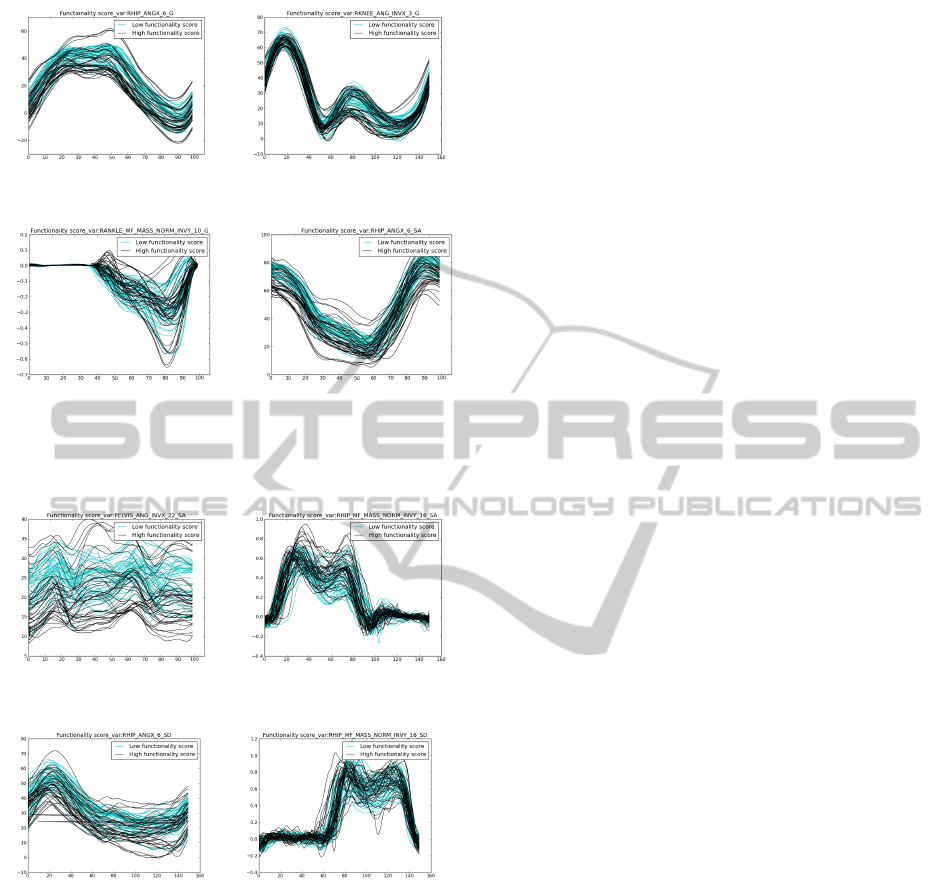
(a) Hip’s angle in X (G).
Feature: mean.
(b) Knee’s angle in X (G).
Feature: 2nd max
(c) Ankle’s joint moment
in Y (G). Feature: maxi-
mum (40% to 60% of GC),
minimum and mean on the
second third of the signal
(d) Hip’s angle in X (SA).
Features: mean (till 20% of
the GC)
(e) Pelvis’ angle in X
(SA). Feature: mean.
(f) Hip’s joint moment in Y
(SA). Features: mean.
(g) Hip’s angle in X
(SD). Features: mean.
(h) Knee’s momentum force
in Y (SD). Feature: mean.
Figure 3: Plot of some of the gait cycle variables from
which features where selected as most distinctive. Individu-
als with low functionality score are plotted in blue, and high
functionality scores in black.
hip abduction joint moment (figure 3(h)) during this
task showing therefore not to rely, as much as the
HFFl group, on hip abductors to control the medial
lateral stability of the body.
6 CONCLUSIONS
This paper summarizes the potential of different ki-
netic and kinematic features, acquired using an 7
segments model (feet, shanks, thighs and pelvis), to
distinguish different functional fitness levels in an
sample of elderly population. Unsupervised learning
methodologies were used, and evidence was found
favouring the natural separation of elderly population
groups according to this parameter. Feature selection
has proven to be an effective tool in revealing interest-
ing variables increasing the discriminative capacity.
A set of best distinguishing features for each task
is presented along with an analysis of the features se-
lected and their meaning for the elderly locomotion.
The results showed that some of the differences ob-
served between groups are similar to the ones reported
in the literature when studying differences between
young and old subjects. In general, LFFl subjects
adopted a more flexed hip posture during the anal-
ysed taskstasks. Additionally, they seem, not only to
redistribute joint moments and compensate their lack
of plantarflexor moment with a higher hip extensor
moment, but also not to rely on the hip abductors, as
much as the HFFL group, to control medio-lateral sta-
bility in more challenging tasks (SA and SD). These
changes may increase the predisposition to fall in the
LFFl group. Further, this could mean that changes in
gait pattern may not be only a consequence of age-
ing, but also be caused by losses in functionality. The
further investigation of these different gait patterns is
therefore important for the establishment of exercise
programs, aiming to improve functionality and there-
fore to prevent falls, for this population.
Future work includes trying different learning
methods and feature selection methods and an exten-
sive evaluation of the approach for larger data sets.
ACKNOWLEDGEMENTS
The authors are grateful to all the subjects who
volunteered to participate in this study. This
work was supported by the Portuguese Foun-
dation for Science and Technology (SFRH/BD
/36670/2007, SFRH/PROTEC/49512/2009 and
PTDC/DES/103178/2008 - InVivoMuscle).
REFERENCES
Alelyani, S., Tang, J., and Liu, H. (2013). Feature selection
for clustering: A review. Data Clustering: Algorithms
and Applications, CRC Press
RelevantElderlyGaitFeaturesforFunctionalFitnessLevelGrouping
159

Begg, R. and Kamruzzaman, J. (2005). A machine learn-
ing approach for automated recognition of movement
patterns using basic, kinetic and kinematic gait data.
Journal of biomechanics, 38(3):401–408.
Cappozzo, A., et al. (1995). Position and orientation in
space of bones during movement: anatomical frame
definition and determination. Clin Biomech (Bristol,
Avon), 10(4):171–178.
Chan, K., et al. (2002). Comparison of machine learn-
ing and traditional classifiers in glaucoma diagnosis.
Biomedical Eng, IEEE Trans on, 49(9):963–974.
Chau, T. (2001a). A review of analytical techniques for
gait data. part 1: fuzzy, statistical and fractal methods.
Gait & Posture, 13(1):49–66.
Chau, T. (2001b). A review of analytical techniques for
gait data. part 2: neural network and wavelet methods.
Gait & Posture, 13(2):102–120.
DeVita, P. and Hortobagyi, T. (2000). Age causes a redis-
tribution of joint torques and powers during gait. J.
Appl. Physiol., (88):1804–1811.
Fred, A. L. (2001). Multiple Classifier Systems, chapter
Finding consistent clusters in data partitions. Springer.
Halkidi, M., Batistakis, Y., and Vazirgiannis, M. (2002).
Cluster validity methods: Part i. SIGMOD Record.
Hausdorff, J., et al.(1997). Altered fractal dynamics of
gait: reduced stride-interval correlations with aging
and huntingtons disease. J Appl Physiol, 82(1):262–9.
Horv
´
ath, M.,et al. (2001). Kinematic and kinetic analyses of
gait patterns in hemiplegic patients. Facta univ-series:
Physical Edu and Sport, 1(8):25–35.
Ishii, Y.,s et al. (1996). Influence of total knee replacement
(tkr) design on screw-home movement: Comparison
of five designs for total knee replacement prostheses.
Journal of Orthopaedic Science, 1:313–317.
Jain, A. K. and Dubes, R. (1988). Algorithms for Clustering
Data. Prentice Hall.
Janssen, D., Schllhorn, W., et al. (2011). Diagnosing fatigue
in gait patterns by support vector machines and self-
organizing maps. Hum Mov Sci, 30(5):966–75.
Jiang, S., et al. (2010). Gait symmetry analysis based on
affinity propagation clustering. In Computer and Inf
Tech (CIT), IEEE 10th Int Confe on, 1673–1678.
Kohle, M., et al. Clinical gait analysis by neural networks:
issues and experiences. In Computer-Based Medical
Systems., 1997. Proc., 10th IEEE Symp on, 138–143.
Lu, T. and O’Connor, J. (1999). Bone position estimation
from skin marker co-ordinates using global optimisa-
tion with joint constraints. J Biomech, 32(2):129–34.
Molina, L. C., Belanche, L., and Nebot, A. (2002). Feature
selection algorithms: A survey and experimental eval-
uation. In Proceedings of the 2002 IEEE International
Conference on Data Mining, ICDM ’02, pages 306–,
Washington, DC, USA. IEEE Computer Society.
Moniz-Pereira, V., Carnide, F., et al. (2012). Falls in por-
tuguese older people: procedures and preliminary re-
sults of the study biomechanics of locomotion in the
elderly. Acta Reumtol. Port., 37:324–332.
Mulroy, S., Gronley, J., et al. (2003). Use of cluster analy-
sis for gait pattern classification of patients in the early
and late recovery phases following stroke. Gait & Pos-
ture, 18(1):114 – 125.
Murtagh, F. and Legendre, P. (2011). Ward’s hierarchical
clustering method: Clustering criterion and agglomer-
ative algorithm. CoRR, abs/1111.6285.
Novak, A. and Brouwer, B. (2011). Sagittal and frontal
lower limb joint moments during stair ascent and
descent in young and older adults. Gait Posture,
33(1):54–60.
Prince, F., Corriveau, H., et al. (1997). Gait in the elderly.
Gait & Posture, 5(2):128–135.
Pudil, P., Novovi
ˇ
cov
´
a, J., and Kittler, J. (1994). Floating
search methods in feature selection. Pattern recogni-
tion letters, 15(11):1119–1125.
Raudys, S. J. and Jain, A. K. (1991). Small sample size ef-
fects in statistical pattern recognition: Recommenda-
tions for practitioners. IEEE Tran. on pattern analysis
and machine intelligence, 13(3):252–264.
Reid, S. M., et al. (2010). Differentiation of young and
older adult stair climbing gait using principal compo-
nent analysis. Gait & Posture, 31(2):197 – 203.
Rikli, R. E. and Jones, C. J. (1999). Development and
validation of a functional fitness test for community-
residing older adults. IEEE Trans Pattern Analysis
and Machine Intelligence, (7):129–161.
Rose, D., Lucchese, N., and Wiersma, L. (2006). Develop-
ment of a multidimensional balance scale for use with
functionally independent older adults. Arch. Phys.
Med. Rehabil., (87(11)):14781485.
Rubenstein, L. Z. (2006). Falls in older people: epidemi-
ology, risk factors and strategies for prevention. Age
and Ageing, 35 Suppl 2:ii37ii41.
Su, F.-C., Wu, W.-L., Cheng, Y.-M., and Chou, Y.-L.
(2001). Fuzzy clustering of gait patterns of patients
after ankle arthrodesis based on kinematic parameters.
Medical Engineering & Physics, 23(2):83 – 90.
Todd, D. and Skelton, C. (2004). What are the main risk
factors for falls amongst older people and what are
the most effective interventions to prevent these falls?
Copenhagen: WHO Regional Office for Europe.
Toro, B., Nester, C. J., and Farren, P. C. (2007). Clus-
ter analysis for the extraction of sagittal gait pat-
terns in children with cerebral palsy. Gait & Posture,
25(2):157–65.
Vaughan, C. L. and O’Malley, M. J. (2005). A gait nomo-
gram used with fuzzy clustering to monitor func-
tional status of children and young adults with cere-
bral palsy. Dev Med Child Neurol, 47(6):377–83.
Vinh, N., Epps, J., and Bailey, J. (2010). Information the-
oretic measures for clusterings comparison: Variants,
properties, normalization and correction for chance. J.
Mach. Learn. Res., pages 2837–2854.
Winter, D. (1991). The Biomechanics and Motor Control of
Human Gait: Normal,Elderly and Pathological. Wa-
terloo: University of Waterloo Press.
Xu, G., Zhang, Y., and Begg, R. (2006). Mining gait pattern
for clinical locomotion diagnosis based on clustering
techniques. In Proc of the 2nd int conf on Adv Data
Mining and Appl, 296–307. Springer-Verlag.
PhyCS2014-InternationalConferenceonPhysiologicalComputingSystems
160
