
The Role of Personalization and Multiple EEG and Sound Features
Selection in Real Time Sonification for Neurofeedback
S. Mealla
1
, A. Oliveira
1
, X. Marimon
2
, T. Steffert
3
, S. Jord
`
a
1
and A. V
¨
aljam
¨
ae
4,5
1
Music Technology Group (MTG), Department of Information and Communication Technologies (DTIC),
Universitat Pompeu Fabra, Barcelona, Spain
2
BarcelonaTECH, LASSIE Lab, Automatic Control Department, Universitat Politecnica de Catalunya, Barcelona, Spain
3
Centre for Research in Computing, The Open University, Milton Keynes, Buckinghamshire, U.K.
4
Department of Higher Nervous Activity, St. Petersburg State University, St. Petersburg, Russia
5
Department of Behavioural Sciences and Learning, Link
¨
oping University, Link
¨
oping, Sweden
Keywords:
Sonification, EEG, Alpha/Theta Neurofeedback, Physiological Computing, Pure Data, Sound, Real Time.
Abstract:
The field of physiology-based interaction and monitoring is developing at a fast pace. Emerging applications
like fatigue monitoring often use sound to convey complex dynamics of biological signals and to provide an
alternative, non-visual information channel. Most Physiology-to-Sound mappings in such auditory displays
do not allow customization by the end-users. We designed a new sonification system that can be used for
extracting, processing and displaying Electroencephalography data (EEG) with different sonification strate-
gies. The system was validated with four user groups performing alpha/theta neurofeedback training (a/t) for
relaxation that varied in feedback personalization (Personalized/Fixed) and a number of sonified EEG fea-
tures (Single/Multiple). The groups with personalized feedback performed significantly better in their training
than fixed mappings groups, as shown by both subjective ratings and physiological indices. Additionally, the
higher number of sonified EEG features resulted in deeper relaxation than when training with single feature
feedback. Our results demonstrate the importance of adaptation and personaliziation of EEG sonification ac-
cording to particular applications, in our case, to a/t neurofeedback. Our experimental approach shows how
user performance can be used for validating different sonification strategies.
1 INTRODUCTION
Recent advances in human physiological sensors and
signal processing techniques have fostered the de-
velopment of computer systems for online control,
training and monitoring of various cognitive and af-
fective states (Allanson and Fairclough, 2004). In
addition, an increasing number of consumer of-the-
shelf devices and open source platforms transform
physiology-based interaction into an important part of
the Human Computer Interaction (HCI) field. Sys-
tems like the Emotiv EPOC (Emotiv, 2013), or Star-
lab’s Enobio (Neuroelectrics, 2013) now allow a
low cost and wearable electroencephalography (EEG)
sensing in out-of-the-lab, real life conditions, increas-
ing “external validity” of conducted research.
Sonification techniques have been widely used
to display EEG activity and are often an integral
part of physiological computing. Besides being ide-
ally suited for encoding complex dynamic structures
due to auditory perception characteristics (Guttman
et al., 2005), sound provides a complementary sen-
sory channel complementing visual displays. Hence,
EEG sonification is a growing field of auditory dis-
plays that embrace several application domains in-
cluding HCI, Brain-Computer Interfaces (BCI), EEG-
based music, neurofeedback (NF) and EEG monitor-
ing (see (V
¨
aljam
¨
ae et al., 2013) for a review).
The selection of functional EEG-to-Sound trans-
formations is a difficult task involving perceptual and
aesthetical trade-offs depending on their application
and goals (Hermann et al., 2002). On the one hand,
simple EEG-to-sound mappings allow direct percep-
tion of changes in the EEG, producing almost re-
versible signals, e.g., EEG time compression with the
purpose of pre-screening specific brain activity events
(Khamis et al., 2012). However, such sonifications
tend to be unnatural and not well suited for hearing
out multiple EEG events. On the other hand, more in-
direct transformations provide more naturalistic, rich
323
Mealla S., Oliveira A., Marimon X., Steffert T., Jordà S. and Väljamäe A..
The Role of Personalization and Multiple EEG and Sound Features Selection in Real Time Sonification for Neurofeedback.
DOI: 10.5220/0004727203230330
In Proceedings of the International Conference on Physiological Computing Systems (PhyCS-2014), pages 323-330
ISBN: 978-989-758-006-2
Copyright
c
2014 SCITEPRESS (Science and Technology Publications, Lda.)
and perceptually pleasant sonifications. The trade-off
here is an arbitrary mapping, as, for example, with
EEG driven musical content in (Mullen et al., 2011)
that hides original physiological features from listen-
ers. In this context, end-users impression of the de-
signed sonifications becomes a crucial factor for the
application success.
Regrettably, most of the available EEG sonifica-
tions are working with a constant and predefined num-
ber of EEG features, and also apply fixed, predefined
EEG-to-Sound mappings that cannot be changed by
end users. De Campo and colleagues conducted one
of the few studies addressing the personalization of
EEG sonification, i.e. adjustment of display parame-
ters by end users (De Campo et al., 2007). Tests were
done with medical specialists performing evaluation
of EEG data containing epileptic events and seizures
and showed the importance of sonification parameters
customization.
To study both varying content (richness) and per-
sonalization aspects of auditory display for physio-
logical data, we created a real-time sonification sys-
tem that accounts for a flexible multi-parametric EEG
signal transformation into sound, also allowing users
to personalize EEG-to-Sound mappings in real time.
We tested our EEG sonification system in an em-
pirical study based on well-established alpha/theta
(a/t) neurofeedback training paradigm (see (Gruzelier,
2009) for a review). During this training, users try to
relax with their eyes being closed. The most impor-
tant moment is the so-called theta/alpha “crossover”
when alpha activity slowly subsides accompanying
sleep onset and theta activity becomes more dominant
(Egner et al., 2002). The increase of t/a power ratio
with eyes closed is a well known accompaniment of
states of deep relaxation such as stage 1 of sleep and
meditation (Gruzelier, 2009).
As the a/t NF training is typically based on audi-
tory feedback, it is a good candidate to validate the
effectiveness of personalization and sonification rich-
ness of our auditory display. We used our sonifica-
tion system to present a pleasant soundscape contin-
gent to the production of theta, alpha, and/or t/a ra-
tio. Specifically, we hypothesized that a/t NF training
would have:
• Hypothesis 1 - More impact for participants that
are using personalized sonification mappings than
using pre-defined, fixed sound mappings;
• Hypothesis 2- More impact for participants us-
ing multiple EEG feature sonification compared
to one only based on t/a ratio;
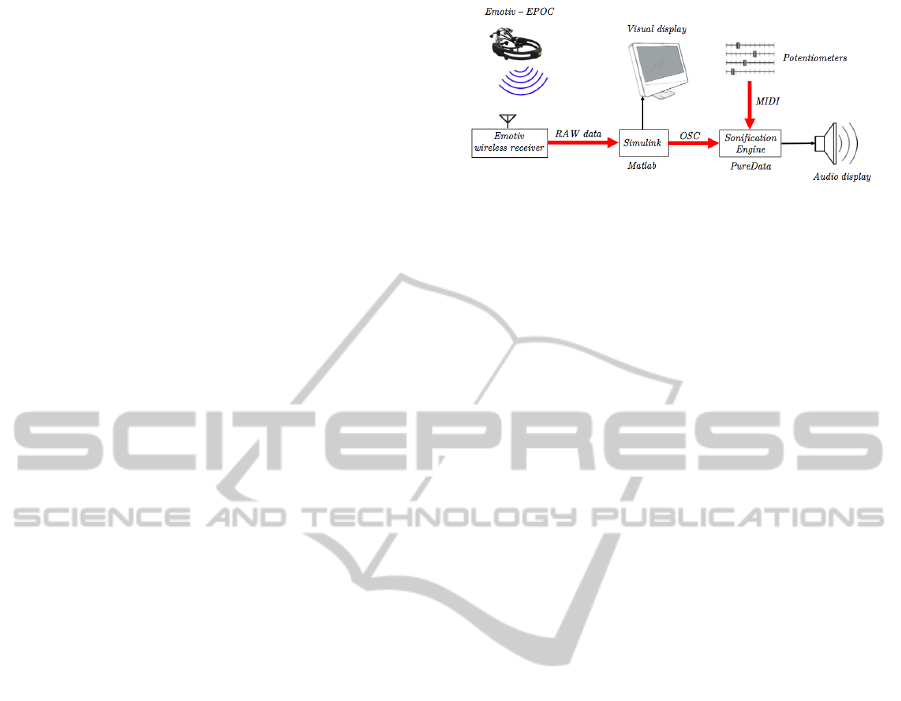
Figure 1: Components and data streams of the sonification
system: EEG signal acquisition, signal extraction and pro-
cessing, and sonification engine.
2 METHODS
2.1 Equipment and Instrumentation
The system is composed of three main blocks: (1)
EEG signal acquisition, (2) signal extraction and pro-
cessing, and (3) the sonification engine. It allows
designers to build customized and versatile mapping
definitions. Figure 1 shows the architecture of the
sonification system.
2.1.1 EEG Signal Acquisition
EEG data is acquired using an Emotiv EPOC, a wire-
less, non-invasive 14-channel EEG headset (Emotiv,
2013). The EPOC is one of the leaders in low-cost
consumer EEG sensing devices. Although it can not
be reliably used for most BCI applications since its
signal-to-noise levels are lower than in medical de-
vices (Duvinage et al., 2013), it has been used suc-
cessfully for user states monitoring (Rodr
´
ıguez et al.,
2013). The EPOC’s electrodes require a saline solu-
tion to improve conductivity, and their placement is
related to the 10-20 system. EPOCs data is sampled
at 128Hz and low- and high-pass filtered internally at
85Hz and 0.16Hz respectively. This semi-raw data is
accessed through the EPOC SDK (Emotiv, 2013) and
then accessed by Matlab/Simulink model.
2.1.2 Signals Extractions and Processing
We designed a toolbox for Matlab/Simulink to pro-
cess EPOCs EEG data, both online and offline, and to
feed the sonification engine. A number of processing
blocks described below allow extracting EEG features
in a modular way, adapting to different neurofeedback
or monitoring strategies.
• Emotiv2Simulink, based on a Mex S-function and
on the drivers provided by the manufacturer, it al-
lows the access to the raw data of the EPOC.
• BP filters, Butterworth IIR discrete band-pass
(BP) filters that can be tuned to any given custom
PhyCS2014-InternationalConferenceonPhysiologicalComputingSystems
324

frequency.
• Envelope, is a block that squares the input signal
and then applies a FIR low-pass filter and down-
sampling to estimate its envelope.
• MaxMin, is a block based on a configurable win-
dow of size L; it estimates the maximum, mini-
mum and median value of a signal in the temporal
and frequency domain.
• Hjorth Descriptors, calculate the Hjorth parame-
ters for activity, mobility, and complexity (Liang
et al., 2013)(Hjorth, 1970).
• OSCSend, allows direct communication via UDP
with virtually any modern real-time sound synthe-
sis environment through the Open Sound Control
(OSC) protocol(Wright, 2005).
2.1.3 Sonification Engine
A versatile sonification engine was developed using
PureData (Pd) (Puckette et al., 1996). The engine has
been built following a modular approach that allows
sonification designers to choose among different EEG
features (processed in the Simulink toolbox) and their
number, and to define a certain EEG-to-Sound map-
ping. Although the system has been tested with only
3 EEG features feeding 5 sound modules in parallel,
there are no restrictions on the number of modules
to be displayed, other than hardware limitations (i.e.
processing power). Multiple EEG streams also can
feed a single sound module. Importantly, the engine
also allows further adjustment by end users via MIDI
controllers.
Below we provide a description of the different
modules of the sonification engine. For flexibility and
easiness, all inputs of the sonification engine modules
are normalized between 0 and 100.
Pedal module. A fixed pitch tonic sound is ini-
tialized on loading (D2, MIDI note n
o
38). A tremolo
effect is applied and phase shifted to each of the even
harmonics, giving a slowly moving chorus-like tim-
bre to the drone. Inputs for this module are able to
control tremolo, panning and gain.
Melody Module. The melody is constructed us-
ing a major scale stemming from five semitones (one
fourth) bellow the central tonic to sixteen semitones
above it (major third). The slope of the incoming sig-
nal controls note triggering speed and pitch, whereas
the volume is controlled by a linear function of the
input signal.
Rewarding Module. This module triggers short
duration nature sounds (birds, owls, and crickets)
when the input signal goes over a predefined threshold
value. Therefore, every time the input signal is over
the threshold set, the user is rewarded with a more
varying yet still relaxing soundscape. A dynamic am-
plitude panning allows use of spatial audio.
Wind Model. Based on a procedural audio, this
module use a series of white noise generators to
generate a wind soundscape. The use of procedu-
ral audio (in contrast to a sample-based approach)
gives a complete control over sound parameters (e.g.,
wind speed). Therefore, the perceptual quality of
the windy scene dynamically changes according to
mapped EEG features.
Rain Model. Based on a sample-based approach,
this module preserves soundscape fidelity using dy-
namic cross fading between different rain excerpts. It
also allows a comparison with the procedural audio
approach of the Wind Module. Input signal modu-
lates the amount of excerpts in the resulting compos-
ite Rain density, which varies from a light rain to a
small thunderstorm.
Graphic User Interface and Personalization. A
graphic user interface (GUI) was created to simplify
the patching between different sound modules and
EEG features. It also contains time and frequency
signal monitoring scopes for both input (EEG) and
output (sound) data. The GUI also displays tools for
users’ personalization via MIDI controller, allowing
them to adjust their mapping “on the fly” while lis-
tening to the sonification results in real-time.
Users are able to personalize, i.e. adjust, the map-
pings as follows. One EEG feature is associated
to one sound element (e.g. alpha relative power is
mapped to Rain density). The user is then allowed
to change the mapping in a continuous scale from -1
to +1. If the potentiometer is dragged to -1, the map-
ping is inversed, i.e. a greater value of the data feature
yields a smaller value for the sound parameter (more
alpha would lead to less rain). If it is positioned at 1,
the mapping is positive (more alpha yields more rain).
In the middle (zero), the sound is fixed and not influ-
enced by the data (a fixed amount of rain equivalent
to 50% of its maximum value, independently of the
alpha power).
2.1.4 Settings used in the Experiment
Figure 2 shows the system configuration for our eval-
uation study.
The EEG toolbox has been configured to extract
three main EEG features, according to the a/t NF pro-
tocol (Gruzelier, 2009). In accordance with previ-
ous NF studies (Egner et al., 2002), alpha relative
power (8 − 13 Hz range) is calculated from the oc-
cipital area where this type of activity occurs during
close-eye conditions (Kropotov, 2010). The second
feature, theta relative power (4 − 7.5 Hz range) is cal-
TheRoleofPersonalizationandMultipleEEGandSoundFeaturesSelectioninRealTimeSonificationforNeurofeedback
325
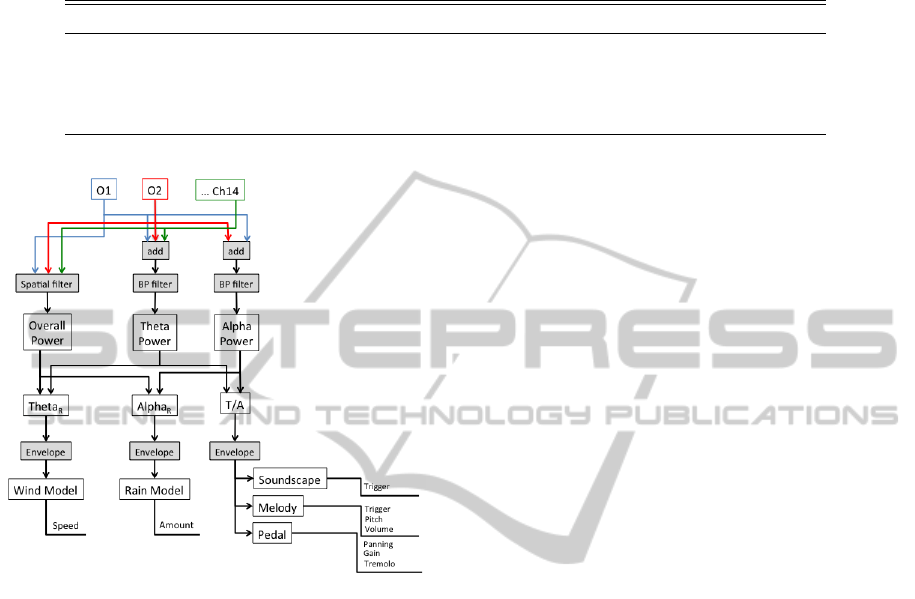
Table 1: Configuration of the Sound Engine for each group, defined by type of mapping (Personalized or Fixed) and number
of EEG features (Single or Multiple). EEG features include t/a ratio, and relative power of Alpha and Theta). “ Personalized”
stands for adjusted mappings driven by EEG, “Fixed” stands for fixed mapping driven by EEG, and “Constant” stands for
sound feature held constant.
Group Foreground Rewarding Wind Rain
F-S t/a ratio (Fixed) t/a ratio Constant Constant
P-S t/a ratio (Personalized) t/a ratio Constant Constant
F-M t/a ratio (Fixed) t/a ratio theta (Fixed) alpha (Fixed)
P-M t/a ratio (Personalized) t/a ratio theta (Personalized) alpha (Personalized)
Figure 2: Processing stages of EEG features and corre-
sponding sound mappings.
culated from the activity of all 14 channels, as corti-
cal theta rhythms are small and diffuse when picked
up by scalp electrode, arising almost entirely from the
cerebral cortex (Kropotov, 2010). These two relative
powers are obtained by dividing the band power by
the overall signal power. In this manner, the output
signal is kept within a range of 0 to 1. Finally, the
third feature, t/a power ratio, is estimated as the main
measure for the a/t NF procedure. A spatial filtering is
applied to give more weight to the occipital channels
in the calculation of the envelope of the alpha band
and alpha-theta ratio. For the calculation of the en-
velope of theta, equal weight for all channels is used.
The envelope is estimated for all three EEG features
using the envelope block based on FIR-based filter
(order 35).
The sound engine has been configured as follows
(see also table 1):
• Pedal Module: tremolo, panning and gain are lin-
early mapped to t/a ratio.
• Melody module: note triggering speed and pitch
are functions of the t/a ratio where its positive
change yield ascending pitches while negative
ones leads to descending pitches. Higher rate
of change yields bigger jumps in melody (more
semitones between two consecutive notes). The
note volume is a linear function of t/a ratio.
• Rewarding module: Threshold is set at 50% of the
calibrated maximum value of t/a ratio recorded
prior to the main training session.
• Wind model: Theta relative power controls wind
speed of the modeled sound object - the higher is
the input, the faster the wind will “blow”.
• Rain model: Alpha relative power is used to con-
trol Rain density.
The experiment was conducted in a room iso-
lated from external noise. Participants were seated
on a swivel chair equally distant to four loudspeakers
(Roland active Loudspeakers, Model MA15-D, and
a M-Audio sound card, FastTrack Pro). Previous re-
search has shown that spatial rendering increases af-
fective impact of sound (Vastfjall, 2003). The lights
were dimmed down during the personalization and
pre-relaxation sessions (see Procedure section) and
turned off during the a/t NF session. A 42 inches
screen (not visible to the for participants) was used
to monitor the EEG signal quality and levels.
2.2 Experimental Procedure
Two hypotheses were tested using a between-
subjects design. Thirty one participants, mean age
27.81(SD = 5.18), 15 females, took part in the exper-
iment. The study was conducted in accordance with
the Declaration of Helsinki. Participants were ran-
domly distributed among four experimental groups:
• F-S Group: Fixed EEG-to-Sound mappings, Sin-
gle EEG feature sonified (M = 26, SD = 2);
• P-S Group: Personalized mappings, Single EEG
feature sonified (M = 27.6, SD = 5);
• F-M Group: Fixed mappings, Multiple EEG fea-
tures (M = 30, SD = 8);
PhyCS2014-InternationalConferenceonPhysiologicalComputingSystems
326

• P-M Group: Personalized mappings, Multiple
EEG features sonified (M = 27.5, SD = 4).
All groups listened to soundscapes of a compara-
ble complexity, but these varied in the number of EEG
features feeding the system, and in the sonification
mappings applied. Table 1 shows the configuration
of the sound engine for each group. Each experiment
lasted around 50 minutes, according to the following
protocol:
• Information and Consent Form: The participant
was explained each stage of the experiment, and
the relation between brain activity and the created
soundscape; the consent form was signed.
• Initial emotional State Self-assessment: Subjec-
tive measures of emotional valence and arousal
were collected in paper through a 9-point Self-
Assessment Manikin (SAM) after (Bradley and
Lang, 1994).
• Sensor Placement and Baseline State Recording:
The participant was seated in a swivel chair, and
the Emotiv EPOC was mounted. The baseline
EEG activity was recorded.
• Relaxation Induction: The participant was asked
to close her eyes and listen to a 5-minute sound
of sea waves. EEG activity was recorded, and
the thresholds for NF session were calculated by
looking at the maxima and minima values.
• Pre-test emotional State Self-assessment: The
participant filled-in again two SAM scales.
• Mapping adjustment: EEG features were sonified
online. The participant was asked to personalize
the mappings till reaching the most relaxing sound
possible, using a MIDI interface with potentiome-
ters placed in front of the chair. There was no time
limit set to define the mappings.
• NF Training Session: The participant was asked
to close her eyes and to turn the chair facing away
from the experiment leader. Participants were
asked to relax and to listen to the soundscape (dif-
ferent for each group) for 15 minutes. Participants
were instructed to raise their hand if feeling un-
comfortable or falling asleep.
• Post-test emotional State Self-assessment: partic-
ipants filled-in two SAM scales again.
• Headset Removal and Debriefing: the EEG head-
set was removed. Participants were debriefed,
thanked and received candies as a small reward.
2.3 Data Analysis
For analysis purposes, the raw EEG data with sam-
pling at 128 Hz was first filtered (0.5 − 30Hz). Using
visual inspection and thresholding (over 3 σ) data re-
gions with artefacts were marked for removal in sub-
sequent analyses. Closely following the design of the
NF training protocol (see section 2.1.4), we analyzed
data from O1 and O2 electrodes. Signals were BP fil-
tered to obtain alpha (8−13 Hz) and theta (4−7.5 Hz)
components. The 15 minute data recordings were
split into 10s epochs and for each of them relative
alpha, relative theta and t/a ratio where calculated.
Next, we averaged the means from individual epochs
for five 3 − min periods (18 epochs each) excluding
the epochs marked as containing artifacts. This was
done for O1 and O2 channels separately. Then we
used the values averaged across both channels and
used the means from the first and the last 3 − min pe-
riod of experimental procedure for analysis. In other
words, we compared maximal changes caused by 15
minute training in relative alpha, relative theta and t/a
ratio.
Both subjective (SAM ratings of pre and post as-
sessment of emotional state) and objective measures
(EEG features) of two relaxation periods were sub-
jected to 3-way MANOVA. Therefore within-subjects
factor was Relaxation periods (1-3 min vs. 12-15
min period), whereas between-subjects factors were
Number of sonified EEG features (Single vs. Multi-
ple) and Feedback personalization (Personalized vs.
Fixed mapping). Alpha level was fixed at 0.05 for all
statistical tests. Greenhouse-Geisser correction was
used to correct for unequal variances. For multivariate
analysis Wilks
0
Lambda Λ was used as the multivari-
ate criterion. All variables were normally distributed
according to the Kolmogorov-Smirnov test.
3 RESULTS
In accordance with the relaxing nature of the exper-
imental procedure, the overall MANOVA effect of
Relaxation period was significant with F(5, 23) =
6.89, p < 0.001, Λ = 0.4,
ˆ
η
2
P
= 0.6. Split by measures,
this effect reached significance for: subjective arousal
ratings, F(1, 27) = 26.06, p < 0.001,
ˆ
η
2
P
= 0.49; for
relative alpha power, F(1, 27) = 5.81, p < 0.05,
ˆ
η
2
P
=
0.18; for relative theta power, F(1, 27) = 10.4, p <
0.005,
ˆ
η
2
P
= 0.28; and for t/a ratio, F(1, 27) =
5.45, p < 0.05,
ˆ
η
2
P
= 0.17. This shows that partic-
ipants in all four groups reached a certain level of
relaxation as compared with the initial 3 minute pe-
riod of the experiment. More importantly, the inter-
action between the Relaxation period and between-
group factors of Number of sonified EEG features and
Feedback personalization also showed significance.
Confirming our Hypothesis 1, the over-
TheRoleofPersonalizationandMultipleEEGandSoundFeaturesSelectioninRealTimeSonificationforNeurofeedback
327
−2.5
−2
−1.5
−1
−0.5
0
F−S P−S F−M
**
P−M
*
Arousal reduction, SAM (1..9), (period 5 − period 1)
−0.5
0
0.5
1
1.5
F−S P−S F−M P−M
**
t/a ratio difference, (period 5 − period 1)
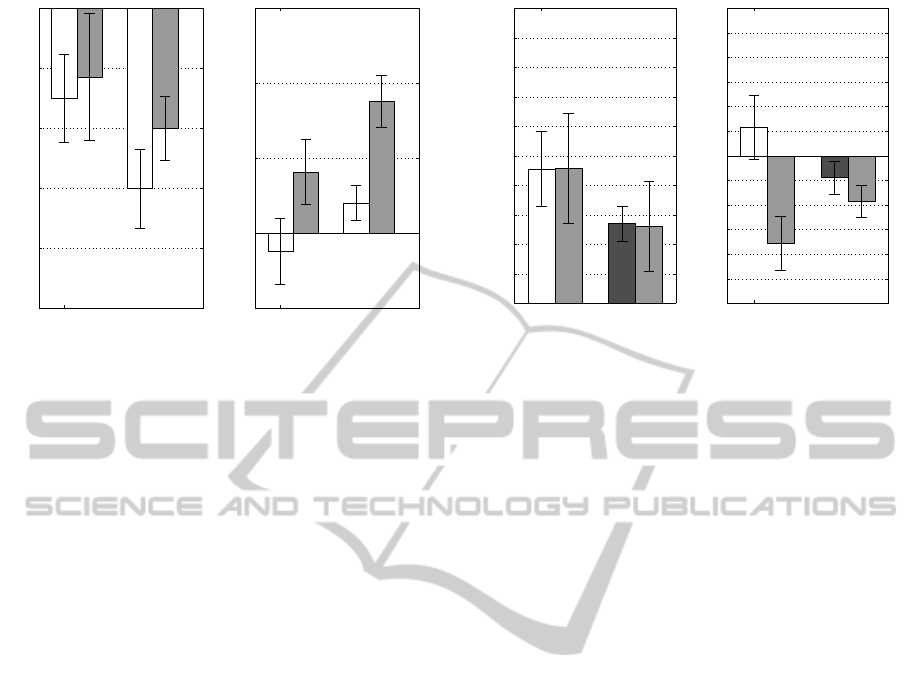
Figure 3: The means of the difference between the first
and the final 3-min period of the 15-minute session. Sub-
jective arousal (left panel) and t/a ratios (right panel) are
shown for four experimental groups: F-S (Fixed map-
ping/Single feature), P-S (Personalized mapping/Single fea-
ture), F-M (Fixed mapping/Multiple features), P-M (Per-
sonalized mapping/Multiple features). Error bars represent
standard error values. Bonferroni-corrected significant dif-
ference from 0 at p < 0.05 (*), and at p < 0.01 (**) levels.
all MANOVA effect of Relaxation period ×
Feedback personalization was significant with
F(5, 23) = 2.58, p < 0.05, Λ = 0.64,
ˆ
η
2
P
= 0.36.
This effect reached significance both for t/a ratio
at F(1, 27) = 13.14, p < 0.001,
ˆ
η
2
P
= 0.33; and
for relative alpha power, F(1, 27) = 10.08, p <
0.005,
ˆ
η
2
P
= 0.27. Changes in relative theta power
did not reach significance. For the groups with
personalized feedback, t/a ratios increased from
0.73(SE = 0.2) to 1.42(SE = 0.2), while for the
groups with fixed mappings such change could not be
found; the period means 0.93 (SE = 0.2) for the first
and 0.79 (SE = 0.2) for the fifth one (see also Figure
3, right panel). Similar pattern occurred for relative
alpha levels, with the means for personalized groups
dropping from 0.29 (SE = 0.04) to 0.15 (SE = 0.03),
and steady level means for groups with fixed map-
pings of 0.2(SE = 0.04). This effect can be also see
in Figure 4 (right panel) where differences between
the last and the first period are plotted.
In line with our Hypothesis 2, the overall
MANOVA effect of Relaxation period × Number of
sonified EEG features was significant with F(5, 23) =
5.09, p < 0.005, Λ = 0.48,
ˆ
η
2
P
= 0.53. This effect
reached significance only for t/a ratio at F(1, 27) =
8.94, p < 0.01,
ˆ
η
2
P
= 0.25. Here, the higher number of
sonified features in the feedback resulted in a bigger
t/a ratio increase from the mean of 0.83(SE = 0.2) at
the initial experiment stage to 1.45 (SE = 0.2) at the
final 3-min period. In comparison, groups with single
feature based feedback had no improvement, going
0
0.005
0.01
0.015
0.02
0.025
0.03
0.035
0.04
0.045
0.05
F−S
*
P−S F−M
**
P−M
Relative theta difference, (period 5 − period 1)
−0.25
−0.2
−0.15
−0.1
−0.05
0
0.05
0.1
0.15
0.2
0.25
F−S P−S F−M P−M
Relative alpha difference, (period 5 − period 1)
Figure 4: The means of the difference between the first and
the final 3-minute period of the 15-minute session. Rela-
tive theta power (left panel) and relative alpha power (right
panel) are shown for four experimental groups: F-S (Fixed
mapping/Single feature), P-S (Personalized mapping/Single
feature), F-M (Fixed mapping/Multiple features), P-M (Per-
sonalized mapping/Multiple features). Error bars represent
standard error values. Bonferroni-corrected significant dif-
ference from 0 at p < 0.05 (*), and at p < 0.01 (**) levels.
from the mean of 0.84 (SE = 0.2) to 0.76(SE = 0.2),
see also Figure 3 (right panel).
The triple interaction between Relaxation period
× Feedback personalization × Number of sonified
features could be also observed. It reached signifi-
cance only for the relative alpha, F(1, 27) = 5.13, p <
0.05,
ˆ
η
2
P
= 0.16. This effect can be better seen in Fig-
ure 4 (right panel), where differences between two
periods are plotted for each of participants
0
group.
While not significant when comparing the period dif-
ferences within each group, this interaction is re-
flected in bigger difference between F-S and P-S
groups as compared to the difference between F-M
and P-M groups.
4 DISCUSSION
The results from our between-group validation of
sonifications using a/t neurofeedback training con-
firmed the two initial hypotheses, both for subjective
and objective data. The significant differences be-
tween initial and final relaxation periods for P-S and
P-M groups using personalized feedback support our
first hypothesis that personalized EEG-to-Sound map-
pings will be more instrumental than the fixed ones. A
significant increase in t/a ratio and decrease in alpha
relative power were observed after 15-min NF ses-
sion. This trend was not repeated for F-S and F-M
user groups training with fixed sonification mappings.
Our second hypothesis, stating that multiple EEG
PhyCS2014-InternationalConferenceonPhysiologicalComputingSystems
328

feature sonifications will be more efficient than those
relying on a single EEG feature, was also confirmed.
A significant increase of t/a ratio and a significantly
lower reported subjective arousal after the NF session
was observed only for P-M and F-M groups with mul-
tiple feature feedback. As expected, the training effect
was smaller for P-S and F-S groups training with sin-
gle feature mappings.
Finally, changes in relative alpha power showed
an interaction between a number of sonified EEG
features and their personalization. Here, the differ-
ences between the P-S and F-S groups that were us-
ing fixed and personalized sonifications of a single
feature are bigger than between P-M and F-M groups
whose training was based on multiple EEG features.
In other words, personalization became less instru-
mental when multiple features were sonified. Here,
the decrease in attentional resources could explain
this effect. As a number of sound objects to attend be-
comes larger, it is more likely that “change deafness”
might reduce sonification efficiency (see a recent re-
view by (Shinn-Cunningham, 2008) on auditory spa-
tial attention). Certainly, the complexity of auditory
feedback is an object of a separate study.
Significant between-group differences in subjec-
tive and physiological data show that the observed re-
sults are not obtained merely due to relaxing nature of
presented soundscapes (wind, water, etc.). While we
did not aim to study specifically the neurofeedback
effects, the full procedure of a/t NF training with real-
time feedback differed from simple relaxation. Unde-
niably, more training sessions, larger number of par-
ticipants, and more robust EEG equipment should be
used to study brain dynamics during a/t training (e.g.
changes between training sessions, learning curves
within each NF session, individual differences etc.).
However, the observed results that varied significantly
between four test groups support the full functionality
of the conducted NF training. Therefore, we can ar-
gue that both sonification richness (a number of EEG
features to be displayed) and end-user personalization
play an important role in the effectiveness of real-time
EEG sonification for neurofeedback.
Our study did not include Sham group with fake
neurofeedback or Control group doing 15-minunte re-
laxation to compare with our results. While such con-
trol would be necessary to quantify the depth of relax-
ation with and without neurofeedback, this question
was not in scope of our study. As predicted, and also
as shown by the pre- and post-training differences, the
participants group F-S with fixed sonification of the
single EEG feature can be seen as a strongest base-
line for the three other groups.
Several observations can be made when compa-
ring our results with previous works on sonification
richness and personalization. The transparency of the
controls for sound adjustment was an important fac-
tor, as in the case of sonification-based EEG diagnos-
tic by expert users (De Campo et al., 2007). The pos-
itive effect of personalization in our studies demon-
strates that the task of sonification adjustment was
clear and understandable for naive end-users. How-
ever, generation and direct evaluation of intuitive in-
terfaces for both end-users and experts should be fur-
ther explored. In this regard, we plan to integrate
our sonification system into a tabletop, tangible inter-
face. Our previous work shows that such multimodal
Brain-Tangible User Interfaces (BTUI) foster perfor-
mance and motivational aspects of interaction, allow-
ing for multi-user setups with shared interface con-
trol for training and collaborative work (Mealla et al.,
2011).
Another issue is the problem of validation in soni-
fication studies as pointed out by (V
¨
aljam
¨
ae et al.,
2013). While diagnostic and neurofeedback appli-
cations are expected to have a rigorous assessment,
most of EEG sonification studies lack a proper vali-
dation, making difficult to determine the efficiency of
a particular EEG sonification strategy. Certainly, this
lack of quantitative assessment reflects the ongoing
development in this research field. In this context, we
contributed to the methodologies for sonification val-
idation through a combination of objective and sub-
jective measures using a well-known neurofeedback
scenario. Some discrepancy between subjective rat-
ings and physiological indices observed in our study
should encourage the use of multimodal measures.
Finally, it is important to note a number of advan-
tages offer by the presented sonification system. First,
model-based sonification provides a wide range of
richness and manipulation, versatile EEG-to-Sound
mapping, and realistic dynamic sounds. Here, several
EEG features can be used as an input to one model,
e.g. rain model, where its several parameters can vary
(amount, loudness, sound characteristics). Second,
the use of Pd permits a modular approach, allowing
the combination of different sound objects and the
addition of new ones. Special interest here present
sounds that are directly related to user emotional state
like breathing or heart beat (Tajadura-Jimenez et al.,
2008). Other future work include testing different NF
protocols, integrating and evaluating the system with
other EEG devices (Mealla et al., 2011), and study-
ing user preferences for sound mappings and their ef-
fectiveness for medical or training applications. Fi-
nally, future work regarding the a/t training protocol
will imply tests with several sessions, different sound
models and other EEG equipment.
TheRoleofPersonalizationandMultipleEEGandSoundFeaturesSelectioninRealTimeSonificationforNeurofeedback
329

5 CONCLUSIONS
A real-time sonification system was used to design
flexible, multi-parametric EEG data sonifications,
that were later adjusted in real time by end-users to
personalize the mappings. Four settings varying in
feedback richness and personalization were evaluated
using 15-min a/t neurofeedback training and between-
subjects design. Comparing both subjective and phys-
iological data from pre- and post-training showed sig-
nificant relaxation in groups with personalized feed-
back, while not in groups training with fixed sonifica-
tion mappings. In addition, a larger number of soni-
fied EEG features resulted in higher t/a ratio increase.
These results demonstrate that both sonification rich-
ness (a number of EEG features to be displayed) and
end-user personalization play an important role in the
effectiveness of real-time EEG sonification for neuro-
feedback.
ACKNOWLEDGEMENTS
The last author of this paper received funding from
Marie Curie Actions of the European Union’s Seventh
Framework Programme (FP7/2007-2013) under REA
GA-303172.
REFERENCES
Allanson, J. and Fairclough, S. (2004). A research agenda
for physiological computing. Interacting with Com-
puters, 16(5):857–878.
Bradley, M. M. and Lang, P. J. (1994). Measuring emotion:
The self-assessment manikin and the semantic differ-
ential. Journal of Behavior Therapy and Experimental
Psychiatry, 25(1):49 – 59.
De Campo, A., Hoeldrich, R., Eckel, G., and Wallisch, A.
(2007). New Sonification Tools For Eeg Data Screen-
ing And Monitoring. In Proceedings of the 13th In-
ternational Conference on Auditory Display, volume
67(2009)90, pages 536–542.
Duvinage, M., Castermans, T., Petieau, M., Hoellinger, T.,
Cheron, G., and Dutoit, T. (2013). Performance of
the emotiv epoc headset for p300-based applications.
Biomed Eng Online, 12:56.
Egner, T., Strawson, E., and Gruzelier, J. (2002). Eeg sig-
nature and phenomenology of alpha/theta neurofeed-
back training versus mock feedback. Applied Psy-
chophysiology and Biofeedback, 27(4):261–270.
Emotiv (2013). Emotiv epoc. http://www.emotiv.com.
Gruzelier, J. (2009). A theory of alpha/theta neurofeed-
back, creative performance enhancement, long dis-
tance functional connectivity and psychological inte-
gration. Cognitive Processing, 10(1):101–109.
Guttman, S. E., Gilroy, L. A., and Blake, R. (2005). Hearing
what the eyes see: Auditory encoding of visual tempo-
ral sequences. Psychological Science, 16(3):228–235.
Hermann, T., Meinicke, P., and Bekel, H. (2002). Sonifi-
cations for EEG data analysis. In Proceedings of the
International Conference on Auditory Display (ICAD
2002), pages 3–7, Kyoto.
Hjorth, B. (1970). Eeg analysis based on time domain prop-
erties. Electroencephalography and clinical neuro-
physiology, 29(3):306–310.
Khamis, H., Mohamed, A., Simpson, S., and McEwan, A.
(2012). Detection of temporal lobe seizures and iden-
tification of lateralisation from audified EEG. Clinical
Neurophysiology, 123(9):1714–20.
Kropotov, J. (2010). Quantitative EEG, event-related po-
tentials and neurotherapy. Elsevier.
Liang, S.-F., Chen, Y.-C., Wang, Y.-L., Chen, P.-T., Yang,
C.-H., and Chiueh, H. (2013). A hierarchical ap-
proach for online temporal lobe seizure detection in
long-term intracranial eeg recordings. Journal of neu-
ral engineering, 10(4):045004.
Mealla, S., V
¨
aljam
¨
ae, A., Bosi, M., and Jord
`
a, S. (2011).
Listening to your brain: Implicit interaction in collab-
orative music performances. In Proc. of NIME, pages
149–154.
Mullen, T., Luther, M., Way, K., and Jansch, A. (2011).
Minding the (Transatlantic) Gap: An Internet-Enabled
Acoustic Brain-Computer Music Interface followed
throughout the next decade by a number of artists. In
Proc. NIME’11.
Neuroelectrics (2013). Neuroelectrics enobio.
http://neuroelectrics.com/enobio.
Puckette, M. et al. (1996). Pure data: another integrated
computer music environment. Proceedings of the Sec-
ond Intercollege Computer Music Concerts, pages 37–
41.
Rodr
´
ıguez, A., Rey, B., and Alca
˜
niz, M. (2013). Validation
of a low-cost eeg device for mood induction studies.
Studies in health technology and informatics, 191:43–
47.
Shinn-Cunningham, B. G. (2008). Object-based auditory
and visual attention. Trends Cogn Sci, 12(5):182–186.
Tajadura-Jimenez, A., Valjamae, A., and Vastfjall, D.
(2008). Self-representation in mediated environments:
the experience of emotions modulated by auditory-
vibrotactile heartbeat. Cyberpsychology and Behav-
ior, 11(1):33–38.
V
¨
aljam
¨
ae, A., Mealla, S., Steffert, T., Holland, S., Mari-
mon, X., Benitez, R., and et al. (2013). A Review
Of Real-time EEG Sonification Research. In The 19th
International Conference on Auditory Display (ICAD-
2013), Lodz, Poland.
Vastfjall, D. (2003). The subjective sense of presence, emo-
tion recognition, and experienced emotions in audi-
tory virtual environments. Cyberpsycholy and Behav-
ior, 6(2):181–188.
Wright, M. (2005). Open sound control: an enabling tech-
nology for musical networking. Organised Sound,
10(03):193–200.
PhyCS2014-InternationalConferenceonPhysiologicalComputingSystems
330
