
Physiological Signal Processing for Emotional Feature Extraction
Peng Wu
1
, Dongmei Jiang
2
and Hichem Sahli
1,3
VUB-NPU Joint AVSP Research Lab
1
Department of Electronics and Informatics(ETRO), Vrije Universiteit Brussel (VUB), Pleinlaan 2, Brussels, Belgium
2
Shaanxi Provincial Key Lab on Speech and Image Information Processing,
Northwestern Polytechnical University (NPU), Xi’an, China
3
Interuniversity Microelectronics Centre (IMEC), Leuven, Belgium
Keywords:
Signal Denoising, QRS Detection, Electromyography Segmentation.
Abstract:
This paper introduces new approaches of physiological signal processing prior to feature extraction from
electrocardiogram (ECG) and electromyography (EMG). Firstly a new signal denoising approach based on
the Empirical mode decomposition (EMD) is presented. The EMD can decompose the noisy signal into
a number of Intrinsic Mode Functions (IMFs). The proposed algorithm estimates the noise level of each
IMF. Experiments show that the proposed EMD-based method provides better denoising results compared to
state-of-art. In addition, a real-time QRS detection approach is proposed to be directly applied on the noisy
ECG signals. Moreover, an adaptive thresholding approach is employed for the EMG segmentation. Both
approaches are validated using synthetic and real physiological data resulting in good performances.
1 INTRODUCTION
Affective Computing is a new area of computing
research described as ”computing which relates to,
arises from, or deliberately influences emotions” (Pi-
card, 2000). It emphasizes the importance of adding
new emotional features to the human-computer inter-
action. The use of physiological sensors as a means
of recognizing user’s affective state has a number of
advantages: (i) the size of such sensors is rapidly de-
creasing to the extent that it is nowadays incorporated
into body wireless network (Pantelopoulos and Bour-
bakis, 2008), (ii) they are less disturbing than being
”watched” by a camera as is the case with facial ex-
pression recognition, and (iii) they are less susceptible
to social masking (Kim, 2007).
However, emotional state recognition by means of
biosignals analysis is also problematic. This is due in
part to the fact that biosignals are usually corrupted by
white noise (
¨
Ust
¨
unda
˘
g et al., 2012) and other various
types of noise, such as baseline wander, muscle con-
traction and electrode motion artifacts (Andrade et al.,
2006; Blanco-Velasco et al., 2008). Furthermore, de-
spite the evidence from psychophysiology suggesting
a strong correlation between human emotional states
and physiological responses, determining an appro-
priate mapping between them requires the estimation
of reliable features.
In this paper, we propose advanced signal process-
ing for the characterization of ECG and EMG phys-
iological signals. Firstly, a new signal denoising ap-
proach is introduced. The focus is on signals with
white Gaussian noise.
Wavelet-based denoising has been the dominant
technique in the area of non-linear and non-stationary
signals (e.g. physiological signals) denoising for
many years (Donoho, 1995). The goal is to estimate
the signal from the noisy observations such that the
Mean Square Error (MSE) is minimum. To achieve
this, the observed signal is transformed into wavelet
domain, which decomposes it into many subbands.
The small coefficients in the subbands are dominated
by noise, while coefficients with large absolute value
carry more signal information than noise. Replac-
ing noisy coefficients (small coefficients below cer-
tain value) by zero and an inverse wavelet transform
may lead to reconstruction signal that has lesser noise.
Often, hard thresholding and soft thresholding tech-
niques are used for such denoising process (Donoho,
1995).
The main drawback of the wavelet approach is
that the basis functions are fixed, and do not nec-
essarily match signals with large variabilities, such
as the electromyography (EMG). Huang et al. pro-
40
Wu P., Jiang D. and Sahli H..
Physiological Signal Processing for Emotional Feature Extraction.
DOI: 10.5220/0004727500400047
In Proceedings of the International Conference on Physiological Computing Systems (PhyCS-2014), pages 40-47
ISBN: 978-989-758-006-2
Copyright
c
2014 SCITEPRESS (Science and Technology Publications, Lda.)

posed the Empirical mode composition (EMD) as a
tool to adaptively decompose a signal into a num-
ber of components, called Intrinsic Mode Functions
(IMFs) (Huang et al., 1998). In contrast to the
wavelet approach, the EMD relies on a fully data-
driven mechanism that doesn’t require any predefined
basis. A general scheme of signal denoising using
EMD is as follows: 1. Decompose the noisy signal
into a number of IMFs; 2. Estimate the noise level of
each IMF and threshold the estimated IMFs; 3. Re-
construct the denoised signal using the thresholded
IMFs.
EMD-based denoising has been applied to physio-
logical signals in many studies (Boudraa et al., 2005;
Andrade et al., 2006; Jing-tian et al., 2007; Blanco-
Velasco et al., 2008; Karagiannis and Constantinou,
2009; Agrafioti et al., 2012). However, the esti-
mation of the noise level, of each IMF, for a reli-
able threshold is still an open question. The strategy
of Donoho (Donoho and Johnstone, 1994) is widely
used (Boudraa et al., 2005; Jing-tian et al., 2007;
Karagiannis and Constantinou, 2009), nevertheless, it
is only suitable for noise dominant scales (i.e. IMFs),
thus applying this threshold to high scales causes sig-
nal distortion. This is due to the fact that each scale
of the EMD occupies lower frequencies than its pre-
ceding ones and most noise components lie in the first
several scales. The high scales are signal dominated.
Using a single threshold may give misleading results.
State-of-art approaches either reconstruct denoised
signals using all thresholded IMFs while ignoring the
signal distortion (Boudraa et al., 2005), or by thresh-
olding the first IMFs and keep the other IMFs un-
changed (Jing-tian et al., 2007; Blanco-Velasco et al.,
2008). For the latter, the number of IMFs to be thresh-
olded is decided empirically (Jing-tian et al., 2007) or
via statistical test (Blanco-Velasco et al., 2008). Alter-
natively, instead of estimating the noise level from the
whole IMF, Andrade (Andrade et al., 2006) manually
selected a window of noise from the original signal
and then the boundaries of this window were used for
the noise level estimation.
In this paper, we follow the idea of EMD-based
denoising, however different from state-of-art meth-
ods, rather than estimating the noise level of all IMFs
using Donoho’s strategy, we propose a novel ap-
proach for noise levels estimation of dominant IMFs.
In this study, we focus on the electrocardiogram
(ECG) and electromyography (EMG) signals which
have been confirmed to be useful for emotion recog-
nition (Kreibig et al., 2007). For the ECG, heart rate
(HR) and heart rate variability (HRV) are the cardio-
vascular response features most often reported as in-
dicators of emotion (Kreibig, 2010). The first step in
extracting them starts from the exact detection of R
peaks in the QRS complex (see Fig.1). Within the
last decade many approaches to R peaks detection
have been proposed (Kohler et al., 2002). However,
most of these approaches are off-line and targeting
the noiseless signal, which don’t meet the require-
ments of many real-time applications. To overcome
this problem, we make use of a Change Point Detec-
tion (CPD) algorithm proposed by Guralnik and Sri-
vastava (Guralnik and Srivastava, 1999) for event de-
tection in time series.
The EMG also plays an important role in expres-
sion recognition (Van Boxtel, 2010). A basic problem
in EMG applications is the determination of muscu-
lar active periods within a given EMG signal. Within
each muscle activity period the root mean square
(RMS) and absolute mean value (AMV), are used as
features (Farf
´
an et al., 2010). Most state-of-art ap-
proaches uses thresholding for muscle activity seg-
mentation. However, a fixed threshold value may
cause misleading results (
¨
Ozg
¨
unen et al., 2010) as
muscular movement has different intensities. In this
study, inspired by the energy-based speech voice ac-
tivity detection (Van Gerven and Xie, 1997; Ghosh
et al., 2011), we propose an algorithm for the auto-
matic segmentation of EMG signals by dynamically
calculating instantaneous values for the estimation of
the segmentation threshold based on an adaptive scal-
ing parameter.
2 EMD-BASED SIGNAL
DENOISING
Signal denoising can be described as following: given
a noisy signal x(t):
x(t) = f (t) + n(t) (1)
where f (t) and n(t) are signal and noise components,
respectively. The objective is to estimate the noise
level σ(n) and then filter out the noise. Translating
this idea to the case of EMD-based denoising, firstly
the noisy signal is decomposed via EMD into a num-
ber of Intrinsic Mode Functions, c
i
, i.e.:
x(t) =
N
∑
i=1
c
i
(t) + r
N
(t) (2)
where N is the number of IMFs and r
N
is the residual.
The noise component, n(t), of the signal x(t) is now
decomposed and dispersed among the IMFs. Thus
we have to estimate the noise level σ
i
(n), where i =
1,...,N of each IMF.
In this study, we propose an approach for estimat-
ing σ
i
(n), which avoids removing useful information
PhysiologicalSignalProcessingforEmotionalFeatureExtraction
41

from the dominant IMFs, hence causing signal distor-
tion. The idea, is that only σ
1
(n) is computed using
Donoho’s approach (Donoho and Johnstone, 1994)
since the first IMF basically consist of high frequency
noise component, i.e.:
σ
1
(n) = MAD
1
/.6745 (3)
MAD
1
= Median(| c
1
(t) − Median(c
1
) |) (4)
Then the noise level of the ith IMF σ
i
(n) is computed
as:
σ
i
(n) = δ
i
σ
1
(n) (5)
The procedure for computing δ
i
is as following: at
first the Hilbert transform (HT) is applied to each
IMF. The HT of the ith IMF c
i
(t) is defined as (Huang
et al., 1999):
H[c
i
(t)] = c
i
∗
1
πt
= y
i
(6)
or using the convolution definition,
y
i
(t) =
1
π
P
Z
∞
−∞
c
i
(γ)
t − γ
dγ (7)
Where P indicates the Cauchy principal value. From
y
i
(t) it is possible to define the analytical version of
the ith IMF:
z
i
(t) = c
i
(t) + iy(t) (8)
where i is the imaginary unit, or in polar form:
z
i
(t) = a
i
(t)e
iθ
i
(t)
(9)
in which:
a
i
(t) =
q
c
2
i
(t) + y
2
i
(t) (10)
θ
i
(t) = arctan(
y
i
(t)
c
i
(t)
) (11)
The instantaneous frequency of the ith IMF ω
i
is then
obtained using the instantaneous variation of phase
(Huang et al., 1999).
ω
i
(t) =
dθ(t)
dt
(12)
the mean period
¯
P
i
is determined using the mean value
of the instantaneous frequencies of the ith IMF:
¯
P
i
=
1
mean(ω
i
(t))
(13)
Following, the noise energy density of the ith IMF, E
i
,
is needed. Since the first IMF is always noise domi-
nated, E
1
can be easily obtained by:
E
1
=
1
N
N
∑
t=1
c
2
1
(t) (14)
The product of energy density of IMF and its corre-
sponding mean period must be a constant (Wu and
Huang, 2004), i.e.:
E
i
¯
P
i
= C (15)
Based on the mean period of the ith IMF
¯
P
i
and the
const C, the energy density of the ith IMF is obtained:
E
i
= C/
¯
P
i
(16)
and then:
δ
i
= E
i
/E
1
(17)
Having the δ
i
, the noise level of the ith IMF σ
i
(n)
can be obtained using Eq.5. The soft-thresholding ap-
proach (Donoho, 1995) is the applied to the IMFs:
c
0
i
(t) =
c
i
(t) − T
i
, i f c
i
(t) ≥ T
i
0, i f | c
i
(t) |< T
i
c
i
(t) + T
i
, i f c
i
(t) ≤ −T
i
(18)
in which c
0
i
(t) is the thresholded version of the ith
IMF, where:
T
i
= σ
i
(n)
p
2log(L) (19)
Where L is the length of the signal x(t). Finally, the
denoised signal x
0
(t) is obtained via reconstruction
using the thresholded IMFs:
x
0
(t) =
N
∑
i=1
c
0
i
(t) + r
N
(t) (20)
3 Physiological Signal Analysis
3.1 Real-time QRS detection in ECG
The QRS complex is the most important segment
in ECG signal, which reflects the electrical activity
within the heart during the ventricular contraction.
The moment of its occurrence gives us much infor-
mation related to the current emotional state (Kreibig,
2010). Thus the detection of QRS complex, in par-
ticular R peak detection is the basis for ECG-based
emotion recognition.
The real-time QRS detection approach proposed
in this paper is based on the algorithm of change
point detection of (Guralnik and Srivastava, 1999).
Change point detection approaches apply data min-
ing techniques to identify the time points at which the
changes, i.e. events, occur. In (Guralnik and Srivas-
tava, 1999) a method has been proposed for the de-
tection of the appropriate set of number of points that
minimizes the error in fitting a pre-defined function
using maximum likelihood. There is no fixed num-
ber of change-points to be detected. Moreover, no
PhyCS2014-InternationalConferenceonPhysiologicalComputingSystems
42
constraints are imposed on the class of functions that
will be fitted to the subsequences between successive
change-points.
Following the notation in (Guralnik and Srivas-
tava, 1999), let y(t), (t = 1,...,n) be the time series
to be segmented. It is assumed that the time series
can be modeled mathematically, where each model is
characterized by a set of parameters. The problem
of change-points detection, is formulated as finding a
piecewise segmented model, given by
Y = f
1
(t,v
1
) + e
1
(t),(1 < t ≤ θ
1
),
= f
2
(t,v
2
) + e
2
(t),(θ
1
< t ≤ θ
2
),
= .....................................
= f
l
(t,v
l
) + e
l
(t),(θ
l−1
< t ≤ n). (21)
Where f
i
(t,v
i
) is the function (with its vector of pa-
rameters v
i
) that is fitted to the segment i. The θ
i
’s are
the change-points between successive segments, and
e
i
(t)’s are error terms. The change-point in the first
stage is the j minimizing L (1, j) + L ( j + 1,n), say
j
∗
.
The approach of (Guralnik and Srivastava, 1999)
can be implemented in a batch or incremental. The
batch algorithm is useful only when data collection
precedes analysis. As in our case we are targeting
on-line processing, we use the incremental version
of the algorithm. The key idea is that if the next
data point collected by the sensor reflects a signifi-
cant change in phenomenon, then the likelihood of
being a change-point is going to be smaller then the
likelihood that it is not. However, if the difference in
likelihoods is small, we cannot definitively conclude
that a change did occur, since it may be the artifact of
a large amount of noise in the data. Therefore a user-
defined likelihood increase threshold is introduced.
(L
no change
− L
change
)/L
no change
> δ, (22)
where δ is a user-defined likelihood increase thresh-
old.
Suppose that the last change-point was detected at
time t
l−1
. At time t
l
the algorithm starts by collecting
enough data to fit the regression model. Suppose at
time t
j
a new data point is collected. The candidate
change-point is found by determining t
i
, with likeli-
hood criterion L
min
(l, j), such that
L
min
(l, j) = min
l<i≤ j
L (l,i) + L (i + 1, j). (23)
If this minimum is significantly smaller than
L (l, j), i.e. the likelihood criteria of no change-points
from t
l
to t
j
, then t
i
is a change-point. Otherwise, the
process should continue with the next point, i.e. t
j+1
.
In the incremental algorithm, execution time is a
significant factor. If enough information is stored,
some of the calculations can be avoided. Thus, at time
t
j+1
to find likelihood criteria
L
min
(l, j + 1) = min
l<i≤ j
L (l,i) + L (i + 1, j +1) (24)
it is only necessary to calculate L (i + 1, j + 1), since
(l,i) was calculated in the previous iteration.
Several types of basis functions, f
i
(t,v
i
), can
be considered, e.g. algebraic polynomials, wavelet,
Fourier, etc.. In our current implementation polyno-
mial fitting functions of degree 1 have been selected
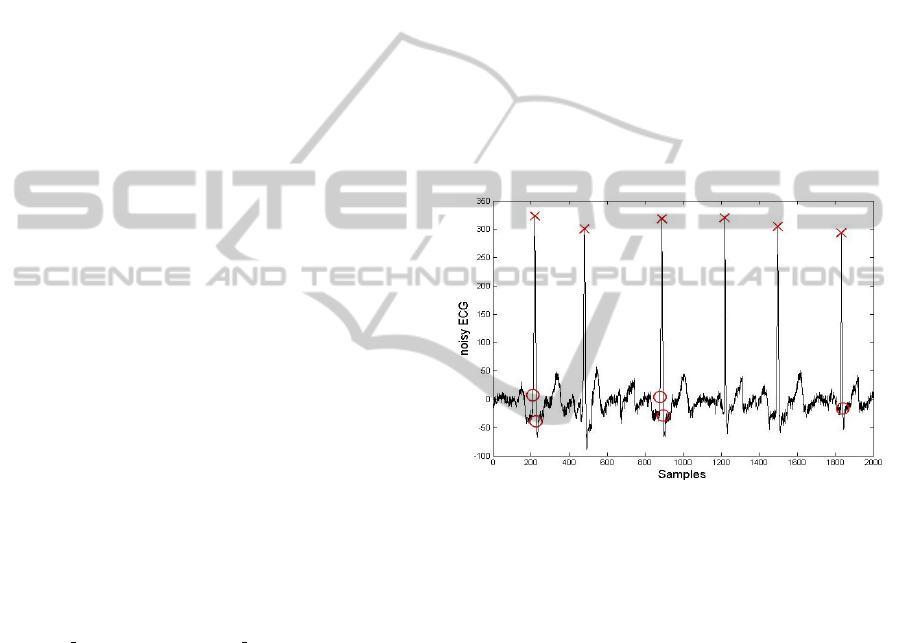
empirically. The user-defined likelihood threshold δ,
has been set 0.97 in this study to avoid finding a lot
of irrelevant change points. The remaining irrelevant
change points (see Fig.1) can be filtered out by a pre-
determined threshold. The threshold is selected as
15% of the maximum value of the detected change
points (Behbahani and Dabanloo, 2011).
Figure 1: Detected change points including R peaks (cross)
and irrelevant ones (circle)
3.2 EMG Segmentation
EMG signals are characterized by a discontinuous
signal since information is carried only when mus-
cles are active, such segments are the regions where
activity information exists and are referred to as ’ac-
tive segments’. The pauses between them are called
’inactive segments’. The features extracted from ac-
tive segments are considered more suitable for ex-
pression recognition (Hamedi et al., 2011). For ex-
ample, the active features of facial EMG is helpful
for not only recognizing facial expressions, but also
learning the actual mechanism of how facial expres-
sions are formed (Aoi et al., 2011), which is less
susceptible to social masking and may better reveal
the emotional state behind the facial expression. The
decision of determining to what class an EMG seg-
ment belongs reassembles the voice activity detec-
tion (VAD) in speech. Inspired by the energy-based
speech VAD (Van Gerven and Xie, 1997; Ghosh et al.,
PhysiologicalSignalProcessingforEmotionalFeatureExtraction
43
2011) approaches, in this paper we propose an RMS-
based EMG segmentation. RMSs are extracted from
each L = 100 ms of the EMG signal as an indicator of
the muscle activation:
RMS(i) =
s
1
N
N
∑
t=1
x(t)
2
(25)
where i is the index of the windows within EMG sig-
nal x(t). The duration of the optimal analysis window
depends on the purpose of the study. The window
size of 100 ms is decided in this study to track the
fast dynamic changes in facial expression (Van Box-
tel, 2010).
The adaptive thresholding method for EMG seg-
mentation is based on RMS levels, i.e., RMS
min
and
RMS
max
, representing the minimum and maximum
RMS value of the incoming windows respectively.
The threshold T is calculated as (Ghosh et al., 2011):
T = αRMS
min
+ (1 − α)RMS
max
(26)
where α is an adaptive factor and computed
as (Sakhnov et al., 2009):
α =
RMS
max
− RMS
min
RMS
max
(27)
RMS
min
and RMS
max
are initialized by the first second
of the EMG signal, i.e., the first 10 windows. The
RMS
min
, RMS
max
and corresponding T are then up-
dated for every incoming window before threshold-
ing. A control factor, called inactive counter (IC), is
defined as the number of consecutive windows with
RMS value which is smaller than T . If the RMS value
of the incoming window i, i.e. RMS(i) is larger than
T , it is classified as active; If RMS(i) is smaller than
T , and IC > 3, the window i is classified as inactive,
otherwise it’s still labeled as active.
4 RESULTS AND DISCUSSION
4.1 Signal Denoising
In order to test the validity of the proposed denoising
approach, three ECG (101, 103, 118) and two EMG
(brux1, brux2) noiseless signals are chosen arbitrarily
from the MIT-BIH arrhythmia database (Moody and
Mark, 2001) and the CAP sleep database (Terzano
et al., 2001) respectively through PhysioNet (Gold-
berger et al., 2000). Then simulations for several dif-
ferent cases are carried out. A white Gaussian noise
n(t) is added to the noiseless signal f (t), obtaining
the synthetic noisy signal x
∗
(t) (such as 101
∗
, 103
∗
,
118
∗
, brux1
∗
, brux2
∗
). The quantitative evaluation is
assessed by the signal-to-error ratio (SER) (Blanco-
Velasco et al., 2008)
SER =
∑
L−1
t=0
f
2
(t)
∑
L−1
t=0
[ f (t) − x
0
(t)]
2
(28)
where x
0
(t) is the denoised version of x
∗
(t). The
signal-to-noise ratio (SNR) is given by:
SNR =
∑
L−1
t=0
f
2
(t)
∑
L−1
t=0
n
2
(t)
(29)
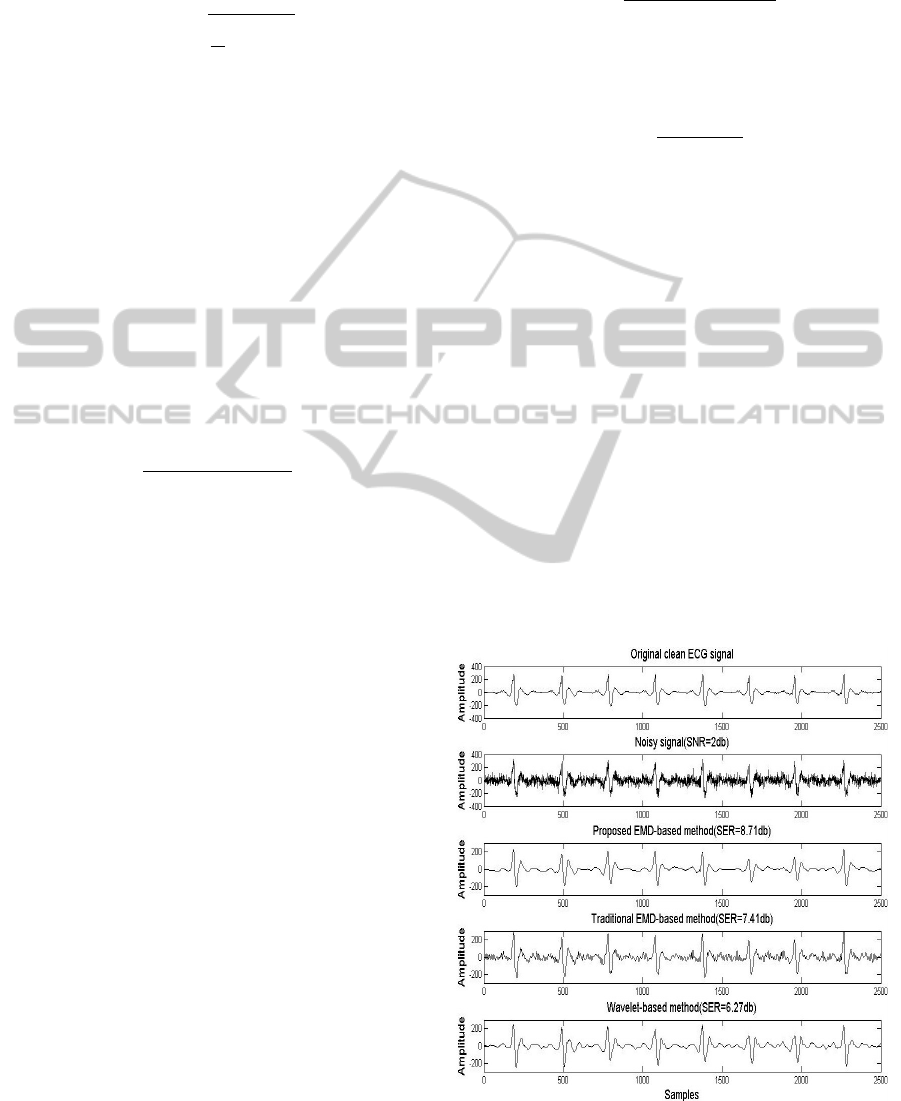
Fig.2 and Fig.3 illustrate the waveforms of the
original (clean) signal, noisy signal, and denoised sig-
nal using the proposed EMD-based approach, the tra-
ditional EMD-based approach and the wavelet-based
approach, for the ECG and the EMG respectively.
Here, the traditional EMD-based approach (Jing-tian
et al., 2007) and the wavelet-based approach (Tikka-
nen, 1999) are implemented for comparison. With
respect to the latter, the 4-level discrete wavelet
transform with the Daubechies (db4) and Symlets
(sym2) basis are used for the ECG and the EMG sig-
nals respectively. The soft-thresholding proposed by
Donoho (Donoho, 1995) is then applied to the dis-
crete wavelet transform coefficients with fixed thresh-
olds for each level. As can be seen from Fig.2 and
Fig.3, the proposed EMD-based approach yields good
results in terms of visual quality and outperforms
the traditional EMD-based approach and the wavelet-
based approach for both the ECG and the EMG cases.
Figure 2: Example of ECG denoising for white Gaussian
noise
PhyCS2014-InternationalConferenceonPhysiologicalComputingSystems
44
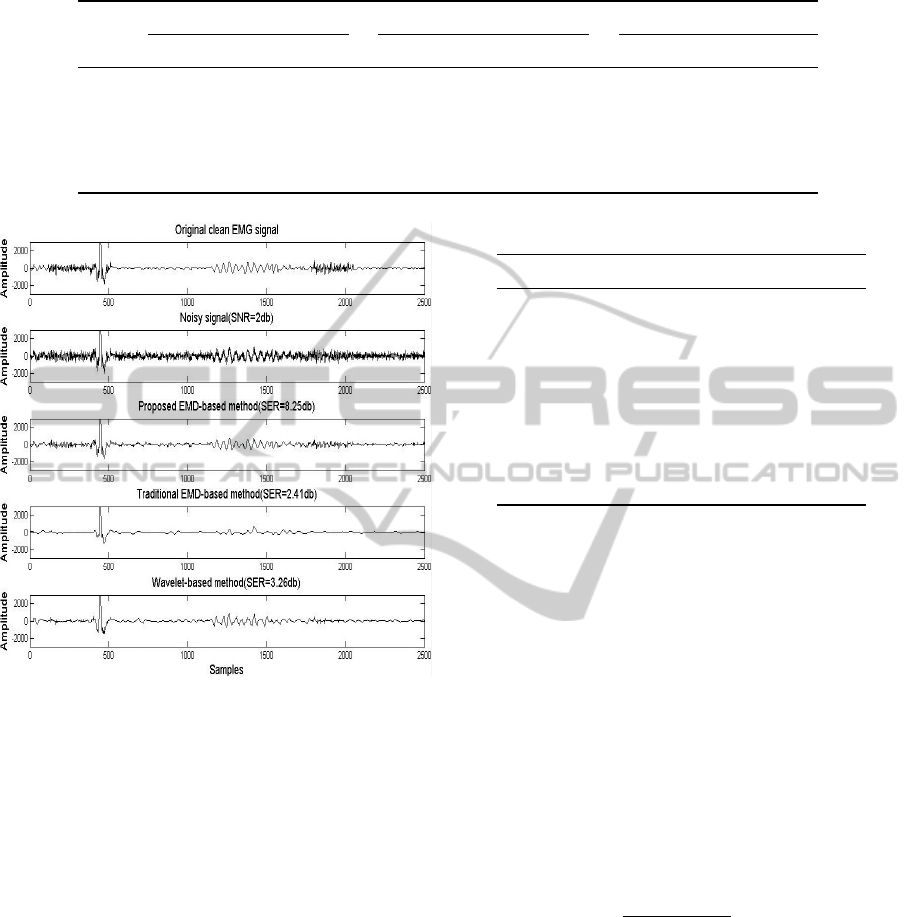
Table 1: Signal denoising experiments carried out over several records.
SNR = 2 db SNR = 6 db SNR = 10 db
Record EMD tEMD WT EMD tEMD WT EMD tEMD WT
101
∗
7.25 5.48 5.94 16.01 10.84 10.42 21.73 15.59 13.34
103
∗
6.80 4.68 5.83 15.92 10.86 11.30 19.80 18.05 15.40
118
∗
8.71 7.41 6.27 13.6 11.32 12.25 23.05 16.30 14.09
brux1
∗
8.25 2.41 3.26 18.58 2.65 4.08 28.38 3.19 4.25
brux2
∗
6.05 2.05 1.53 11.00 2.95 1.72 15.75 3.83 1.80
Figure 3: Example of EMG (the submentalis muscle) de-
noising for white Gaussian noise
Moreover, we study the behavior of the proposed
method quantitatively, using multiple realizations of
white Gaussian noise at different SNRs (2 db, 6 db
and 10 db). The results are presented in Table.1 in
terms of SER for the corresponding methods (EMD:
proposed EMD-based, tEMD: traditional EMD-based
and WT: wavelet-based). Again, as can be seen from
Table.1, the proposed EMD-based method shows bet-
ter ability to deal with the white Gaussian noise than
the other two methods.
4.2 Real-time QRS Detection
We use both the synthetic and real ECG data to test
the validity of proposed real-time QRS detection ap-
proach. The real ECG data were acquired for the
analysis of emotional facial expressivity of Parkin-
son patients (Verbraeck, 2012). In the experiments
for data acquisition, six emotions (happiness, sadness,
anger, disgust, surprise, and fear) and a neutral state
Table 2: The results of the QRS detection.
Record No. of Beats FP FN Err(%)
101
∗
1865 1 13 0.75
103
∗
2084 1 15 0.77
118
∗
2278 6 14 0.88
N
1
4431 5 39 0.99
N
2
4781 3 20 0.48
N
3
5288 2 9 0.21
N
4
5169 6 21 0.52
A
1
3924 12 93 2.68
A
2
4220 10 79 2.11
were induced via watching movies clips in a group
of eight healthy subjects and seven persons suffering
from Parkinson’s disease. The EMG from two facial
muscles (the levator labii superioris, and the orbicu-
laris oculi), the ECG, as well as the face of each sub-
ject were recorded (Verbraeck, 2012). In total, the
data used for validation in this study include 3 syn-
thetic signals (101
∗
, 103
∗
, 118
∗
), 4 real signals from
subjects with normal heartbeats (N1, N2, N3, N4) and
2 real signals from subjects with arrhythmia (A
1
, A
2
).
All the data are noisy signals.
In Table.2, false positive (FP), indicates the
method detects a beat when no beat is present; while
FN, false negative, indicates that the method failed to
detect a beat. The Err is the total detection failure
rate, defined as:
Err =
∑
FP +
∑
FN
∑
S
× 100% (30)
where S is the total number of beats. Consequently,
based on the obtained results, the proposed QRS de-
tection approach is effective on noisy ECG signals.
4.3 EMG Segmentation
The proposed EMG segmentation approach is ap-
plied to both the synthetic data (brux1
∗
, brux2
∗
) and
the real EMG signals acquired in (Verbraeck, 2012).
Fig.4 shows the example of segmentation for an EMG
signal from the levator labii superioris using the pro-
posed approach. As can be seen, the validity of the
PhysiologicalSignalProcessingforEmotionalFeatureExtraction
45
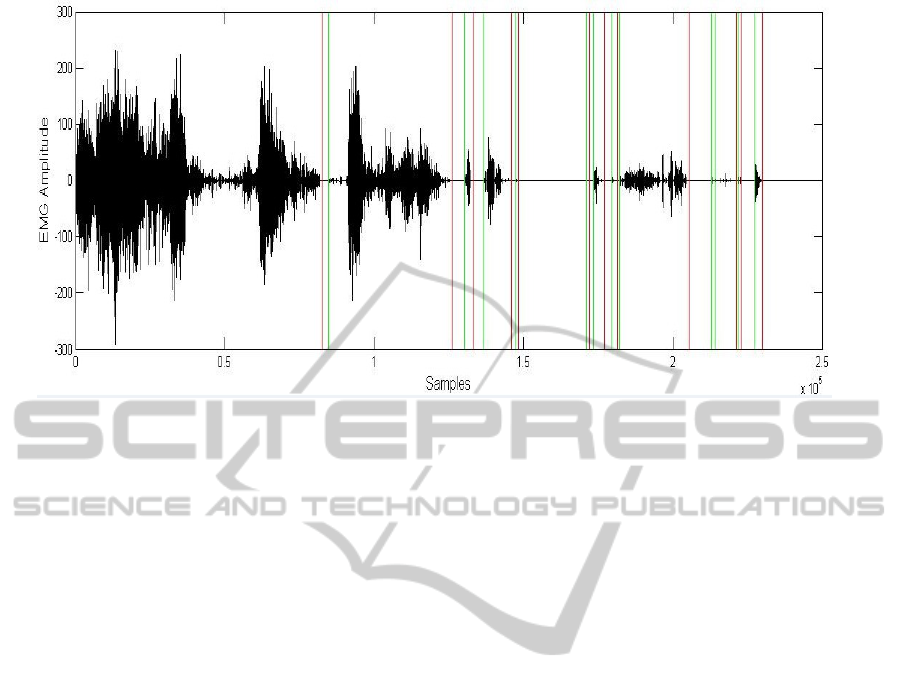
Figure 4: Example of EMG (the levator labii superioris muscle) segmentation on real data.
proposed approach has been confirmed: the EMG sig-
nals are segmented into several active segments be-
tween the green and the following red lines. Even
short and weak active segments have been detected.
5 CONCLUSIONS
This paper introduces novel approaches of physiolog-
ical signal processing for emotional feature extrac-
tion. Both the ECG and the EMG signals are ad-
dressed. Firstly an EMD-based denoising approach is
proposed where the noise levels of all IMFs are effec-
tively estimated and processed to successfully achieve
the denoising. The validity of the proposed method is
confirmed through several experiments. Results indi-
cate that it is an effective tool for physiological sig-
nals denoising, especially for the case of white Gaus-
sian noise. In addition, a real-time QRS detection ap-
proach is proposed which can be applied directly on
the noisy ECG signals. Finally, an adaptive thresh-
olding approach is employed for EMG segmentation.
Both approaches for QRS detection and EMG seg-
mentation are validated using synthetic and real phys-
iological data resulting in good performances.
ACKNOWLEDGEMENTS
The research work reported in this paper is supported
by a CSC-VUB scholarship grant, and the VUB-
interdisiplinary research project ”Objectifying assess-
ment of human emotional processing and expression
for clinical and psychotherapy applications (EMO-
App)”.
REFERENCES
Agrafioti, F., Hatzinakos, D., and Anderson, A. K. (2012).
Ecg pattern analysis for emotion detection. IEEE
Transactions on Affective Computing, 3:102–115.
Andrade, A. O., Nasuto, S., Kyberd, P., Sweeney-Reed,
C. M., and Kanijn, F. R. V. (2006). Emg signal filter-
ing based on empirical mode decomposition. Biomed-
ical Signal Processing and Control, 1:44–55.
Aoi, M., Kamijo, M., and Yoshida, H. (2011). Relationship
between Facial Expression and Facial Electromyo-
gram (f-EMG) Analysis in the Expression of Drowsi-
ness. In International Conference on Biometrics and
Kansei Engineering, pages 65–70.
Behbahani, S. and Dabanloo, N. (2011). Detection of
qrs complexes in the ecg signal using multiresolution
wavelet and thresholding method. In Computing in
Cardiology, 2011, pages 805–808.
Blanco-Velasco, M., Weng, B., and Barner, K. E. (2008).
Ecg signal denoising and baseline wander correction
based on the empirical mode decomposition. Comput-
ers in Biology and Medicine, 38:1–13.
Boudraa, A. O., Cexus, J. C., and Saidi, Z. (2005). Emd-
based signal noise reduction. Signal Processing, 1:33–
37.
Donoho, D. L. (1995). Denoising by soft-thresholding.
IEEE Transactions on Information Theory, 41:613–
627.
Donoho, D. L. and Johnstone, I. M. (1994). Ideal spatial
adaption via wavelet shrinkage. Biometrika, 81:425–
455.
Farf
´
an, F., Politti, J., and Felice, C. (2010). Evaluation of
PhyCS2014-InternationalConferenceonPhysiologicalComputingSystems
46

emg processing techniques using information theory.
Biomedical engineering online, 9(1):72.
Ghosh, P. K., Tsiartas, A., and Narayanan, S. (2011). Ro-
bust voice activity detection using long-term signal
variability. Audio, Speech, and Language Processing,
IEEE Transactions on.
Goldberger, A. L., Amaral, L. A., Glass, L., Hausdorff,
J. M., Ivanov, P. C., Mark, R. G., Mietus, J. E., Moody,
G. B., Peng, C.-K., and Stanley, H. E. (2000). Phys-
iobank, physiotoolkit, and physionet components of
a new research resource for complex physiologic sig-
nals. Circulation, 101(23):e215–e220.
Guralnik, V. and Srivastava, J. (1999). Event detection from
time series data. In Knowledge Discovery and Data
Mining, pages 33–42.
Hamedi, M., Salleh, S.-H., and Swee, T. T. (2011). Sur-
face electromyography-based facial expression recog-
nition in bi-polar configuration. Journal of Computer
Science, 7(9):1407–1415.
Huang, N. E., Shen, Z., and Long, S. R. (1999). A new
view of nonlinear water waves: The hilbert spectrum
1. Annual review of fluid mechanics, 31(1):417–457.
Huang, N. E., Shen, Z., Long, S. R., Wu, M. C., Shih,
H. H., Zheng, Q., Yen, N.-C., Tung, C. C., and Liu,
H. H. (1998). The empirical mode decomposition and
the hilbert spectrum for nonlinear and non-stationary
time series analysis. Proceedings of The Royal Society
A: Mathematical, Physical and Engineering Sciences,
454:903–995.
Jing-tian, T., Qing, Z., Yan, T., Bin, L., and Xiao-kai, Z.
(2007). Hilbert-huang transform for ecg de-noising.
In Bioinformatics and Biomedical Engineering, 2007.
ICBBE 2007. The 1st International Conference on,
pages 664–667.
Karagiannis, A. and Constantinou, P. (2009). Noise com-
ponents identification in biomedical signals based on
empirical mode decomposition. In IEEE EMBS Inter-
national Conference on Information Technology Ap-
plications in Biomedicine, pages 1–4.
Kim, J. (2007). Bimodal emotion recognition using speech
and physiological changes. Robust speech recognition
and understanding, pages 265–280.
Kohler, B.-U., Hennig, C., and Orglmeister, R. (2002). The
principles of software qrs detection. IEEE Engineer-
ing in Medicine and Biology Magazine, 21:42–57.
Kreibig, S. D. (2010). Autonomic nervous system activ-
ity in emotion: A review. Biological psychology,
84(3):394–421.
Kreibig, S. D., Wilhelm, F. H., Roth, W. T., and Gross, J. J.
(2007). Cardiovascular, electrodermal, and respiratory
response patterns to fear-and sadness-inducing films.
Psychophysiology, 44(5):787–806.
Moody, G. B. and Mark, R. G. (2001). The impact of the
mit-bih arrhythmia database. Engineering in Medicine
and Biology Magazine, IEEE, 20(3):45–50.
¨
Ozg
¨
unen, K. T., C¸ elik, U., and Kurdak, S. S. (2010). De-
termination of an optimal threshold value for muscle
activity detection in emg analysis. Journal of Sports
Science and Medicine, 9:620–628.
Pantelopoulos, A. and Bourbakis, N. (2008). A survey on
wearable biosensor systems for health monitoring. In
Engineering in Medicine and Biology Society, 2008.
EMBS 2008. 30th Annual International Conference of
the IEEE, pages 4887–4890.
Picard, R. W. (2000). Affective computing. MIT press.
Sakhnov, K., Verteletskaya, E., and Simak, B. (2009). Ap-
proach for energy-based voice detector with adaptive
scaling factor. IAENG Internat. J. Comput. Sci, 36(4).
Terzano, M. G., Parrino, L., Sherieri, A., Chervin, R.,
Chokroverty, S., Guilleminault, C., Hirshkowitz, M.,
Mahowald, M., Moldofsky, H., Rosa, A., et al. (2001).
Atlas, rules, and recording techniques for the scor-
ing of cyclic alternating pattern (cap) in human sleep.
Sleep medicine, 2(6):537–553.
Tikkanen, P. E. (1999). Nonlinear wavelet and wavelet
packet denoising of electrocardiogram signal. Biolog-
ical Cybernetics, 80(4):259–267.
¨
Ust
¨
unda
˘
g, M., G
¨
okbulut, M., S¸eng
¨
ur, A., and Ata, F.
(2012). Denoising of weak ecg signals by using
wavelet analysis and fuzzy thresholding. Network
Modeling Analysis in Health Informatics and Bioin-
formatics, 1(4):135–140.
Van Boxtel, A. (2010). Facial emg as a tool for inferring af-
fective states. In Proceedings of Measuring Behavior
2010, pages 104–108.
Van Gerven, S. and Xie, F. (1997). A comparative study of
speech detection methods. In Eurospeech, volume 97.
Verbraeck, F. (2012). Objectifying human facial expres-
sions for clinical applications. Master’s thesis, Vrije
Universiteit Brussel, Belgium.
Wu, Z. and Huang, N. E. (2004). A study of the character-
istics of white noise using the empirical mode decom-
position method. Proceedings of The Royal Society
A: Mathematical, Physical and Engineering Sciences,
460:1597–1611.
PhysiologicalSignalProcessingforEmotionalFeatureExtraction
47
