
Precise 3D Deep Brain Stimulation Electrode Location based on
Multimodal Neuroimage Fusion
Nádia Moreira da Silva
1
, Verena E. Rozanski
2
, Sérgio Neves Tafula
1
and João Paulo Silva Cunha
1,3
1
INESC TEC (Instituto de Engengaria de Sistemas e Computadores do Porto), University of Porto,
Rua Roberto Frias 4200-465, Porto, Portugal
2
Department of Neurology, University of Munich at Marchioninistrasse 15, 81377 Munich, Germany
3
Faculty of Engineeiring, University of Porto, Rua Roberto Frias 4200-465, Porto, Portugal
Keywords: DBS, Parkinson, Dystonia, Co-registration, Electrodes Segmentation.
Abstract: The success of neurosurgery strongly depends on the pre-neurosurgical evaluation phase, in which the
delineation of the areas to be removed or to be stimulated must be very accurate. For patients undergoing
Deep Brain Stimulation (DBS) it is vital the delineation of the target area prior to surgery, and after the
implantation of the DBS lead to confirm the electrodes positioning. In this paper we present a system to
accurately determine the 3D position of DBS electrodes implanted within the brain of Parkinson and
Dystonia patients. The system was tested using a multimodal dataset from 16 patients (8 with Parkinson`s
disease and 8 with dystonia) and, on average, the differences between the detected electrodes positions and
the ones estimated manually by an experienced physician were less than a voxel in all cases.
1 INTRODUCTION
Movement disorders usually lead to a loss of
independence for the patients and high costs for the
health system (Stolze et al., 2005). Parkinson’s
disease is the most common movement disorder, a
hypokinetic syndrome due to neurodegeneration of
the substantia nigra. Dystonia, on the other hand, is a
hyperkinetic disorder characterised by tonic and
phasic involuntary muscle contractions. (Haegelen et
al., 2013); (Kupsch et al., 2003) The symptoms
associated to both diseases can be relieved or
suppressed by a continuous pharmaceutical
treatment. However, with long-term treatment some
patients develop resistance to drugs and a surgical
procedure may be required. In such cases, deep brain
stimulation (DBS) is the common clinical procedure,
promoting stimulation in target areas such as the
subthalamic nucleus (STN) or the globus pallidus
internus (GPi) (Haegelen et al., 2013). For the
stereotactic implantation, optimal target site is
chosen in relation to the midcommissural point, as
described by Guridi et al., (2000). The motor and
neuropsychological outcomes depend highly on the
precise location and trajectory of the electrodes,
which when stimulated will inhibit the activity in the
target structures for each disease (Haegelen et al.,
2013); (Lozano et al., 2004).
However, due to possible shifts of DBS leads
during surgical procedure, the final electrodes
locations can be misaligned from the planned
optimal target sites (Lalys et al., 2013); Videen T.O.
et al., 2008). Therefore, it is vital to accurately locate
the position of electrodes after DBS implantation, in
order to avoid an undesirable stimulation of non-
target areas.
In order to perform a detailed analysis of the
final anatomical position of each electrode, several
approaches were developed using multimodal
techniques, combining anatomical and functional
information (Hemm et al., 2009); (Lalys et al.,
2010); (Bardinet et al., 2009). Such methods are
indicated to confirm the implanted electrodes near
the target basal ganglia structures and avoid the
activation of the ones near others structures, which
are known to promote acute side effects (Lozano et
al., 2004). In addition, as described by Thani et al.,
(2011), an accurate anatomical location of each
electrode is fundamental in quality control and to
perform a more careful selection of the best
stimulation parameters for DBS.
Nevertheless, the localisation of each DBS
electrodes is still a challenging procedure. The
presence of metal implants in MRI or CT scans,
48
Moreira da Silva N., E. Rozanski V., Neves Tafula S. and Silva Cunha J..
Precise 3D Deep Brain Stimulation Electrode Location based on Multimodal Neuroimage Fusion.
DOI: 10.5220/0004727700480054
In Proceedings of the International Conference on Physiological Computing Systems (PhyCS-2014), pages 48-54
ISBN: 978-989-758-006-2
Copyright
c
2014 SCITEPRESS (Science and Technology Publications, Lda.)

such as the electrodes and wires of the DBS lead,
can induce considerable image artefacts (Hebb et al.,
2010). These image distortions limit the capacity to
differentiate the electrodes from the DBS lead and
therefore obtain their precise location.
In the literature, several techniques are referred
to estimate the precise location of DBS electrodes.
Hebb et al., (2010) described an improvement in
the visualization of DBS’s electrodes by using a CT
imaging with an extended Hounsfield unit (EHU)
scale. Using EHU-CT each electrode can be clearly
visualized without any special image processing
techniques.
Since electrodes are indistinguishable from the
DBS lead in the standard CT or MRI scans, some
authors perform an electrodes artefact analysis,
based on semiautomatic algorithms, to gathered
information of the white and black artefacts
dimensions, and correlated it with the exact location
of the DBS electrodes. (Hemm et al., 2009); (Pollo
et al., 2004). Lalys et al., (2013) described an
automatic approach by focusing the electrode
artefact analysis within a specific region, restricted
by a brain mask. However, the accuracy of these
methods are highly dependent on the area of signal
artefact induced by the DBS lead (Thani et al.,
2011).
On the other hand, the exact coordinates of each
electrode can be estimated based on the detection of
the lowest tip of the DBS lead and its trajectory
(Rozanski et al., 2013); (Videen et al., 2008). These
estimations are manually performed in a
neuroimaging software by an experienced physician.
As result, commissure ROIs are manually drawn in
the coordinates previously estimated. However, this
process is very time consuming, complex and
requires an expert, with prior knowledge in
neuroimaging software tools.
In this study, we propose a user-friendly system
to automated segmentation and estimate the 3D
position of each electrode from the DBS lead,
implanted within the brain. Furthermore, a
multimodal pipeline is presented to provide
anatomical visualization of DBS electrodes, and
therefore assist the neurologists in the confirmation
of the implanted electrodes near the target areas.
2 MATERIALS
For this study 16 patients (eight with advanced
Parkinson disease and eight with focal Dystonia)
undergoing DBS were selected. All patients were
informed and gave their consent. Stereotactic
electrode insertion was carried out as previously
described by Singh et al., (2011). Parkinson patients
were operated in local anaesthesia to enable clinical
outcome; dystonia patients were operated in general
anaesthesia to avoid hyperkinetic movements during
operation.
All the patients had electrodes implanted
bilaterally. The DBS lead position was confirmed by
post-operative CT or T2 scans. A pre-operative T1
with 0.98 x 0.98 x 1mm voxel size was acquired to
guide the surgery and to visualize the target
structure. The T1-MRI images were gathered by a
3T-MRI unit (Sigma Exite MD GE). CT scans were
acquired by GE scanner, Brighspeed16 unit. For the
implantation a quadripolar electrode array was used
(model 3389, Medtronic Neurological Division,
Minnesota, USA) with 4 electrodes at the tip, spaced
0.5mm apart delivering stimulation individually or
in combination.
In Parkinson patients, DBS electrodes for
continuous activation were chosen after intense
testing for best clinical outcome according to
UPDRS scale. In dystonia patients, lowest DBS
electrodes were activated unless adverse effects
occurred.
3 METHODS
In this section, we describe the multimodal pipeline
for co-registration and the electrodes segmentation
algorithm. Furthermore, the functionalities of the
system are presented.
3.1 Multimodal Neuroimage Fusion
The skull-stripping tool BET (Brain extraction tool),
available in FSL, was used in all dataset to remove
the skull from the T1-MRI images.
Both CT and T2 images were co-registered using
a linear affine transformation with 6 degrees of
freedom. The geometric transformation was applied
using FLIRT (FMRIB’s linear image registration
tool), accessible in FSL 5.0, with T1-MRI as
reference image. Since the motion between images
was not significant, the angular range over which the
initial optimization search stage is performed was set
between -30 to 30 for all the axes. The cost function
chosen was the normalized mutual information, an
entropy-based cost function widely used for inter-
modal alignments, and described as the one with
more accurate results for this type of images (Cahill,
2010).
Precise3DDeepBrainStimulationElectrodeLocationbasedonMultimodalNeuroimageFusion
49

3.2 DBS Electrodes Segmentation
For the segmentation of each DBS electrode, an
algorithm was developed in MATLAB using the CT
and T2 data co-registered with T1-MRI.
The algorithm automatically determines the
bottom and upper tip of the DBS lead to deduce its
trajectory. The coordinates of each electrode are
estimated based on the DBS lead trajectory and the
standard distances of each electrode to the bottom
tip, provided in the datasheet of DBS lead.
In order to support the neurologists’ task in the
segmentation of the electrodes, a user interface was
built to implement this algorithm, making this
process more user-friendly.
The algorithm developed for the automatic
segmentation of DBS electrodes is described below
in more detail.
3.2.1 DBS Lead Segmentation
Initially, to determine the trajectory of the lead it is
necessary to extract it from the data and identify its
bottom and upper tips.
Since intensity-based segmentation approaches
were incapable to eliminate completely the skull in
the CT and T2 data, due to intensity similarities
between the DBS lead and the skull, a 3D labelling
connected components algorithm was designed. The
algorithm principle is based on the evidence that the
position of the lead varies slightly from slice to slice.
Thus, the algorithm estimates the centroid of
each label of each binary image, which is obtained
by a thresholding operation. The closest centroids in
successive slices are connected and a Euclidean
distance threshold is applied to eliminate the 3D
centroids combinations which are far apart and
therefore cannot represent the DBS lead. A
connectivity recursive function was designed to set
up 3D connect components, each one with a
different label assigned, based on the information of
the centroids connection between slices. Since each
centroid was constrained to be connected to only one
centroid in the following slice, no centroids were
repeated in different 3D connected components. The
recursive function ends the set-up of each connected
component when a centroid has no connection with
any centroids on the following slice. When all the
centroids have a 3D label assigned, the recursive
function cease.
The 3D labels of DBS leads are automatically
selected since they are the ones localized along a
trajectory from surface to deep brain. The bottom tip
is defined in the deepest slice in which the DBS
label is visible, and the upper tip in the last slice.
3.2.2 Electrodes Position Estimation
In order to determine each position of the electrode,
the x, y and z voxel coordinates of the bottom and
upper tips of the DBS lead were transformed to mm
space by equation 1, 2 and 3. For the transformation
between coordinate spaces, it was used a 4x4 affine
transformation matrix, M, saved in the header of the
NIfTI file.
,
,
(1)
,
,
(2)
,
,
(3)
,
,
(4)
,
,
(5)
,
,
(6)
Using the mm coordinates of DBS’s tips, it was
performed the following trigonometric equations, as
illustrated in Figure 1 (A).
tan
δx
(7)
cos
(8)
tan
(9)
cos
(10)
cos
(11)
Knowing the values of these variables and the
distance of each electrode to the bottom tip, it was
possible to calculate the mm coordinates of the
centre of each electrode, δx1, δy1, h1, by
trigonometric relations as illustrated in Figure 1 (B).
The obtained positions were transformed to the
voxel space by equation 4, 5 and 6, to set up the 3D
electrodes mask.
Figure 1: (A) 3D representation of the relationship
between the lengths and angles for the different sides of
the DBS lead, where H represents its trajectory. (B) 3D
representation of the distances of a figurative electrode in
relation to the bottom tip.
PhyCS2014-InternationalConferenceonPhysiologicalComputingSystems
50

3.3 User-friendly Interface
The workflows of the algorithms described above
were implemented in an interface, developed in
MATLAB, which automatically estimates the
bottom and upper tips of the DBS lead and
calculates, using the trigonometric relations, each
position of the electrodes.
With the help of this system, the user can
automatically export a 3D mask with only electrodes
information, i.e., without brain, beam hardening and
skull information. Furthermore, the user can obtain
3D masks of the DBS leads as well as specify which
electrodes will be in the mask to be exported.
Since the CT or T2 datasets were aligned with
T1-MRI, before the segmentation, the interface
allows the overlapping of the T1-MRI with the
electrodes or DBS masks. This functionality is
useful to support the interpretation of data by the
neurologists.
Figure 2: Workflow Interface window for semiautomatic
segmentation, in which the user presses in the lateral
buttons to select the DBS’s tips, using the cursor.
An options panel was added to change default
parameters and therefore optimize the DBS
segmentation process or even change the
specifications of the DBS lead, such as the distances
of each electrode in relation to the bottom tip. This
latter feature is essential in case other DBS model,
different from the default, is used.
In case the user does not agree with the
suggestions given by the automatic approach, there
is the possibility of manual change (in the options
panel) of some segmentation parameters or even the
opportunity to perform a semiautomatic
segmentation, as depicted in Figure 2. This latter
only performs the pipeline using the trigonometric
relations, where the bottom and upper tips are
manually selected by the user.
In addition, the dataset can be analysed by
passing the slices, which can be helpful when the
automatic approach is selected to confirm the slices
where the DBS tips appear.
4 RESULTS AND DISCUSSION
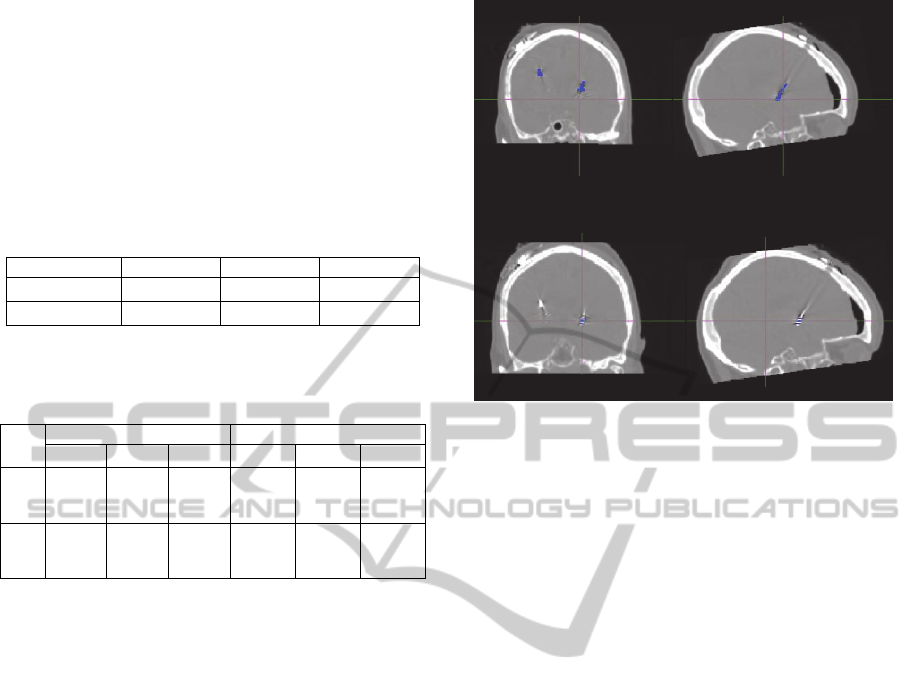
4.1 Multimodal Neuroimage Fusion
Figure 3 revealed a fine alignment between T1 and
T2 or CT images. Therefore, the parameters chosen
for the co-registration are recommended for inter-
modal alignments, linear affine transformations and
datasets in which the motion is not significant.
According to Jenkinson et al., (2001), the use of
FLIRT in the presence of large ventricles, may result
in misalignments for others structures. In these
cases, higher order transformations or non-linear
warpings may be used to achieve fine alignments.
Figure 3: Co-registration of (A) CT with T1 datasets and
(B) T2 with T1 datasets. (Left) Original CT and T2
images; (Center) CT and T2 images aligned with T1 using
FLIRT; (Right) Fusion of CT or T2 images with T1,
which is displayed in blue.
Although the patients of this study were elderly
and therefore more susceptible to present large
ventricles, no failures were seen in FLIRT
performance, using the multimodal pipeline
described in this study.
4.2 DBS Electrodes Segmentation
As depicted in figure 4 (A), 3D labeling connected
components algorithm was very efficient to produce
a mask with only DBS lead data, for the CT datasets.
Nevertheless, the algorithm does appear to fail on
automatic mode for T2 datasets. Therefore to
generate the electrodes masks with T2 data, it is
recommended to use the semiautomatic
segmentation approach.
Precise3DDeepBrainStimulationElectrodeLocationbasedonMultimodalNeuroimageFusion
51
The electrodes position estimated by MATLAB
and the ones deduced manually by a physician were
compared in order to validate the MATLAB
interface and algorithm. The manually localization
of electrodes position was performed as described by
Rozanski et al., (2013).
Table 1: The mean (̅) and standard deviation (σ) of the
absolute differences, in mm, estimated from all datasets,
regardless of the segmentation method used for the
electrodes mask establishment.
mm x y z
̅
0,507 0,592 0,444
σ
0,337 0,426 0,366
Table 2: The mean (̅) and standard deviation (σ) of the
absolute differences, in mm, estimated with the automatic
and semiautomatic method.
Semiautomatic Automatic
mm
x y z x y z
̅
0,581 0,557 0,359 0,385 0,678 0,587
σ 0,362 0,358 0,316 0,258 0,530 0,413
Table 1 shows the average of the differences in
mm between the coordinates of each electrode
obtained by the interface and the ones manually
deduced, for the three axis. These differences are
very small, as suggested by Table 1.
Through the analysis of Table 2, it is concluded
that semiautomatic segmentation was less precise in
x direction compared with the automatic method,
probably due to random errors introduced by the
user in the selection of the tips and systematic errors
due to the voxel resolution, restricting the selection
of the center of the tips by the cursor. On the other
hand, automatic segmentation was less precise in y
and z directions, probably due to the presence of
some beam hardening in the upper slices that may
have affected the calculation of the centroid of the
upper tip and therefore the estimation of DBS’s
trajectory.
However, the trajectory imprecisions are not
significant, since either using the semiautomatic or
the automatic approach (Table 2), the differences
found were less than a voxel size.
Regarding computational time, the creation of
the electrodes mask using our tool lasts around 1
minute, which when compared with the normal
manual procedure performed by the physicians that
lasts around 40 min, is much faster and practical.
Figure 4: Fusion of CT images pre-aligned with: (A) the
DBS lead mask obtained after the 3D labelling connect
components algorithm; (B) electrodes mask obtained by
the automatic algorithm.
Normally, the physician needs to have prior
knowledge on neuroimaging software to manually
determine the bottom tip and specific angles in
relation to the DBS lead, in order to estimate its
trajectory and therefore determine each location of
the electrodes (Rozanski et al., 2013); (Guo et al.,
2013). Videen et al., (2008) uses a similar approach
by manually estimate the deepest tip and the center
of the lead in upper slices. On the other hand,
Zonenshayn et al., (2004) calculates the stereotactic
frame’s arc, collar angles and the most distal
electrode in stereotactic space by microelectrode
recordings, in order to estimate the trajectory of the
lead. In both methods, based on the trajectory and
the bottom tip, the coordinates of each electrode are
manually determined and used to create ROIs. This
entire procedure is very time consuming when
compared with the segmentation time of our tool,
which makes our system more pragmatic and
motivating for neurologists.
Therefore, our interface can be widely used by
physicians, since it is not time consuming and allows
an automatic and accurate estimation of electrodes
locations.
Furthermore, the user-friendly interface allows
the user to export a mask with DBS leads as well as
specify which electrodes will be in the mask to be
exported. These characteristics allow, for instance,
the selection of only the activated ones, which can
be useful in DBS investigation studies. As opposed,
the entire DBS lead mask can be useful in a clinical
environment to study the impact of microlesional
A
B
PhyCS2014-InternationalConferenceonPhysiologicalComputingSystems
52

damage caused by its implantation in the brain
(Horn et al., 2013).
The co-registration pipeline and the electrodes
masks exported by the interface allow the fusion of
T1-MRI with electrodes in a single view, as depicted
in Figure 5. This is important to visualize the
anatomical electrodes position and confirm their
implantation in the target areas, activating only the
ones which may lead to the better outcomes and
avoiding the ones which are near to structures such
as the substantia nigra responsible to promote acute
side effects (Ulla et al., 2011).
Figure 5: Multimodal neuroimage fusion: Electrodes mask
(red) overlaid with T1-MRI dataset where adjacent deep
brain structures can be related to the electrode positioning.
5 CONCLUSIONS
The purpose of this study was to develop a system
for the localization of electrodes from the DBS lead
and use multimodal techniques to confirm their
placement in the neurosurgery target areas.
Since the multimodal co-registration pipeline
results in fine alignments and an accurate brain
extraction (for all 16 cases), the parameters chosen
either for BET and FLIRT are recommended to
visualize the anatomic position of DBS electrodes,
in future studies.
Regarding the electrodes segmentation and
localization, it can be concluded that the user-
friendly interface can be useful in a clinical
environment and in future DBS studies to
automatically produce the electrodes masks, since
the differences between the detected electrodes
positions and the ones estimated manually by an
experienced physician were less than a voxel in all
cases.
In addition, the creation of the electrodes mask
using our tool lasts around 1 minute, much faster
and practical when compared with the common
procedures performed by physicians.
Therefore, using our system it is possible to
obtain an anatomic location of each electrode and
may contribute to the improvement of the efficacy of
DBS and consequently the patient’s outcome.
In the future, it would be interesting to use the
system to find any correlation of the exact anatomic
position of the electrodes with the clinical outcomes.
In additon, using DTI information, it would be also
possible to study the influence of the 3D electrode
localisation in the connectivity patterns of the
cortico-basal-ganglia-thalamo-cortical circuit. These
studies could be extended not only for Parkinson and
Dystonia patients, but for all the diseases treated by
DBS such as resistant depression, schizophrenia and
mood disorders.
ACKNOWLEDGEMENTS
This work is financed by the ERDF – European
Regional Development Fund through the
COMPETE Programme (operational programme for
competitiveness) and by National Funds through the
FCT – Fundação para a Ciência e a Tecnologia
(Portuguese Foundation for Science and
Technology) within project «FCOMP - 01-0124 -
FEDER-022701» and «PTDC/NEU-
SCC/0767/2012».
REFERENCES
Bardinet E., Bhattacharjee M., Dormont D., Pidoux B.,
Malandain G., Schüpbach M., Ayache N., Cornu P.,
Agid Y., Yelnik J., 2009. A three-dimensional
histological atlas of the human basal ganglia. II. Atlas
deformation strategy and evaluation in deep brain
stimulation for Parkinson disease. J Neurosurg.,
110(2):208-219.
Cahill N. D., 2010. Normalized measures of mutual
information with general definitions of entropy for
multimodal image registration. In WBIR’10
Proceedings of the 4
th
international conference on
Biomedical image registration, pages 258-268.
Springer-Verlag.
Guo S., Zhuang P., Hallett M., Zheng Z., Zhang Y., Li J.,
Li Y., 2013. Subthalamic deep brain stimulation for
Parkinson's disease: correlation between locations of
oscillatory activity and optimal site of stimulation.
Parkinsonism Relat Disord., 19 (1):109-14.
Guridi J., Rodriguez-Oroz M. C., Lozano A. M., Moro E.,
Albanese A., Nuttin B., Gybels J., Ramos E., Obeso J.
A., 2000. Targeting the basal ganglia for deep brain
stimulation in Parkinson’s disease. Neurology, 55(12
Suppl 6):S21-8.
Precise3DDeepBrainStimulationElectrodeLocationbasedonMultimodalNeuroimageFusion
53

Haegelen C., Coupé P., Fonov V., Guizard N., Jannin P.,
Morandi X., Collins D. L., 2013. Automated
segmentation of basal ganglia and deep brain
structures in MRI of Parkinson's disease. Int J Comput
Assist Radiol Surg, 8(1):99-110.
Hebb A. O., Miller K. J., 2010. Semi-automatic
stereotactic coordinate identification algorithm for
routine localization of Deep Brain Stimulation
electrodes. J Neurosci Methods, 187(1):114-9.
Hemm S., Coste J., Gabrillargues J., Ouchchane L., Sarry
L., Caire F., Vassal F., Nuti C., Derost P., Durif F.,
Lemaire J. J., 2009 Contact position analysis of deep
brain stimulation electrodes on post-operative CT
images. Acta Neurochir (Wien), 151(7):823-9.
Horn A., Schönecker T., Schneider G-H., Kühn A. A.,
2013. Automatic reconstruction of DBS-Electrode
Placement from post-operative MRI-images. Journal
of Neural Transmission, 120:1137-1159.
Jenkinson M., Smith S., 2001. A global optimisation
method for robust affine registration of brain images.
Med Image Anal., 5(2):143-56.
Kupsch A., Kuehn A., Klaffke S., Meissner W., Harnack
D., Winter C., Haelbig T. D., Kivi A., Arnold G.,
Einhäupl K. M., Schneider G. H., Trottenberg T.,
2003. Deep brain stimulation in Dystonia. J Neurol
250 [Suppl 1]: I/47–I/52.
Lalys F, Haegelen C, Ferre JC, El-Ganaoui O, Jannin P.,
2010. Construction and assessment of a 3-T MRI brain
template. Neuroimage, 49(1):345-354.
Lalys F., Haegelen C., D'albis T., Jannin P., 2013.
Analysis of electrode deformations in deep brain
stimulation surgery. Int J Comput Assist Radiol Surg.
Lozano A. M., Mahant N., 2004. Deep brain stimulation
surgery for Parkinson's disease: mechanisms and
consequences. Parkinsonism Relat Disord, 10, Suppl
1:S49-57.
Pollo C., Villemure J.G., Vingerhoets F., Ghika J., Maeder
P., Meuli R., 2004. Magnetic resonance artifact
induced by the electrode Activa 3389: an in vitro and
in vivo study. Acta Neurochir (Wien), 146(2):161-4.
Rozanski V. E., Vollmar C., Cunha J. P., Tafula S. M. N.,
A. S.-A., Patzig M., Mehrkens J. H., Bötzel K., 2013.
Connectivity patterns of pallidal DBS electrodes in
focal Dystonia: a diffusion tensor tractography study.
Neuroimage, 84: 435–442.
Singh A., Kammermeier S., Mehrkens J. H., Bötzel K.,
2012. Movement kinematic after deep brain
stimulation associated microlesions. J. Neurol
Neurosurg Psychiatry, 83(10):1022-6.
Stolze H., Klebe S., Baecker C., Zechlin C., Friege L.,
Pohle S., Deuschl G., 2005. Prevalence of gait
disorders in hospitalized neurological patients.
Movement Disorders, 20(1):89-94.
Thani N. B., Bala A., Swann G. B., Lind C. R., 2011.
Accuracy of postoperative computed tomography and
magnetic resonance image fusion for assessing deep
brain stimulation electrodes. Neurosurgery, 69(1):207-
14.
Ulla M., Thobois S., Llorca P. M., Derost P., Lemaire J. J.,
Chereau-Boudet I., de Chazeron I., Schmitt A.,
Ballanger B., Broussolle E., Durif F., 2011. Contact
dependent reproducible hypomania induced by deep
brain stimulation in Parkinson's disease: clinical,
anatomical and functional imaging study. J Neurol
Neurosurg Psychiatry, 82(6):607-14.
Videen T. O., Campbell M. C., Tabbal S. D., Karimi M.,
Hershey T., Perlmutter J. S., 2008. Validation of a
fiducial-based atlas localization method for deep brain
stimulation contacts in the area of the subthalamic
nucleus. Journal of Neuroscience Methods, 168:275–
281.
Zonenshayn M., Sterio D, Kelly P. J., Rezai A. R., Beric
A., 2004. Location of the active contact within the
subthalamic nucleus (STN) in the treatment of
idiopathic Parkinson's disease. Surg Neurol.,
62(3):216-25.
PhyCS2014-InternationalConferenceonPhysiologicalComputingSystems
54
