
Quantitative Analysis of Pulmonary Emphysema using Isotropic
Gaussian Markov Random Fields
Chathurika Dharmagunawardhana
1
, Sasan Mahmoodi
1
, Michael Bennett
2
and Mahesan Niranjan
1
1
School of Electronics and Computer Science, University of Southampton, Southampton, SO17 1BJ, U.K.
2
National Institute for Health Research, Southampton Respiratory Biomedical Research Unit, University Hospital
Southampton NHS Foundation Trust, Tremona Road, Southampton, U.K.
Keywords:
Emphysema, Spatially Varying Parameters, Gaussian Markov Random Fields, Tissue Classification.
Abstract:
A novel texture feature based on isotropic Gaussian Markov random fields is proposed for diagnosis and quan-
tification of emphysema and its subtypes. Spatially varying parameters of isotropic Gaussian Markov random
fields are estimated and their local distributions constructed using normalized histograms are used as effec-
tive texture features. These features integrate the essence of both statistical and structural properties of the
texture. Isotropic Gaussian Markov Random Field parameter estimation is computationally efficient than the
methods using other MRF models and is suitable for classification of emphysema and its subtypes. Results
show that the novel texture features can perform well in discriminating different lung tissues, giving compar-
ative results with the current state of the art texture based emphysema quantification. Furthermore supervised
lung parenchyma tissue segmentation is carried out and the effective pathology extents and successful tissue
quantification are achieved.
1 INTRODUCTION
Emphysema is a critical lung disease causing exten-
sive lung tissue destruction and is currently emerg-
ing as a worldwide health problem. The main causes
of emphysema are smoking or inhaling toxic air and
a genetic disorder known as alpa-1-antitrypsin de-
ficiency. The pulmonary function test (PFT) also
known as spirometry and computed tomography (CT)
analysis are the two common approaches used to di-
agnose emphysema. PFT is a clinical test associated
with measuring breath volumes. High resolution CT
(HRCT) image analysis is more informative than PFT
and useful for analyzing pathology distribution, as-
sessing severity and identifying a wide variety of sub
type patterns of pulmonary lung diseases.
The amount of information present in CT imag-
ing have largely increased with the recent technical
developments of medical equipment. Therefore com-
puter aided diagnosis (CAD) of CT scans is widely
preferred (Litmanovich et al., 2009). Partially or
fully automated CAD methods are fast, precise and
highly reproducible compared to subjective visual as-
sessment in medical image processing (Madani et al.,
2001). CAD of emphysema mainly depends on tex-
ture features and intensity information.
In this paper we propose a new texture feature for
emphysema quantification based on isotropic Gaus-
sian Markov random fields (IGMRF). In Markov ran-
dom field (MRF) feature extraction, the parameters of
MRF model are used as texture features. The applica-
tion of model based statistical features to emphysema
quantification is not commonly used because of the
relatively high computational cost. Also the model
parameters are spatially constant, therefore, subtle
pattern variations which are crucial in tissue discrim-
ination are smoothen out.
However, the parameter estimation of IGMRFs is
simple and fast compared to other MRFs and ide-
ally suited for isotropic texture representation. In ad-
dition, we formulate the novel texture feature based
on IGMRF characterized by spatially varying param-
eters addressing above issues in model based fea-
ture extraction. Spatially varying parameter estima-
tion is closely related to the structural feature extrac-
tion. Therefore, the method itself is a semi parametric
method and integrates the best of both statistical and
structural features.
In this study, distributions of spatially varying pa-
rameters of IGMRFs constructed by normalized his-
tograms are used as a discriminative texture feature.
The approach is used to classify between healthy
44
Dharmagunawardhana C., Mahmoodi S., Bennett M. and Niranjan M..
Quantitative Analysis of Pulmonary Emphysema using Isotropic Gaussian Markov Random Fields.
DOI: 10.5220/0004728900440053
In Proceedings of the 9th International Conference on Computer Vision Theory and Applications (VISAPP-2014), pages 44-53
ISBN: 978-989-758-009-3
Copyright
c
2014 SCITEPRESS (Science and Technology Publications, Lda.)

lung tissue (NT) and two sub types of emphysema,
namely centrilobular emphysema (CLE) and parasep-
tal emphysema (PSE). The experimental results show
that normal lung and emphysema, including its sub-
types, can be efficiently discriminated using IGMRF
features. The results are also compared against the
state of the art LBP based emphysema quantification
(Sørensen et al., 2010) and comparable performances
are achieved.
We also perform supervised lung tissue segmen-
tation on a CT slice dataset (Sørensen et al., 2013)
and achieve satisfactory lung parenchyma pathology
distributions and quantification of emphysema and its
subtypes. The quantitative results correlates with the
available labellings of visual inspection by experi-
enced radiologists and emphysema index (EI). The
novel texture features successfully discriminate the
healthy lung tissue from emphysema and can be used
in sub type diagnosis.
The remainder of this paper is organized as fol-
lows. In section 2 currently used methods of emphy-
sema quantification are discussed. IGMRF model is
introduced in section 3 and texture feature formula-
tion is explained in section 4. Experimental results
and discussions are elaborated in section 5 and finally,
conclusions are given in section 6.
2 BACKGROUND
CAD approaches based on lung CT scans for em-
physema quantification can be categorized into inten-
sity (CT density) based methods and texture based
techniques. Under intensity based techniques, many
studies have been carried out to find an absolute
threshold value below which emphysema is consid-
ered to be present. (Muller et al., 1988) introduced
a method known as ‘emphysema index’ or ‘density
mask’ which measures the relative amount of lung
parenchymal pixels that have attenuation values be-
low -910 HU. Further studies have obtained the op-
timal threshold value for emphysema quantification
as -950HU (Litmanovich et al., 2009). An adaptive
thresholding method that also incorporates the infor-
mation of pixel locations on the lung has been intro-
duced by (Hara et al., 2004). Another approach has
been proposed based on mean lung density and voxel
dimensions (Coxson et al., 1999).
Intensity based CAD techniques usually suf-
fer from problems caused by monotonic intensity
changes. This may occur due to several reasons, for
example, the influence of contrast materials and de-
gree of inspiration of the lung while scanning (Muller
et al., 1988). Secondly there is a degree of corruption
in the CT image due to noise, arising from strict limi-
tations on radiation power that can be applied on a pa-
tient (Sprawls, 1995). Techniques solely based on in-
tensity are highly sensitive to the noise. (H
¨
ame et al.,
2013) proposed a hidden Markov measure field model
to obtain more promising emphysema index measures
than standard densitometric approaches showing ro-
bustness to noise resulting from reconstruction ker-
nels. However, intensity and texture based integrated
approaches are the better choice for pulmonary lung
disease analysis using CT (Sørensen et al., 2010).
Texture based CAD techniques are a successful
methodology to use in assessing the presence and dis-
tribution of emphysema and its subtype patterns. The
texture features can be categorized as statistical, spec-
tral and structural features (Litmanovich et al., 2009).
(Uppaluri et al., 1999) used a method known as adap-
tive multiple feature method (AMFM) which assessed
22 independent statistical features in order to classify
different lung tissue patterns. This approach is further
improved by extending it from 2D to 3D by (Xu et al.,
2006), to classify emphysema and early smoking-
related pathologies. (Mishima et al., 1999) attempt to
detect early emphysema on the basis of fractal analy-
sis. Spatial gray level dependence method (SGLDM),
Gray level run length method (GLRLM) and Gray
level Difference Method (GLDM) have also been
used as statistical feature extraction methods for em-
physema diagnosis (Vasconcelos et al., 2010). (De-
peursinge et al., 2010) have used the density his-
togram and quincunx wavelet frame coefficients with
number of pixels below -1000 HU as the feature set to
evaluate emphysema classification performance with
different classifiers. In (Kim et al., 2009) statistical
texture features as well as shape features are also em-
ployed in lung disease classification.
(Sluimer et al., 2003) have used Gaussian, Lapla-
cian of Gaussian and first and second order deriva-
tives of Gaussian filters in different scales and have
obtained the histogram of responses as spectral tex-
ture features. (Depeursinge et al., 2007) have used
discrete wavelet frame (DWF) to classify lung tissue
types including emphysema. However, filter based
methods require selection of an optimal filter set and
employing reasonable sizes for filter kernels.
Structural features encapsulate information on
structures of the texture such as arrangements of tex-
ture primitives. A texton based method has been in-
troduced in (Gangeh et al., 2010). (Sørensen et al.,
2010) applied rotational invariant local binary pat-
terns (LBP) for successful emphysema quantification.
This method acquires very compelling results and can
be considered as the current state of the art texture
based emphysema quantification method.
QuantitativeAnalysisofPulmonaryEmphysemausingIsotropicGaussianMarkovRandomFields
45

In the present study we integrate the essence of
statistical and structural properties of texture by for-
mulating a hybrid feature extraction scheme. There-
fore, these features can encapsulate the information
about variations in the texture primitive and its ar-
rangement patterns and also information about sta-
tistical dependencies and pixel interactions. IGMRF
model is used to capture neighbor dependencies and
spatially varying parameter estimation is used to cap-
ture structural information.
3 IGMRF MODEL
Gaussian Markov Random Field (GMRF) is an im-
portant subclass of MRFs and gives simplified ways
of parameter estimation with less computational bur-
den compared to that of MRFs (Rue and Held, 2005;
Manjunath and Chellappa, 1991; Mahmoodi and
Gunn, 2011). A local conditional probability distri-
bution of GMRF model encapsulates spatial depen-
dencies between a pixel and its neighbors, associat-
ing them in a Gaussian functional form (Petrou and
Sevilla, 2006). Let Ω = {(i, j)|1 ≤i ≤H,1 ≤ j ≤W}
represent the set of grid points on a H ×W regular
lattice corresponding to the pixels in an image region.
The image region on Ω is preprocessed to have zero
mean. The intensity value of the pixel at s = (i, j)
position is given by y
s
. The local conditional model
of GMRF describing probability of y
s
given its neigh-
bors y
s+r
, r being relative neighbor position on the
neighborhood
˜
N
s
is given by,
p(y
s
|y
s+r
,α
r
,σ, j ∈
˜
N
s
) =
1
√
2πσ
2
exp
−
1
2σ
2
y
s
−
∑
r∈
˜
N
s
α
r
¯y
s+r
!
2
(1)
where α
r
is the interaction coefficient which mea-
sures the influence by a neighbor intensity value at the
neighbor position r. The neighbor pixels in symmet-
ric positions about the considered pixel are assumed
to have identical parameters, i.e. α
r
= α
−r
(Petrou
and Sevilla, 2006), therefore ¯y
s+r
= (y
s+r
+ y
s−r
), the
sum of two neighbor values situated in symmetric
neighbor positions with respect to the pixel. Then
˜
N
s
,
is the asymmetric neighborhood such that if r ∈
˜
N
s
,
then −r /∈
˜
N
s
(Zhao et al., 2007).
IGMRF is a special case of GMRF also known
as circular symmetric GMRF and further simplify
the GMRF model (Kashyap and Khotanzad, 1986).
IGMRFs model non directional isotropic textures in
a simplified rotational invariant framework with only
two model parameters. Parameter estimation is sim-
ple and fast compared to other MRF models because
Figure 1: Multiresolution circular neighborhood system
corresponding to (R,P) = {(1, 8),(2,16),(3, 24)}.
Figure 2: The five nearest neighborhood samples N
k
(k ∈
Ω
s
) corresponding to (R,P) = (1,8) at pixel s which is used
for spatially varying parameter estimation.
solutions for parameters can be found analytically
and without requiring any matrix inversion. IGMRF
model is given by,
p(y
s
|y
s+r
,α, σ,r ∈N
s
) =
1
√
2πσ
2
exp
−
1
2σ
2
y
s
−α
∑
r∈N
s
y
s+r
!
2
(2)
α and σ are the model parameters to be esti-
mated. y
s+r
are the neighbors in the circular symmet-
ric neighborhood of y
s
and N
s
= {r|r ∈
˜
N
s
}∪{r|−r ∈
˜
N
s
}. Circular neighborhoods used in this study is
shown in figure 1. R is the radius and P is the number
of neighbors in a circle of radius R. This representa-
tion is similar to the neighbor selection in multireso-
lution LBP (Ojala et al., 2002). Therefore we name
this neighborhood system as multiresolution circular
neighborhood system and represent by (R,P) variable
setting. In each resolution (R,P), the model parame-
ters are separately estimated. The α parameter rep-
resents the strength of interaction on center pixel by
neighbors in a certain resolution and the σ parameter
corresponds to the roughness of the texture. Bilinear
interpolation is used to estimate the neighbor values
at off grid positions similar to (Ojala et al., 2002).
For the problem of emphysema and lung tissue
discrimination this model is more appropriate because
the texture patterns involving the problem have less
directional qualities and more isotropic qualities (see
(Sørensen et al., 2013)). Therefore with a minimal
computational cost, the benefits of statistical model
based feature extraction can be applied on to the prob-
lem of emphysema discrimination.
VISAPP2014-InternationalConferenceonComputerVisionTheoryandApplications
46
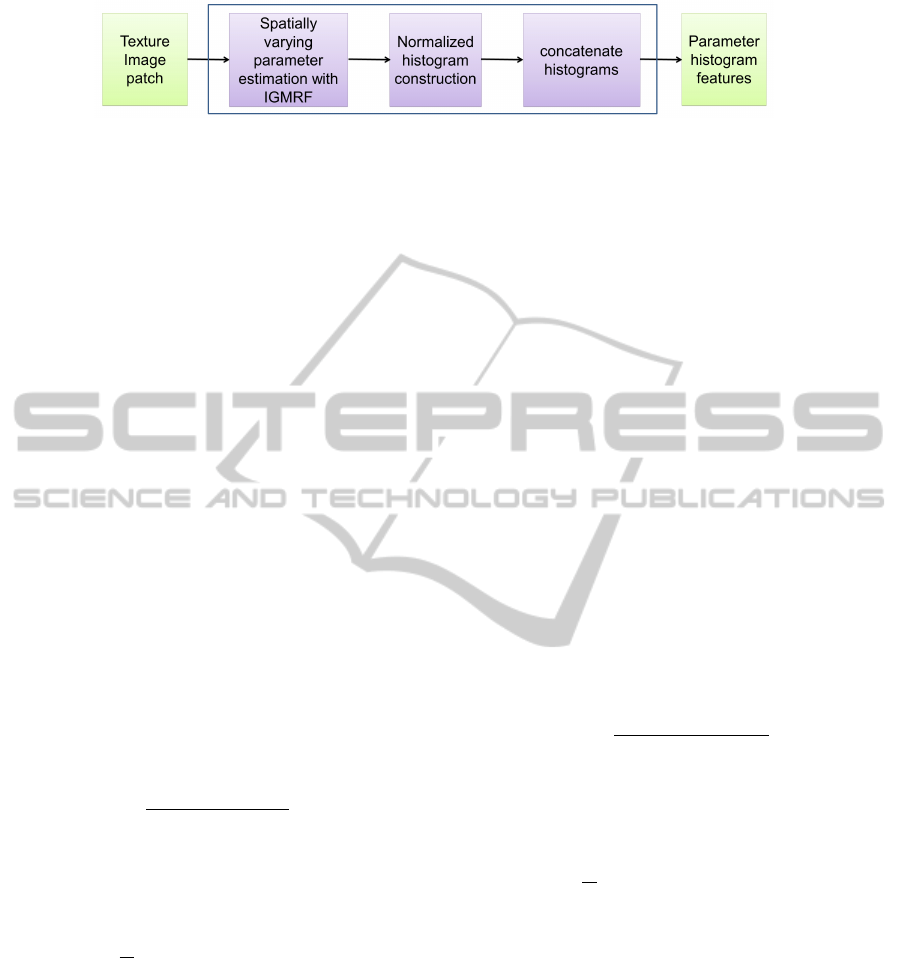
Figure 3: Parameter histogram texture feature formulation.
3.1 Parameter Estimation
The choice of using least squares estimation (LSE)
for parameter estimation for GMRF is suggested by
(Manjunath and Chellappa, 1991). LSE is used here
for estimating parameters of the model. The main as-
sumption behind the LSE method is that because (2)
is Gaussian, the estimated value of y
s
is more proba-
ble to be the mean value of the function (Petrou and
Sevilla, 2006). Therefore from the linear least square
sense the residual will be,
ε
s
= y
s
−α
∑
r∈N
s
y
s+r
(3)
For least square fitting, given a stationary texture,
sample neighborhoods of the texture are extracted by
linear scanning of the region. Overlapping neighbor-
hoods are also allowed (Li, 2009). When N samples
(≤ H ∗W ) of neighborhoods representing the texture
is given the least square solution is,
α = arg min
α
∑
s∈Ω
ε
2
s
= arg min
α
∑
s∈Ω
y
s
−α
∑
r∈N
s
y
s+r
!
2
(4)
By setting the first derivative to zero the parameter
value can be obtained as,
α =
∑
s∈Ω
y
s
∑
r∈N
s
y
s+r
∑
s∈Ω
∑
r∈N
s
y
s+r
2
(5)
The variance parameter of the model is then cal-
culated by,
σ
2
=
1
N
∑
s∈Ω
y
s
−α
∑
r∈N
s
y
s+r
!
2
(6)
The simple forms of solutions obtained for model
parameters given by (5) and (6) can be easily imple-
mented and efficiently computed.
4 FEATURE FORMULATION
Spatially varying parameter estimation is performed
here to capture the structural and texel level local in-
homogeneity of the texture. Spatially varying param-
eter estimation is sensitive to the subtle changes in
the texture. (Dharmagunawardhana et al., 2012) have
shown the significance in employing spatially vary-
ing parameters in model based statistical texture fea-
ture extraction and shown remarkable results on gen-
eral texture segmentation. The local distributions of
spatially varying parameters are better choice for dis-
criminative texture features than using spatially con-
stant GMRF parameters.
Localized small model estimation is performed
here to estimate spatially varying parameters of
the texture image or patch (Dharmagunawardhana
et al., 2012). Small model estimation considers
using local nearest neighborhood samples in the
region Ω
s
(⊂ Ω), for the estimation process. Here we
use nearest five neighborhood samples, i.e N
k
, k ∈
s + (0,0),s + (1,0), s + (−1,0),s + (0, 1),s + (0,−1)
or k ∈ Ω
s
and ||k − s||
2
= 1 (Figure 2). At each
pixel, a localized estimation procedure is carried out
similar to estimation method discussed in section 3.1,
using these five nearest samples (N = 5). Then the
estimated parameter values at pixel s is,
α
s
=
∑
k∈Ω
s
y
k
∑
r∈N
k
y
k+r
!
∑
k∈Ω
s
∑
r∈N
k
y
k+r
!
2
(7)
The variance parameter of the model is given by,
σ
2
s
=
1
N
∑
k∈Ω
s
y
k
−α
s
∑
r∈N
k
y
k+r
!
2
(8)
Estimating the parameter vectors [α
s
,σ
s
]
T
, for all
the pixels in Ω results in two parameter images corre-
sponding to the two model parameters. The normal-
ized histogram of each parameter image is then con-
catenated into one long vector which is used as the
feature vector of the texture image. The number of
bins and the bin range is manually fixed. Hereafter
we refer to these features as parameter histogram fea-
tures and their construction is graphically illustrated
in figure 3.
This approach can be seen as the inclusion of
structural information into a statistical model based
technique. (Dharmagunawardhana et al., 2012) have
clearly demonstrated that this technique significantly
QuantitativeAnalysisofPulmonaryEmphysemausingIsotropicGaussianMarkovRandomFields
47
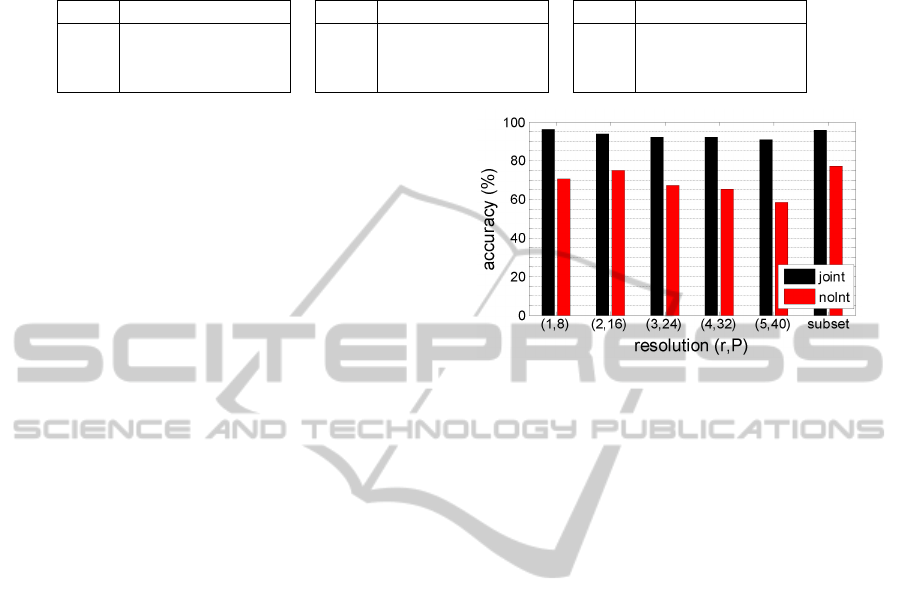
Table 1: Confusion matrices for three class classification problem involving the classes NT, CLE and PSE. LBP result is
obtained from (Sørensen et al., 2010).
noInt joint LBP
NT CLE PSE
NT 37 19 3
CLE 10 40 0
PSE 4 2 53
NT CLE PSE
NT 57 2 0
CLE 2 48 0
PSE 1 2 56
NT CLE PSE
NT 55 0 4
CLE 1 49 0
PSE 2 1 56
enhances the discriminative power of model based
features, specifically for texture classification and
segmentation purposes.
5 RESULTS AND DISCUSSION
To evaluate the novel texture feature performance
on emphysema diagnosis and quantification we use
the online emphysema dataset from (Sørensen et al.,
2013) which has been also used in performance evalu-
ation of LBP and filter based features (Sørensen et al.,
2010). The database comprises 115 HRCT slices
of size 512 ×512 and 168 of square patches of size
61 ×61 obtained from a subset of slices. The HRCT
slices belong to a study group of 39 subjects includ-
ing non smokers, smokers and smokers with chronic
obstructive pulmonary disease.
Each slice is labeled according to the leading pat-
tern of interest and severity by an experienced chest
radiologist and a pulmonologist. The leading pat-
terns are normal tissue (NT), centrilobular emphy-
sema (CLE), paraseptal emphysema (PSE) and pan-
lobular emphysema (PLE). The severity of each slice
is classified as no emphysema (0), minimal (1), mild
(2), moderate (3), severe (4) and very severe (5).
Leading pattern of each patch is also available and
there are 59 NT patches, 50 CLE patches and 59 PSE
patches. In this study, only NT, CLE and PSE classes
are used. However, clinical test results on PFT tests
are currently unavailable for the dataset. Therefore,
correlations of the results with emphysema index and
diagnosis from visual inspection by experience radi-
ologists are considered.
5.1 Emphysema Classification
First, the patch dataset is used in a classification
framework to identify the discriminative ability of the
texture features. (Sørensen et al., 2010) reported sat-
isfactory classification performance for this dataset
with joint LBP using the parameter setting (R,P) =
{(1,8), (2,16)} and a region of interest (ROI) of
size 31 ×31. Following (Sørensen et al., 2010), the
present study also employs 31 ×31 ROIs extracted
from each 61 ×61 patches. For histogram calculation
Figure 4: Leave one subject out classification accuracy for
three class problem, NT,CLE and PSE.
bins = {10,20,30,40,50}are evaluated and bins = 40
is selected in the following experiments. The α pa-
rameter bin range is set from −1 to +1. The σ pa-
rameter bin range is set from 0 to 100. The leave
one subject out classification technique discussed in
(Sørensen et al., 2010) with nearest neighbor classifier
is used. In each leave one subject out trial, assigned
labels are stored and in the end of all trials assigned
labels are matched against the true labels to calculate
the accuracy (Sørensen et al., 2010). The absolute
sum of difference between histograms is taken as the
distance metric.
The performance of parameter histograms with
and without integrating intensity information is ex-
amined. The technique in which parameter his-
tograms are constructed without integrating inten-
sity information is referred to as ‘noInt’ and the
joint intensity-parameter histograms are represented
by ‘joint’ in this paper. Figure 4 shows the clas-
sification accuracies obtained for three class prob-
lem, NT, CLE and PSE for noInt and joint features
with various neighborhood systems (R,P). The ac-
curacy gradually decreases with increasing resolution
of the neighborhood system suggesting features from
lower resolutions are more significant. The case ‘sub-
set’ represents the integrated features from multires-
olution levels of the neighborhood system (R,P) =
{(1,8), (2,16),(3,24)}. Based only on texture infor-
mation, an accuracy of 77.4% can be obtained for the
case ‘subset’. However, integrating intensity vastly
improves the accuracy to 95.8%. This is comparable
with the accuracies reported for LBP features which is
79.2% with only texture information and 95.2% with
VISAPP2014-InternationalConferenceonComputerVisionTheoryandApplications
48
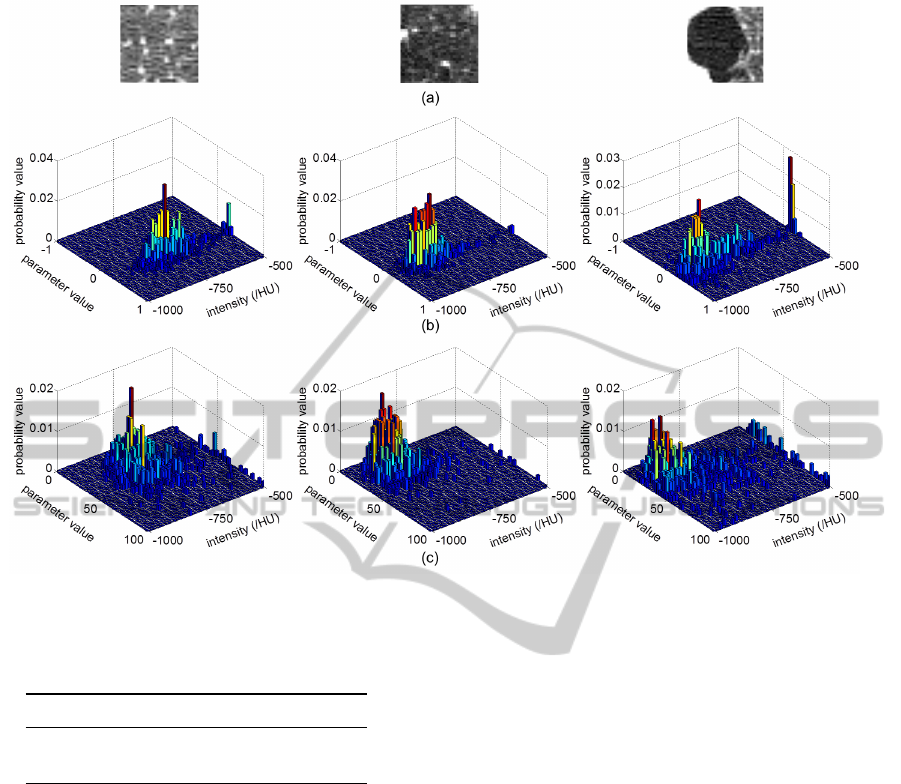
Figure 5: IGMRF parameter histograms. (a) original patches from the three classes NT, CLE, PSE respectively (31 ×31), (b)
α and intensity joint histograms , (c) σ and intensity joint histograms. (R,P) = (1,8) and bins = 40 in each axis are used.
Table 2: Comparison with other GMRF model based texture
feature extraction methods.
joint PL TGMRF
accuracy (%) 94.6 94.0 62.5
time (s) 16.1 50.2 3.09
joint intensity-LBP features (Sørensen et al., 2010).
The confusion matrices obtained for the three
class problem by the proposed features and LBP
method are shown in table 1. The LBP results are
taken from the joint intensity-LBP histogram perfor-
mance reported in (Sørensen et al., 2010). The confu-
sion matrix of noInt features clearly indicate that NT
and CLE classes have higher number of mis-classified
ROIs as a consequence of disregarding intensity infor-
mation. The joint parameter histogram features and
joint LBP-intensity features perform comparatively
well in discriminating different lung tissues.
Next the performance with other GMRF based
texture features is evaluated for comparison. Table
2 shows the classification accuracies for joint param-
eter histogram features proposed here with (R,P) =
(1,8) and bins = 20, parameter local histogram fea-
tures (PL) obtained from the technique in (Dharma-
gunawardhana et al., 2012) with second order neigh-
borhood system and bins = 20 and spatially con-
stant GMRF features (TGMRF) based on (Manju-
nath and Chellappa, 1991) with second order neigh-
borhood system. The joint parameter histogram, PL
features and TGMRF features have a dimensional-
ity of R
2∗bins
2
, R
5∗bins
2
and R
5
respectively. The to-
tal time elapsed for feature extraction of complete
patch dataset in Matlab R2013a environment running
on a 2.67 GHz CPU is also provided. Here, PL and
TGMRF features are integrated with intensity similar
to the joint parameter features.
It can be clearly seen that spatially varying param-
eters are more discriminative compared to spatially
constant features obtained from TGMRF. However
PL is comparatively slower because, firstly the model
associates many parameters to estimate and secondly
the subsequent histogram construction stage require
more memory and computations. Compared to PL,
the joint parameter histogram features provides faster
feature formulation. The accuracies for joint parame-
ter histogram features and PL are almost similar im-
plying that for this specific problem IGMRF is suffi-
cient and additional directional information in GMRF
based PL features have not been of much use.
Therefore, based on classification performances,
joint feature of IGMRF parameter histograms are a
preferable efficient choice for emphysema and its sub-
QuantitativeAnalysisofPulmonaryEmphysemausingIsotropicGaussianMarkovRandomFields
49
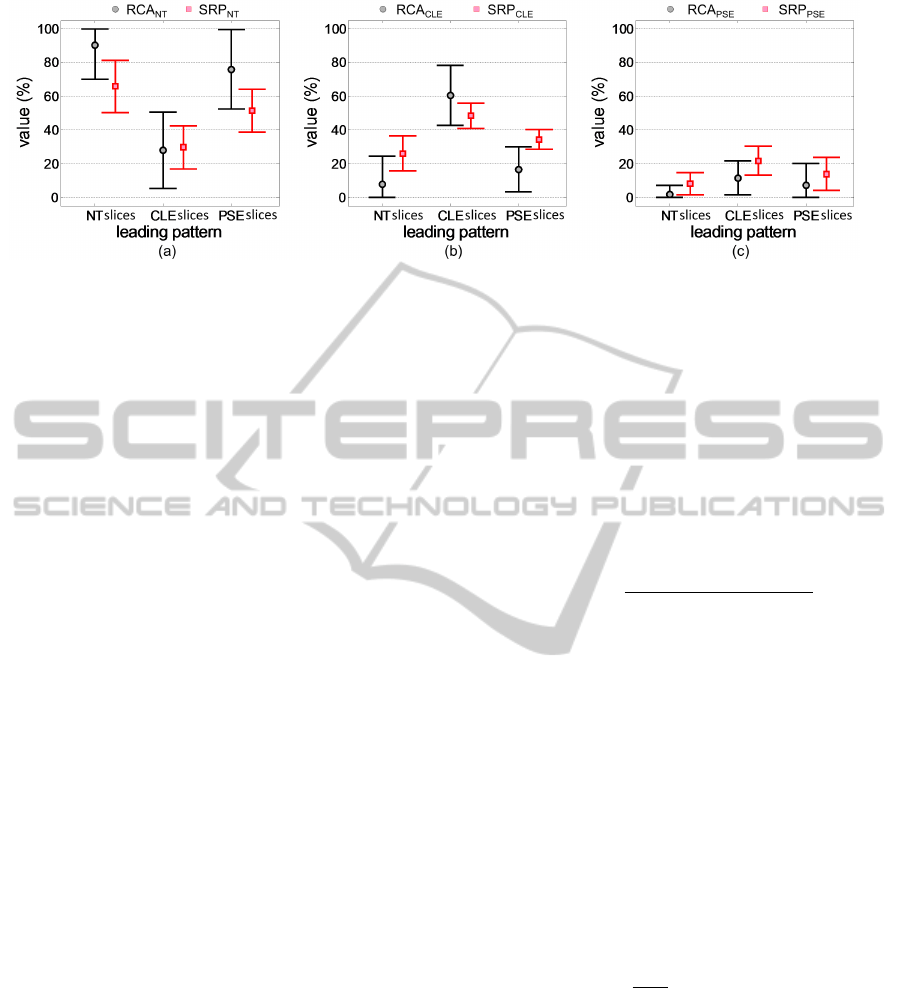
Figure 6: Tissue quantification with RCA
ω
c
and SRP
ω
c
for each category of slices (NT, CLE and PSE) grouped according to
leading patterns labeled by visual inspection judgments. (a) NT tissue quantification, (b) CLE tissue quantification, (c) PSE
tissue quantification. Note that the error bars are truncated near 0% and 100%.
type diagnosis. Figure 5 shows the joint features of α
and σ parameters of IGMRF. Results could be further
improved by feature selection.
5.2 Emphysema Quantification
In this section, we perform lung parenchyma pixel
classification of 115 CT slices for emphysema quan-
tification. The features extracted from 31×31 labeled
ROIs in section 5.1 are employed as the training mod-
els. The training models obtained from a subset of
PSE ROIs are used. This subset represent moderate
to severe PSE and clearly represent reasonably large
regions of PSE tissue pattern with minimum confu-
sion with NT or CLE class tissue. These PSE ROIs
contains approximately 15% or less near boundary
non parenchymal pixels. This setting of ROIs of PSE
class can employ the prior information that PSE has
high probability of occurrence near the boundary of
the lung parenchyma (Sørensen et al., 2010). During
the slice pixel classification all the training patches
belong to the subject of corresponding slice are left
out from training set.
The (R,P) = (1,8) is used with bins = 40 to con-
struct joint parameter histogram features. The 6 slices
out of 115 slices which belongs to class PLE are not
considered because the patch data is unavailable. The
remaining 109 slices with leading patterns NT, CLE
and PSE are employed for tissue quantification. Note
that the leading pattern of each slice is available prior
to the quantification based on the visual inspection of
experienced radiologists.
First of all, the spatially varying parameters of the
lung parenchyma pixels are estimated. Then a win-
dow of size 31 ×31 is column-wise scanned on the
parameter images and the normalized parameter his-
tograms for each pixel is constructed.
The pixels outside the lung parenchyma is directly
labeled as the background class by thresholding. The
thresholding is based on the knowledge that the CT
density values of lung parenchyma pixels are usually
between −1000HU to −500HU.
Hard and soft classification are performed here.
The hard classification assigns each pixel a class label
depending on the nearest training model to its feature
vector. The soft classification finds the probability a
pixel belongs to a certain class. We define the follow-
ing expression to calculate the class probabilities.
p(ω
c
/y
s
) =
exp{−D(h
s
,M
ω
c
)
2
}
C
∑
c=1
exp{−D(h
s
,M
ω
c
)
2
}
(9)
where ω
c
represent the class and C is the number
of classes. h
s
is the feature vector of the considered
parenchyma pixel and M
ω
c
is the nearest feature vec-
tor in the training set to h
s
from class ω
c
. D(.) is the
sum of absolute difference distance metric.
The tissue quantification is then carried out on
each slice. Two measures are obtained for each slice
by fusing the results of all the lung parenchyma pixels
on it. The relative hard classification accuracy RCA
ω
c
(Sørensen et al., 2010) gives the percentage of lung
tissue belonging to the class ω
c
. Based on soft classi-
fication probabilities we define the soft relative prob-
ability SRP
ω
c
for a class ω
c
according to,
SRP
ω
c
=
1
|Ω
L
|
∑
s∈Ω
L
p(ω
c
/y
s
) (10)
where Ω
L
is the lung parenchyma area and |Ω
L
| is
the number of pixels in the lung parenchyma.
RCA
ω
c
is a measure about the spatial extent of the
tissue from class ω
c
. The SRP
ω
c
measure introduced
here is sensitive to the severe tissue damages localized
in a smaller area which can not be quantified properly
as a higher degree of tissue damage by RCA
ω
c
.
The CT slices are categorized into groups accord-
ing to the leading pattern labellings given by the ra-
diologists. Then the averages and standard deviations
VISAPP2014-InternationalConferenceonComputerVisionTheoryandApplications
50
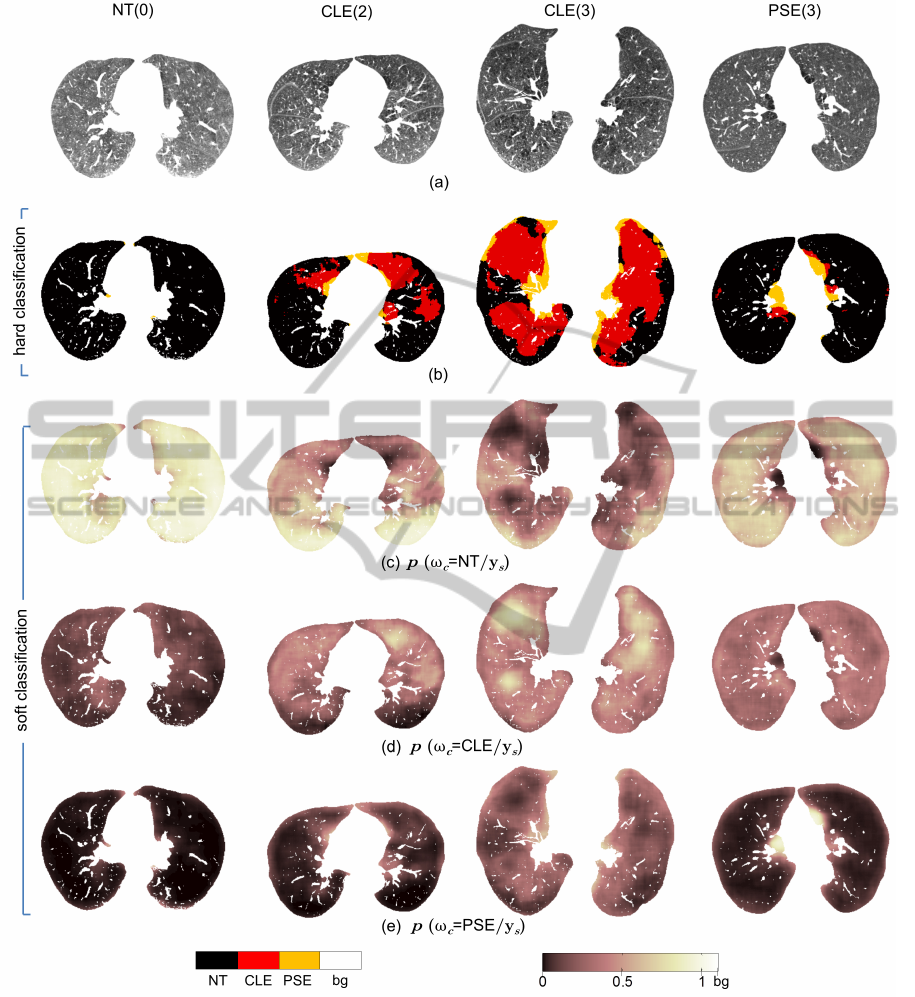
Figure 7: Lung parenchyma pixel classification for example slices representing NT, CLE and PSE slice groups. Severity is
indicated in parenthesis. (a) original slices, (b) hard classification results, (c) p(ω
c
= NT /y
s
) (d) p(ω
c
= CLE/y
s
) and (e)
p(ω
c
= PSE/y
s
) from soft classification. bg - background (pixels outside the lung parenchyma).
of RCA
ω
c
and SRP
ω
c
measurements of each catego ry
is calculated separately. Results are shown in figure
6. The RCA
ωc
and SRP
ω
c
counts in figure 6 are con-
sistent with the leading pattern labellings by visual in-
spections. For example, slices having leading pattern
label as NT have a higher RCA
NT
and SRP
NT
counts
and lower RCA
CLE
, RCA
PSE
and SRP
CLE
, SRP
PSE
counts. Most of the slices of PSE group in the consid-
ered slice dataset have minimal or mild PSE except
for one severe PSE slice. Therefore RCA
NT
count
is comparatively high indicating less tissue damage
extent from PSE. However, it is relatively less than
RCA
NT
for NT group.
Furthermore, figure 6c indicates that slices belong
QuantitativeAnalysisofPulmonaryEmphysemausingIsotropicGaussianMarkovRandomFields
51
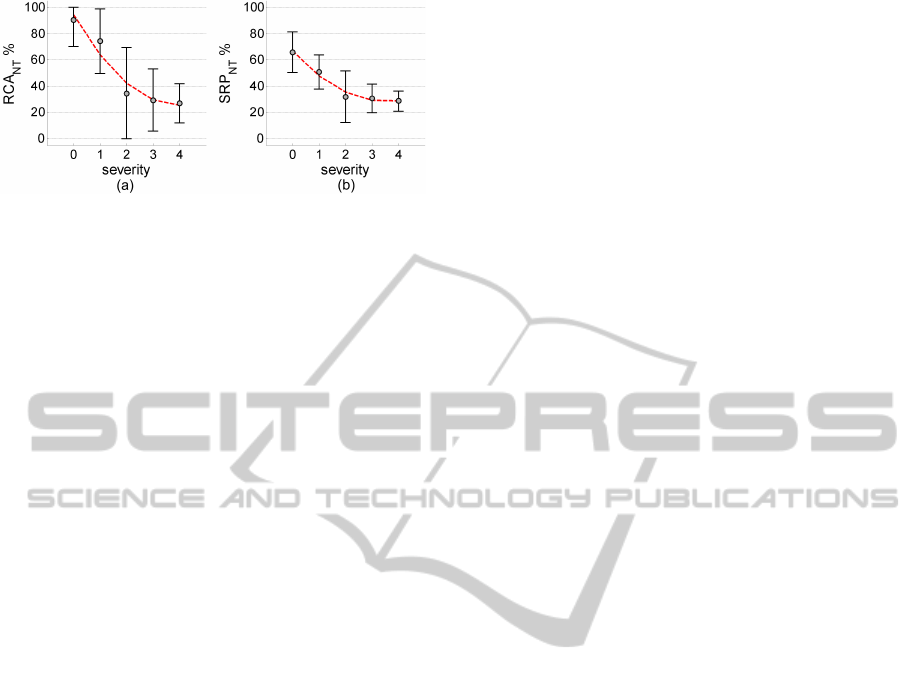
Figure 8: Tissue quantification with increasing severity.
to CLE group also have a tendency to contain higher
value of PSE tissue. In real world situation, the CLE
patients have a higher chance of co-existence of CLE
and PSE. The slices belonging to PSE class have a rel-
atively higher mis-classifications with CLE tissue giv-
ing higher RCA
CLE
and SRP
CLE
compared to RCA
PSE
and SRP
PSE
(figure 6b and c). RCA
ω
c
has compara-
tively larger standard deviations (figure 6). This ex-
plains the relatively low sensitivity of RCA
ω
c
com-
pared to SRP
ω
c
for pathology quantification.
Figure 7 demonstrates some example lung
parenchyma labeled by using the proposed approach.
The pathology distribution is effectively expressed.
Texture is a regional property, therefore, hard clas-
sification achieves relatively larger areas of emphy-
sematous tissue than from an intensity based thresh-
olding technique like emphysema index (EI) (Muller
et al., 1988). However, the correlation between to-
tal emphysema tissue count (RCA
CLE
+RCA
PSE
) from
proposed method and EI with −910HU threshold is
large, giving a correlation coefficient of 0.84 (p <
10
−4
). Moreover, pixels belonging to PSE tissue
are often classified near the boundary of the lung
parenchyma agreeing to the PSE location dependency
near boundary (Figure 7b). The tendency that the
CLE subjects also have PSE is also clearly reflected.
Finally, the severity of the slices and their corre-
sponding tissue percentages are evaluated. The NT
tissue counts RCA
NT
and SRP
NT
are shown in figure
8. The severity level 5 only has 2 CT slices and is not
considered here. The RCA
NT
and SRP
NT
measures
in figure 8 gradually reduce with increasing severity.
Therefore the results in figure 8 have a good correla-
tion with the severity labellings of the slices obtained
by visual inspection.
6 CONCLUSIONS
We have performed emphysema quantification using
a novel texture feature which integrates the essence of
model based statistical and structural texture features.
The online available emphysema dataset (Sørensen
et al., 2013) is used here. The proposed texture fea-
ture is used in emphysema classification involving the
classes NT, CLE and PSE. These results are compa-
rable with the state of the art texture based LBP em-
physema classification. We have also performed su-
pervised lung paremchyma pixel classification for tis-
sue quantification. The results illustrate convincing
pathology distributions and successful quantification
of lung tissues, well correlating with the class and
severity labellings by visual inspection. SRP
ω
c
mea-
sure obtained from soft classification has a higher sen-
sitivity to emphysema pathology quantification than
RCA
ω
c
. Evaluations on other emphysema datasets
and clinical test data are considered in future. Also
feature selection can be greatly helpful to reduce the
higher dimensionality of the features. Nevertheless
proposed feature perform efficient and effective lung
tissue classification.
ACKNOWLEDGEMENTS
Authors gratefully acknowledge Dr. Lauge Sørensen
for his kind support and all other researchers who
contributed to making available the online computed
tomography emphysema database. We are also im-
mensely thankful to anonymous reviewers for their
helpful comments.
REFERENCES
Coxson, H. O., Rogers, R. M., Whittall, K. P., Yachkova,
Y. D., Par, P. D., Sciurba, F. C., and Hogg, J. C. (1999).
A quantification of the lung surface area in emphy-
sema using computed tomography. 159 (3):851–6.
Depeursinge, A., Iavindrasana, J., Hidki, A., Cohen, G.,
Geissbuhler, A., Platon, A., Poletti, P., and M
¨
uller, H.
(2010). Comparative performance analysis of state-of-
the-art classification algorithms applied to lung tissue
categorization. Journal of digital imaging, 23(1):18–
30.
Depeursinge, A., Sage, D., Hidki, A., Platon, A., Poletti,
P. A., Unser, M., and Muller, H. (2007). Lung tis-
sue classification using wavelet frames. In Proc. IEEE
Int’l conf. of the Engineering in Medicine and Biology
Society, pages 6259–6262. IEEE.
Dharmagunawardhana, C., Mahmoodi, S., Bennett, M., and
Mahesan, N. (2012). Unsupervised texture segmen-
tation using active contours and local distributions
of Gaussian Markov random field parameters. In
Proc. British Machine Vision Conference, pages 88.1–
88.11.
Gangeh, M. J., Sørensen, L., Shaker, S. B., Kamel, M. S.,
Bruijne, M., and Loog, M. (2010). A texton-based
approach for the classification of lung parenchyma in
CT images. 13:595–602.
VISAPP2014-InternationalConferenceonComputerVisionTheoryandApplications
52

H
¨
ame, Y., Angelini, E. D., Hoffman, E. A., Barr, R. G.,
and Laine, A. F. (2013). Robust quantification of pul-
monary emphysema with a hidden Markov measure
field model. In Proc. 10th IEEE Int’l Symposium on
Biomedical Imaging, pages 382–385. IEEE.
Hara, T., Yamamoto, A., Zhou, X., Iwano, S., Itoh, S., Fu-
jita, H., and Ishigaki, T. (2004). Automated detection
system for pulmonary emphysema on 3D chest CT
images. In Proc. of SPIE, pages 915–919.
Kashyap, R. L. and Khotanzad, A. (1986). A model-based
method for rotation invariant texture classification.
IEEE Trans. on Pattern Analysis and Machine Intel-
ligence, (4):472–481.
Kim, N., Seo, J. B., Lee, Y., Lee, J. G., Kim, S. S., ,
and Kang, S. (2009). Development of an automatic
classification system for differentiation of obstructive
lung disease using hrct. Journal of digital imaging,
22(2):136–148.
Li, S. Z. (2009). Markov Random Field Modeling in Im-
age Analysis. Springer-Verlag London Ltd, 3rd edn
edition.
Litmanovich, D., Boiselle, P. M., and Bankier, A. (2009).
CT of pulmonary emphysema - current status, chal-
lenges, and future directions. 19:537–51.
Madani, A., Keyzer, C., and AGevenois, P. (2001). Quanti-
tative computed tomography assessment of lung struc-
ture and function in pulmonary emphysema. 18
(4):720–30.
Mahmoodi, S. and Gunn, S. (2011). Snake based unsuper-
vised texture segmentation using Gaussian Markov
random field models. In Proc. 18th IEEE Int’l Conf.
Image Processing, pages 1–4.
Manjunath, B. S. and Chellappa, R. (1991). Unsuper-
vised texture segmentation using Markov random
field models. IEEE Trans. on pattern analysis and
machine intelligence, 13(5):478–482.
Mishima, M., T. Hirai, H. I., Nakano, Y., Sakai, H., Muro,
S., Nishimura, K., Oku, Y., Chin, K., Ohi, M., Naka-
mura, T., Bates, J. H. T., Alencar, A. M., and Suki,
B. L. (1999). Complexity of terminal airspace ge-
ometry assessed by lung computed tomography in
normal subjects and patients with chronic obstructive
pulmonary disease. In Proceedings of the National
Academy of Sciences, volume 96, pages 8829–8834.
Muller, N., Staples, C., and R. Miller, R. A. (1988). Density
mask, an objective method to quantitate emphysema
using computed tomography. 94:782–787.
Ojala, T., Pietikainen, M., and Maenpaa, T. (2002). Mul-
tiresolution gray-scale and rotation invariant texture
classification with local binary patterns. IEEE Trans.
on pattern analysis and machine intelligence, 24:971–
987.
Petrou, M. and Sevilla, P. G. (2006). Image Processing,
Dealing with Texture. John Wiley & Sons Ltd.
Rue, H. and Held, L. (2005). Gaussian Markov Ran-
dom Fields; Theory and Applications. Chapman &
Hall/CRC.
Sluimer, I. C., Waes, P. F., Viergever, M., and Ginneken, B.
(2003). Computer-aided diagnosis in high resolution
CT of the lungs. 30:3081.
Sørensen, L., Shaker, S. B., and de Bruijne, M. (2010).
Quantitative analysis of pulmonary emphysema using
local binary patterns. IEEE Transactions on Medical
Imaging, 29(2):559–569.
Sørensen, L., Shaker, S. B., and de Bruijne, M. (2013).
Computed Tomography Emphysema Database.
http://image.diku.dk/emphysema database/.
Sprawls, P. (1995). The Physical Principles of Medical
Imaging. Medical Physics Publishing, USA, 2nd edi-
tion.
Uppaluri, R., Hoffman, E., M.Sonka, Hartley, P. G.,
W.Hunninghake, G., and McLennan, G. (1999). Com-
puter recognition of regional lung disease patterns.
160 (2):648–54.
Vasconcelos, V., Silva, J. S., Marques, L., and Barroso,
J. (2010). Statistical textural features for classifica-
tion of lung emphysema in CT images: A compara-
tive study. In Information Systems and Technologies
(CISTI), pages 1–5. IEEE.
Xu, Y., Sonka, M., McLennan, G., Guo, J., and Hoffman,
E. A. (2006). MDCT-based 3-D texture classifica-
tion of emphysema and early smoking related lung
pathologies. 156 (1):25.
Zhao, Y., Zhang, L., Li, P., and Huang, B. (2007). Classi-
fication of high spatial resolution imagery using im-
proved Gaussian Markov random-field-based texture
features. IEEE Trans. on Geoscience and Remote
Sensing, 45(5):1458–1468.
QuantitativeAnalysisofPulmonaryEmphysemausingIsotropicGaussianMarkovRandomFields
53
