
Constructing Facial Expression Log from Video Sequences using
Face Quality Assessment
Mohammad A. Haque, Kamal Nasrollahi and Thomas B. Moeslund
Visual Analysis of People Laboratory, Aalborg University (AAU),
Sofiendalsvej 11, 9200 Aalborg, Denmark
Keywords: Facial Expression Log, Face Quality Assessment, Automatic Face Detection and Processing, Facial
Expression Recognition.
Abstract: Facial expression logs from long video sequences effectively provide the opportunity to analyse facial
expression changes for medical diagnosis, behaviour analysis, and smart home management. Generating
facial expression log involves expression recognition from each frame of a video. However, expression
recognition performance greatly depends on the quality of the face image in the video. When a facial video
is captured, it can be subjected to problems like low resolution, pose variation, low brightness, and motion
blur. Thus, this paper proposes a system for constructing facial expression log by employing a face quality
assessment method and investigates its influence on the representations of facial expression logs of long
video sequences. A framework is defined to incorporate face quality assessment with facial expression
recognition and logging system. While assessing the face quality a face-completeness metric is used along
with some other state-of-the-art metrics. Instead of discarding all of the low quality faces from a video
sequence, a windowing approach has been applied to select best quality faces in regular intervals.
Experimental results show a good agreement between the expression logs generated from all face frames
and the expression logs generated by selecting best faces in regular intervals.
1 INTRODUCTION
Facial analysis systems now-a-days have been
employed in many applications including
surveillance, medical diagnosis, biometrics,
expression recognition and social cue analysis
(Cheng et al.,, 2012). Among these, expression
recognition received remarkable attention in last few
decades after an early attempt to automatically
analyse facial expressions by (Suwa, 1978).
In general, human facial expression can express
emotion, intension, cognitive processes, pain level,
and other inter- or intrapersonal meanings (Tian,
2011). For example, Figure 1 depicts five emotion-
specified facial expressions (neutral, anger, happy,
surprise, and sad) of a person’s image from a
database of (Kanade, 2000). When facial expression
conveys emotion and cognitive processes, facial
expression recognition and analysis systems find
their applications in medical diagnosis for diseases
like delirium and dementia, social behaviour
analysis in meeting rooms, offices or classrooms,
and smart home management (Bonner, 2008, Busso,
2007, Dong, 2010, Doody, 2013, Russell, 1987).
However these applications often require analysis of
facial expressions acquired from videos in a long
time-span. A facial expression log from long video
sequences can effectively provide this opportunity to
analyse facial expression changes in a long time-
span. Examples of facial expression logs for four
basic expressions found in an example video
sequence are shown in Figure 2, where facial
expression intensities (0-100), assessed by an
expression recognition system, are plotted against
the video sequence acquired from a camera.
Figure 1: Five emotion-specified facial expressions for the
database of (Kanade, 2000): (left to right) neutral, anger,
happy, surprise, and sad.
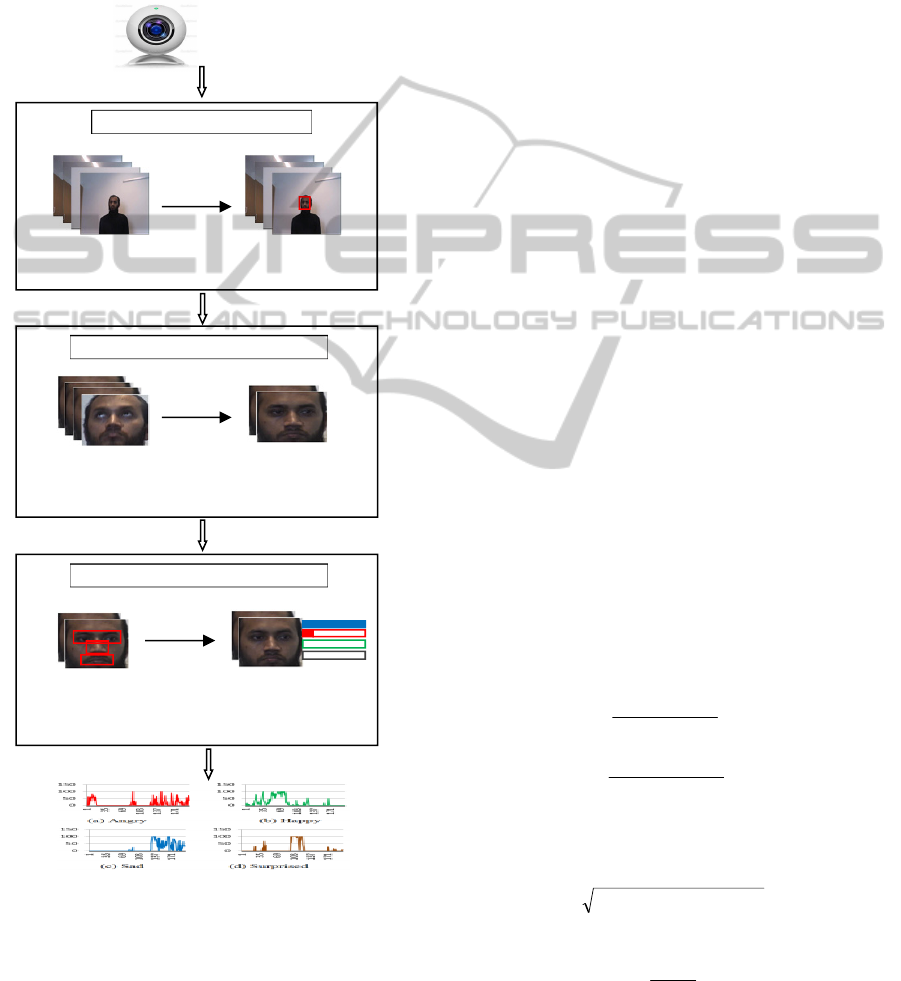
Recognition of facial expressions from the
frames of a video is essentially the primary step of
generating facial expression log. As shown in Figure
3, a typical facial expression recognition system
517
A. Haque M., Nasrollahi K. and B. Moeslund T..
Constructing Facial Expression Log from Video Sequences using Face Quality Assessment.
DOI: 10.5220/0004730105170525
In Proceedings of the 9th International Conference on Computer Vision Theory and Applications (VISAPP-2014), pages 517-525
ISBN: 978-989-758-004-8
Copyright
c
2014 SCITEPRESS (Science and Technology Publications, Lda.)
from video consists of three steps: face acquisition,
feature mining, and expression recognition. Face
acquisition step find the face from video frames by a
face detector or tracker. Feature mining step extracts
geometric and appearance based features from the
face. The last step, i.e., expression recognition
employs learned classifiers based on the extracted
features and recognizes expressions.
(a) Angry (b) Happy
(c) Sad (d) Surprised
Figure 2: An illustration of facial expression log for four
basic expressions found in a video, where vertical axis
presents the intensities of expression corresponding to the
sequence in the horizontal axis.
Figure 3: Steps of a typical facial expression recognition
system.
Generating facial expression log from a video
sequence involves expression recognition from each
frame of the video. However, when a video based
practical image acquisition system captures facial
image in each frame, many of these images are
subjected to the problems of low resolution, pose
variation, low brightness, and motion blur (Fang et
al., 2008). In fact, most of these low quality images
rarely meet the minimum requirements for facial
landmark or expression action unit identification.
For example, a face region with size 96x128 pixels
or 69x93 pixels can be used for expression
recognition. However, a face region with size 48x64
pixels, 24x32 pixels, or less is not likely to be used
for expression recognition (Tian, 2011). This state of
affairs can often be observed in scenarios where
facial expression log is used from a patient’s video
for medical diagnosis, or from classroom video for
social cue analysis. Extracting features for
expression recognition from a low quality face
image often ends up with erroneous outcome and
wastage of valuable computation resource.
In order to get rid of the problem of low quality
facial image processing, a face quality assessment
technique can be employed to select the qualified
faces from a video. As shown in Figure 4, a typical
face quality assessment method consists of three
steps: video frame acquisition, face detection in the
video frames using a face detector or tracker, face
quality assessment by measuring face quality
metrics (Mohammad, 2013). Face quality
assessment in video before further application
reduces significant amount of disqualified faces and
keeps the best faces for subsequent processing.
Thus, in this paper, we propose a facial expression
log construction system by employing face quality
assessment and investigate the influence of Face
Quality Assessment (FQA) on the representation of
facial expression logs of long video sequences.
Figure 4: Steps of a typical facial image acquisition
system with face quality measure.
The rest of the paper is organized as follows:
Section 2 presents the state-of-the-art and Section 3
describes the proposed approach. Section 4 states the
experimental environment and results. Section 5
concludes the paper.
2 STATE-OF-THE-ARTS
The first step of facial expression recognition is
facial image acquisition, which is accomplished by
employing a face detector or tracker. Real-time face
detection from video was a very difficult problem
before the introduction of Haar-like feature based
Viola and Jones object detection framework (Viola,
2001). Lee et al. and Ahmed et al. proposed two face
detection methods based on saliency map (Lee,
2011, Ahmad, 2012). However, these methods,
including the Viola and Jones one, merely work real-
time for low resolution images. Thus, few methods
0
50
100
150
1
35
69
103
137
171
0
50
100
150
1
35
69
103
137
171
0
50
100
150
1
35
69
103
137
171
0
50
100
150
1
35
69
103
137
171
Face acquisition
from video
Feature
mining
Expression
Recognition
Further
Processing
Images from
Video Frames
Face Detection
from the Frames
Face Quality Assessment
and Selecting Best Faces
VISAPP2014-InternationalConferenceonComputerVisionTheoryandApplications
518

address the issues of high resolution face image
acquisition by employing high resolution camera or
pan-tilt-zoom camera (Cheng et al., 2012, Dinh,
2011). On the other hand, some methods addressed
the problem by speeding up the face detection
procedure in a high resolution image (Mustafa,
2007, 2009). When a face is detected in a video
frame, instead of detecting the face in further frames
of that video clip, it can be tracked. Methods for
tracking face in video frames from still cameras and
active pan-tilt-zoom cameras are proposed in
(Corcoran, 2007) and (Dhillon, 2009, and Dinh,
2009), respectively.
A number of methods proposed for face quality
assessment and/or face logging. Nasrollahi et al.
proposed a face quality assessment system in video
sequences by using four quality metrics: resolution,
brightness, sharpness, and pose (Nasrollahi, 2008).
Mohammad et al. utilized face quality assessment
while capturing video sequences from an active pan-
tilt-zoom camera (Mohammad, 2013). In (Axnick,
2009, Wong, 2011), two face quality assessment
methods have been proposed in order to improve
face recognition performance. Instead of using
threshold based quality metrics, (Axnick, 2009) used
a multi-layer perceptron neural network with a face
recognition method and a training database. The
neural network learns effective face features from
the training database and checks these features from
the experimental faces to detect qualified candidates
for face recognition. On the other hand, Wong et al.
used a multi-step procedure with some probabilistic
features to detect qualified faces (Wong, 2011).
Nasrollahi et al. explicitly addressed posterity facial
logging problem by building sequences of increasing
quality face images from a video sequence
(Nasrollahi, 2009). They employed a method which
uses a fuzzy combination of primitive quality
measures instead of a linear combination. This
method was further improved in (Bagdanov, 2012)
by incorporating multi-target tracking capability
along with a multi-pose face detection method.
A number of complete facial expression
recognition methods have been proposed in the
literature. Most of the methods, however, merely
attempt to recognize few most frequently occurred
expressions such as angry, sad, happy, and surprise
(Tian, 2011). In order to recognize facial
expressions, some methods merely used geometric
features (Cohn, 2009), some methods merely used
appearance features (Bartlett et al., 2006), and some
methods used both (Wen, 2003). While classifying
the expressions from the extracted features, most of
the well-known classifiers have been tested in the
literature. These include neural network (NN),
support vector machines (SVM), linear discriminant
analysis (LDA), K-nearest neighbour (KNN), and
hidden Markov models (HMM) (Tian, 2011).
3 THE PROPOSED APPROACH
A typical facial expression logging system from
video consists of four steps: face acquisition, feature
mining, expression recognition, and log
construction. On the other hand, a typical FQA
method in video consists of three steps: video frame
acquisition, face detection in the video frames using
a face detector or tracker, FQA by measuring face
quality metrics. However, as discussed in Section 1,
the performance of feature mining and expression
recognition highly depends on the quality of the face
region in video frames. Thus, in this paper, we
proposed an approach to combine a face quality
assessment method with a facial expression logging
system. The overall idea of combining these two
approaches into one is depicted in Figure 5. Before
passing the face region of video frames to the feature
extraction module, the FQA module discards the
non-qualified faces. The architecture of the proposed
system is depicted in Figure 6 and described in the
following subsections.
Figure 5: Face quality is assessed before feature extraction
is attempted for expression recognition.
3.1 Face Detection Module
This module is responsible to detect face in the
image frames. The well-known Viola and Jones face
detection approach has been employed from (Viola,
2001). This method utilizes so called Haar-like
features in a linear combination of some weak
classifiers to form a strong classifier to perform a
face and non-face classification by using an adaptive
boosting method. In order to speed up the detection
process an evolutionary pruning method from (Jun-
Su, 2008) is employed to form strong classifiers
using fewer classifiers. In the implementation of this
article, the face detector was empirically configured
using the following constants:
Minimum search window size: 40x40 pixels
Face
detection
Feature
extraction
Expression
recognition
Face quality
assessment
ConstructingFacialExpressionLogfromVideoSequencesusingFaceQualityAssessment
519
in the initial camera frames
The scale change step: 10% per iteration
Merging factor: 2 overlapping detections
The face detection module continuously runs and
tries to detect face in the video frames. Once a face
is detected, it is passed to the Face Quality
Assessment (FQA) module.
Figure 6: The block diagram of the proposed facial
expression log construction system with face quality
assessment.
3.2 Face Quality Assessment Module
FQA module is responsible to assess the quality of
the extracted faces. Four parameters that can
effectively determine the face quality have been
selected in (Nasrollahi, 2008) for surveillance
applications. These parameters are: out-of-plan face
rotation (pose), sharpness, brightness, and
resolution. All these metrics have remarkable
influence in expression recognition. However, the
difference between a typical surveillance application
and an expression logging system entails exploration
of some other face quality metrics. For example,
face completeness can be an important measure for
face quality assessment before expression
recognition. This is because features for expression
recognition are extracted from different components
of a face, more specifically from eyes and mouth. If
a facial image doesn’t clearly contain these
components, it is difficult to measure expressions.
Thus, we calculate a face completeness parameter,
along with four other parameters from (Nasrollah,
2008), by detecting the presence of the eyes and the
mouth in a facial image. A normalized score is
obtained in the range of [0:1] for each quality
parameter and a linear combination of scores has
been utilized to generate single score.
The basic calculation process of some FQA
parameters is described in (Mohammad, 2013). We,
however, include a short description below for the
readers’ interest by incorporating necessary changes
to fit these mathematical models with the
requirement of constructing facial expression log.
Pose estimation - Least out-of-plan rotated face:
The face ROI (Region of Interest) is first
converted into a binary image and the center of
mass is calculated using:
A
jiib
x
n
i
m
j
m
,
11
(1)
A
jijb
y
n
i
m
j
m
,
11
(2)
Then, the geometric center of face region is
detected and the distance between the center of
region and the center of mass is calculated by:
22
)()(
mcmc
yyxxDist
(3)
Finally the normalized score is calculated by:
Dist
Dist
P
Th
Pose
(4)
Where
mm
yx ,
is the center of mass, b is the
Frames from
Camera
Face Detection from
the Frames
Face Detection
Extracted Faces from the
Tracked Area
Selecting & Storing
Best Faces after FQA
Face Qualit
y
Assessment
(
FQA
)
Feature extraction from
the qualified faces
Expression recognition
using extracted features
Facial Ex
p
ression Reco
g
nition
Facial expression log
Camera capture
VISAPP2014-InternationalConferenceonComputerVisionTheoryandApplications
520

binary face image, m is the width, n is the
height, A is the area of the image, x
1
, x
2
and y
1
, y
2
are the boundary coordinates of the face, and
Dist
Th
is an empirical threshold used in
(Mohammad, 2013).
Sharpness: Sharpness of a face image can be
affected by motion blur or an unfocused capture.
This can be measured by:
yxlowAyxAabsSharp ,,
(5)
Sharpness’s associated score is calculated by:
Th
Sharp
Sharp
Sharp
P
(6)
Where, lowA(x,y) is the low-pass filtered
counterpart of the image A(x,y), and Sharp
Th
is an
empirical threshold used in (Mohammad, 2013).
Brightness: This parameter measures whether a
face image is too dark to use. It is calculated by
the average value of the illumination component
of all pixels in an image. Thus, the brightness of
a frame is calculated by (6), where I(i,j) is the
intensity of pixels in the face image.
nm
jiI
Bright
n
i
m
j
*
,
11
(7)
Brightness’s associated score is calculated by:
Th
Bright
Bright
Bright
P
(8)
Where, Bright
Th
is an empirical threshold used in
(Mohammad, 2013).
Image size or resolution: Depending upon the
application, face images with higher resolution
may yield better results than lower resolution
faces (Axnick, 2009, Long, 2011). The score for
image resolution is calculated by (10), where w is
image width, h is image height, Width
th
and
Height
th
are two thresholds for expected face
height and width, respectively. From the study of
(Nasrollahi, 2008), we selected the values of the
thresholds 50 and 60, respectively.
thth
Size
Height
h
Width
w
P ,1min
(9)
Face completeness: This parameter measures
whether the key face components for expression
recognition can be detected automatically from
the face. In this study, we selected eyes and
mouth region as the key components of face and
obtain the score using the following rule:
leidentifiabarecomponentsif
leidentifiabnotarecomponentsifssCompletene
P
,1
,0
(10)
The final single score for each face is calculated by
linearly combining the abovementioned 5 quality
parameters with empirically assigned weight factor,
as shown in (10):
4
1
4
1
i
i
i
ii
Score
w
Pw
Quality
(11)
Where, w
i
are the weight associated with P
i
, and
P
i
are the score values for the parameters pose,
sharpness, brightness, resolution, and completeness
consecutively. Finally, the best quality faces are
selected by observing the Quality
Score
. The detail
procedure of selection the best faces for expression
logging is described in the following section.
3.3 Facial Expression Recognition and
Logging
This module recognizes facial expressions from
consecutive video frames and plots the expression
intensities against time in separate graphs for
different expressions. In this paper, we use an off-
the-shelf expression recognition technique from
(Kublbeck, 2006), which is implemented in SHORE
library (Fraunhofer IIS, 2013). An appearance based
modified census transformation is used in this
method for face detection and expression intensity
measurement. In fact, the eye-region, nose-region
and mouth region represent the expression variation
in face appearance, as shown in Figure 6. Changes in
patterns of these regions are obtained by employing
the transformation. Four frequently occurred
expressions are measured by this system: angry,
happy, sad, and surprize.
The next step after expression recognition is the
construction of facial expression log. Four graphs
are created for four expressions from a video
sequence. As generating expression log from the
faces of consecutive frames of a video suffers
significantly due to erroneous expression recognition
from low quality faces from the video frames,
generating log by merely using the high quality
faces can be a solution. However, discarding low
quality face frames from video generate
discontinuity in the expression log, especially if a
large number of consecutive face frames contain low
quality face. Thus, we employed a windowing
approach in order to ensure continuity of the
expression log while assuring an acceptable
similarity with the expression log from all faces and
expression log from qualified faces. The approach
works by selecting the best face among n
consecutive faces, where n is the window size
indicating the number of video frames in each
ConstructingFacialExpressionLogfromVideoSequencesusingFaceQualityAssessment
521

window. When plotting the expression intensities
into the corresponding graphs of the expressions,
instead of plotting values for all face frames, the
proposed approach merely plots the value for the
best face frame in each window. The effect of
discarding the expression intensity score for other
frames of the window is shown in the experimental
result section.
4 EXPERIMENTAL RESULTS
4.1 Experimental Environment
The underlying algorithms of the experimental
system were implemented in a combination of
Visual C++ and Matlab environments. As the
existing online datasets merely contain images or
videos of good quality faces rather than mixing of
good and bad quality faces, to evaluate the
performance of the proposed approach we recorded
several video sequences from different subjects by
using a camera setup. Faces were extracted from the
frames of 8 experimental video clips (named as, Sq1,
Sq2, Sq3, Sq4, Sq5, Sq6, Sq7, and Sq8) having 1671
video frames, out of which 950 frames contain
detectable faces with different facial expressions.
Face quality assessment and expression
recognition were performed to generate the results.
Four basic expressions were used for recognition:
happy, angry, sad, and surprise. Two types of facial
expression logs were generated: first type shows the
facial expression intensities of each face frames of
video (Type1), and the other type shows the facial
expression intensities of the best faces in each
consecutive window with n-frames of the video
(Type2). In order to compare Type1 and Type2
representations, we calculate normalized maximum
cross-correlation magnitudes of both graphs for each
expression (Briechle, 2001). Higher magnitude
implies more similarity between the graphs.
4.2 Performance Evaluation
The experimental video clips were passed through
the face detection module and face quality metrics
were calculated after detecting faces. As an example,
Figure 7 shows the Quality
Score
for each face frames
of the video sequence Sq1, where the score is plotted
against the video frame index. From the figure it is
observed that some of the faces may exhibit poor
quality score as low as 40%. If these low quality
faces are sent to the expression recognition module
the recognition performance will be significantly
suffered.
Figure 7: Face quality score calculated by the FQA
module for 200 face frame of experimental video sequence
Sq1.
Facial expression recognition module measures
the intensity of each facial expression for each face
of the frames of a video, and then facial expression
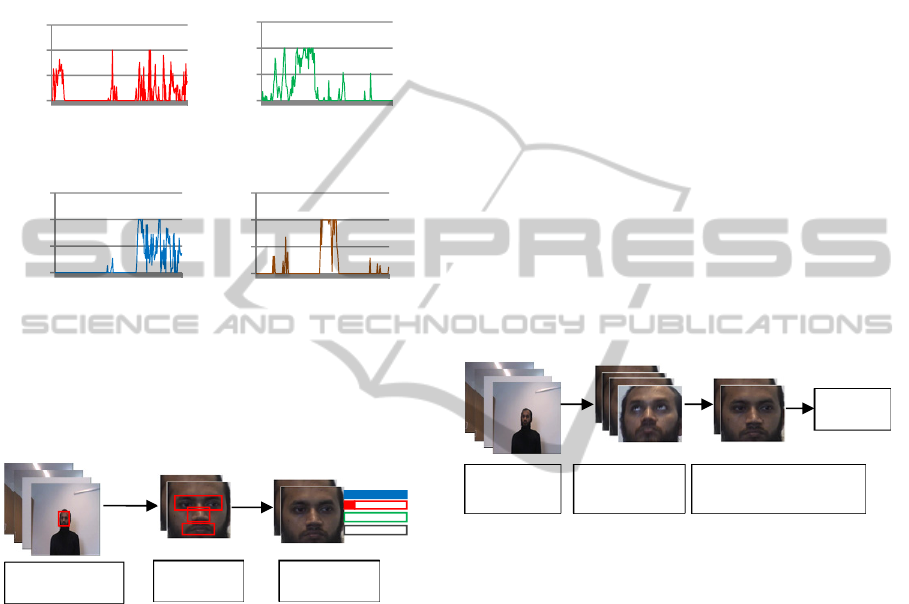
logs were generated. Figure 8 illustrates two types of
expression logs for the experimental video sequence
Sq1, where the window size n was set to 3 for
selecting best faces. The graphs at the left of each
rows of Figure 8 present the Type1 graph and the
graphs at the right presents corresponding Type2
graph. When we visually analysed and compared
Type1 and Type2 graphs, we observed temporal
similarity between these two facial expression logs
from the same video sequence due to the application
of windowing approach.
In order to formalize this observation, we
showed a normalized maximum cross-correlation
magnitude similarity measure between these two
representations of the video sequences for all four
expressions by varying the window size n. The
results are summarized in Table 1 and Table 2 for
window sizes 3 and 5, respectively. From the results,
it is observed that discarding more faces decreases
similarity between Type1 and Type2 graphs. For
some sequences, changing the window size doesn’t
have much effect for some expression modalities.
This is due to non-variable expression in these video
sequences. However, in order to keep agreement
with other modalities, the window size should be
kept same. For example, in Sq3 the results for the
expressions of happiness, sadness and surprise aren’t
affected much by the change of window size.
Moreover, some expression exhibited very high
0
0,1
0,2
0,3
0,4
0,5
0,6
0,7
0,8
0,9
1
13
25
37
49
61
73
85
97
109
121
133
145
157
169
181
193
VISAPP2014-InternationalConferenceonComputerVisionTheoryandApplications
522

dissimilarity even for a very small window size. This
is because the expression in that video sequence
changed very rapidly, and thus discarding face frame
discards expression intensity values too. On the
other hand, discarding more faces by setting a higher
window size reduces the computational power
consumption geometrically. Thus, the window size
should be defined depending upon the application
the expression log is going to be used.
a) Happy
b) Angry
c) Sad
d) Surprise
Figure 8: Facial expression log for the experimental video
sequence Sq1 (the left graphs are from all face frames, and
the right graphs are from selected best quality face frame
by the windowing method with 3-frames per window).
5 CONCLUSIONS
This paper proposed a facial expression log
construction system by employing face quality
assessment and investigated the influence of face
quality assessment on the representation of facial
expression logs of long video sequences. A step by
step procedure was defined to incorporate face
quality assessment with facial expression
recognition system and finally the facial expression
logs were generated. Instead of discarding all of the
low quality faces, a windowing approach was
applied to select best quality faces in a regular
interval. Experimental results shows a good
agreement between expression logs generated from
all face frames and expression logs generated by
selecting best faces in a regular interval.
Table 1: Similarity between Type1 and Type2 graphs,
when window size is 3 (higher value implies more
similarity).
Angry Happy Sad Surprise Average
Sq1 0.60 0.94 0.80 0.90 0.81
Sq2 0.81 0.97 1.00 0.77 0.89
Sq3 0.70 0.99 1.00 1.00 0.92
Sq4 0.52 0.97 1.00 1.00 0.87
Sq5 0.62 0.99 1.00 1.00 0.90
Average similarity for n=3 0.88
Table 2: Similarity between Type1 and Type2 graphs,
when window size is 5 (higher value implies more
similarity).
Angry Happy Sad Surprise Average
Sq1 0.31 0.54 0.49 0.53 0.47
Sq2 0.44 0.50 1.00 0.46 0.60
Sq3 0.57 1.00 1.00 1.00 0.89
Sq4 1.00 0.46 1.00 1.00 0.86
Sq5 1.00 0.46 1.00 1.00 0.86
Average similarity for n=5 0.73
As the future works, we will analyse the face
quality assessment metrics individually and their
impact on facial expression recognition. In the
construction of facial expression log, a formal model
needs to define by addressing the questions such as
how to address discontinuity of face frame while
making the log, how to improve face quality
assessment, how to select optimum window size for
discarding non-qualified face frames, how to include
motion information for missing face frames while
generating face log.
0
50
100
150
1
35
69
103
137
171
0
50
100
150
1 10192837465564
0
50
100
150
1
35
69
103
137
171
0
50
100
150
1 10192837465564
0
50
100
150
1
35
69
103
137
171
0
50
100
150
1 10192837465564
0
50
100
150
1
30
59
88
117
146
175
0
50
100
150
1 10192837465564
ConstructingFacialExpressionLogfromVideoSequencesusingFaceQualityAssessment
523

REFERENCES
Ahmed, E. L., Rara, H., Farag, A., and Womble, P., 2012.
“Face Detection at a distance using saliency maps,”
IEEE Conf. on Computer Vision and Pattern
Recogntion Workshops, pp. 31-36.
Axnick, K., Jarvis, R., and Ng, K. C., 2009. “Using Face
Quality Ratings to Improve Real-Time Face
Recognition,” Proc. of the 3
rd
Pacific Rim Symposium
on Advances in Image and Video Technology, pp. 13-
24.
Bagdanov, A. D., and Bimbo, A. D., 2012. “Posterity
Logging of Face Imagery for Video Surveillance,”
IEEE MultiMedia, vol. 19, no. 4, pp. 48-59.
Bartlett, M., Littlewort, G., Frank, M., Lainscsek, C.,
Fasel, I., and Movellan, J., 2006. “Fully Automatic
Facial Action Recognition in Spontaneous Behavior,”
7
th
Int. COnf. on Automatic Face and Gesture
Recogntion, pp. 223-230.
Bonner, M. J. et al., 2008. “Social Functioning and Facial
Expression Recognition in Survivors of Pediatric
Brain Tumors”, Journal of Pediatric Psychology, vol.
33, no. 10, pp. 1142-1152, 2008.
Briechle, K., and Hanebeck, U. D., 2001. “Template
Matching using Fast Normalized Cross Correlation,”
Proc. of SPIE Aero Sense Symposium, vol. 43-87, pp.
1-8.
Busso, C., Narayanan, S. S., 2007. “Interrelation between
Speech and Facial Gestures in Emotional Utterances:
A single subject study”, IEEE Trans. On Audio,
Speech and Language Processing, pp. 1-16.
Cheng, X., Lakemond, R., Fookes, C., and Sridharan, S.,
2012. “Efficient Real-Time Face Detection For High
Resolution Surveillance Applications,” Proc. Of the
6
th
Int. Conf. on Signal Processing and
Communication Systems, pp.1-6.
Cohn, J., Kreuz, T., Yang, Y., Nguyen, M., Padilla, M.,
Zhou, F., and Fernando, D., 2009, “Detecting
depression from facial action and vocal prosody,”
Proc. of the Int. Conf. on Affective Computing and
Intelligent Interaction.
Corcoran, P., Steingerg, E., Bigioi, P., and Brimbarean,
A., 2007. “Real-Time Face Tracking in a Digital
Image Acquisition Device,” European Patent No. EP
2 052 349 B1, pp. 25.
Dhillon, P. S., 2009. “Robust Real-Time Face Tracking
Using an Active Camera,” Advances in Intellignet and
Soft Computing: Computational Intelligences in
Security for Information Systems, vol. 63, pp. 179-186.
Dinh, T., Yu, Q., and Medioni, G., 2009. “Real Time
Tracking using an Active Pan-Tilt-Zoom network
Camera,” Proc. of the Int. Conf. on Intelligent Robots
and Systems, pp. 3786-3793.
Dinh, T. B., Vo, N., and Medioni, G., 2011. “High
Resolution Face Sequences from a PTZ Network
Camera,” Proc. of the IEEE Int. Conf. on Automatic
Face & Gesture Recognition and Workshops, pp. 531-
538.
Dong, G., and Lu, S., 2010. “The relation of expression
recognition and affective experience in facial
expression processing: an event-related potential
study,” Psychology Research and Behavior
Management, vol. 3, pp. 65-74.
Doody, R. S., Stevens, J. C., Beck, C., et al. 2013,
“Practice parameter: Management of dementia (an
evidence-based review): Report of the quality
standards subcommittee of the American Academy of
Neurology,” Neurology, pp. 1-15.
Fang, S. et al., 2008. “Automated Diagnosis of Fetal
Alcohol Syndrome Using 3D Facial Image Analysis,”
Orthodontics & Craniofacial Research, vol. 11, no. 3,
pp. 162-171.
Fraunhofer IIS, 2013. “Sophisticated High-speed Object
Recognition Engine,” www.iis.fraunhofer.de/shore.
Jun-Su, J., and Jong-Hwan, K., “Fast and Robust face
Detection using Evolutionary Prunning,” IEEE Trans.
On Evolutionary Computation, vol. 12, no. 5, pp. 562-
571, 2008.
Kanade, T., Cohn, J., Tian, Y. L., 2000. “Comprehensive
database for facial expression analysis,” Proc. of the
Int. Conf. on Face and Gesture Recognition, pp. 46-
53.
Kublbeck, C., and Ernst, A., 2006. “Face detection and
tracking in video sequences using the modified census
transformation,” Image and Vision Computing, vol.
24, no. 6, pp. 564-572.
Lee, Y. B., and Lee, S., 2011. “Robust Face Detection
Based on Knowledge Directed Specification of
Bottom-Up Saliency,” ETRI Journal, vol. 33, no. 4,
pp. 600-610.
Mohammad, A. H., Nasrollahi, K., and Moeslund, T. B.,
2013. “Real-Time Acquisition of High Quality Face
Sequences From an Active Pan-Tilt-Zoom Camera,”
Proc. of the Int. Conf. on Advanced Video and
Surveillance Systems, pp. 1-6.
Mustafah, Y. M., Shan, T., Azman, A. W., Bigdeli, A.,
and Lovell, B. C., 2007. “Real-Time Face Detection
and Tracking for High Resolution Smart Camera
System,” Proc. Of the 9
th
Biennial Conf. on Digital
Image Computing Techniques and Applications, pp.
387-393.
Mustafah, Y. M., Bigdeli, A., Azman, A. W., and Lovell,
B. C., 2009. “Face Detection System Design for Real-
Time High Resolution Smart Camera,” Proc. Of the
3
rd
ACM/IEEE Int. Conf. on Distributed Smart
Cameras, pp. 1-6.
Nasrollahi, K., and Moeslund, T. B., 2008. “Face Quality
Assessment System in Video Sequences,” 1
st
European Workshop on Biometrics and Identity
Management, Springer-LNCS, vol. 5372, pp. 10-18.
Nasrollahi, K., and Moeslund, T. B., 2009. “Complete face
logs for video sequences using face quality measures,”
IET Signal Porcessing, vol. 3, no. 4. Pp. 289-300, DOI
10.1049/iet-spr.2008.0172.
Russell, A. J., and Fehr, B., 1987, “Relativity in the
Perception of Emotion in Facial Expressions” Journal
of Experimental Psychology, vol. 116, no.3, pp. 223-
237.
Suwa, M., Sugie, N., and Fujimora, K., 1978. “A
preliminary note on pattern recognition of human
VISAPP2014-InternationalConferenceonComputerVisionTheoryandApplications
524

emotional expression,” Proc. of the Int. Joint Conf. on
Pattern Recognition, pp. 408-410.
Tian, Y., Kanade, T., and Cohn, J. F., 2011. “Facial
Experssion Recognition,” Handbook of Face
Recognition, Chapter 19, pp. 487-519.
Viola, P., and Jones, M., 2001 “Robust real-time face
detection,” Proc. Of the 8
th
IEEE Int. Conf. on
Computer Vision, pp. 747.
Wen, Z., and Huang, T., 2003. “Capturing subtle facial
motions in 3D face tracking,” Proc. of the Int. Conf.
on Computer Vision.
Wong, Y., Chen, S., Mau, S., Sanderson, C., and Lovell,
B. C., 2011. “Patch-based Probabilistic Image Quality
Assessment for Face Selection and Improved Video-
based Face Recognition,” Proc. of the IEEE Conf. on
Computer Vision and Pattern Recognition Workshops,
pp. 74-81.
ConstructingFacialExpressionLogfromVideoSequencesusingFaceQualityAssessment
525
