
Interfacing Assessment using Facial Expression Recognition
Rune A. Andersen, Kamal Nasrollahi, Thomas B. Moeslund and Mohammad A. Haque
Visual Analysis of People Laboratory, Aalborg University, Sofiendalsvej 11, 9200 Aalborg, Denmark
Keywords:
Facial Expression Recognition, Interfacing Technologies, Motion Controlled, Gamepad.
Abstract:
One of the most important issues in gaming is deciding about the employed interfacing technology. Gamepad
has traditionally been a popular interfacing technology for the gaming industry, but, recently motion controlled
interfacing has been used widely in this industry. This is exactly the purpose of this paper to study whether
the motion controlled interface is a feasible alternative to the gamepad, when evaluated from a user experience
point of view. To do so, a custom game has been developed and 25 test subjects have been asked to play
the game using both types of interfaces. To evaluate the users experiences during the game, their hedonic
and pragmatic quality are assessed using both subjective and objective evaluation methods in order to cross-
validate the obtained results. An application of computer vision, facial expression recognition, has been used
as a non-obtrusive objective and hedonic measure. While, the score obtained by the user during the game
has been used as a pragmatic quality measure. The use of facial expression recognition has, to the best of
our knowledge, not been used before to assess the hedonic quality of interfaces for games. The thorough
experimental results show that the user experience of the motion controlled interface is significantly better
than the gamepad interface, both in terms of hedonic and pragmatic quality. The facial expression recognition
system proved to be a useful non-obtrusive way to objectively evaluate the hedonic quality of the interfacing
technologies.
1 INTRODUCTION
Evaluating the user experience in interactive systems,
similar to many other systems, is of crucial impor-
tance. This can, for example, provide very help-
ful feedbacks for further improvement of such sys-
tems. One of the key issues in developing an interac-
tive system, like a game, is deciding about the inter-
facing technology that the game is going to provide
to its users. For the gaming purposes, traditionally
gamepad interfacing technology has been around for
many years. But, recently motion controlled interfac-
ing has been widely used in many different games.
Can this emerging motion controlled interfacing tech-
nology be considered as a feasible alternative to the
gamepad from the user’s point of view? To answer
this question, we have developed a game based on ki-
netic interaction, which is suitable for multiple inter-
facing technologies, and have asked our test subjects
to play the game once with a gamepad interface and
once with a motion controlled interface. Following
that we have evaluated and compared the users’ expe-
riences in these two different cases.
Before going into any details, we first need to an-
swer this question: How can the user experience be
assessed in interactive systems? Following Hassen-
zahl et al (Hassenzahl et al., 2003)’s theory on the user
experience evaluation, there are two types of quality
measures for such systems, hedonic and pragmatic.
The hedonic quality is concerned with whether the
user has a fun and pleasurable experience. But, the
pragmatic quality considers an extend for which the
user can complete the desired task, e.g., How easy
is the interface to learn and to use? How accurate
is it? For assessing these two types of quality mea-
sures, subjective methods (such as questionnaires and
interviews) and objective quantitative methods (such
as electroencephalography, electromyography, heart-
beat rate, respiratory level) have been used. Objec-
tive quantitative methods are always good as they can
complement/validate results of the subjective meth-
ods. However, there is a problem with the mentioned
quantitative methods for assessing the user experience
in motion controlled gaming applications. For their
measurement, one needs to install a hardware/sensor
on the user’s body. It is obvious that such an instal-
lation restricts the user’s movements in playing the
game. Hence, they are not suitable for assessing the
user experience when a motion controlled interface is
used. To overcome this, beside employing subjective
186
Andersen R., Nasrollahi K., Moeslund T. and Haque M..
Interfacing Assessment using Facial Expression Recognition.
DOI: 10.5220/0004730801860193
In Proceedings of the 9th International Conference on Computer Vision Theory and Applications (VISAPP-2014), pages 186-193
ISBN: 978-989-758-009-3
Copyright
c
2014 SCITEPRESS (Science and Technology Publications, Lda.)

methods (using questionnaires), this paper has pro-
posed a new quantitative measure using facial expres-
sion recognition. To do so, a camera films the test
subjects during playing the game. There is obviously
a distance between the camera and the test subjects,
i.e., the employed sensor does not impose any restric-
tion on the movements of the user and therefore mo-
tion controlled interfaces can be used easily.
To the best of our knowledge, facial expression
recognition has not been used as a quantitative mea-
sure for evaluating game input devices and methods
of interfacing in the gaming context. However, (Tan
et al., 2012) conducted a feasibility study using facial
expression recognition to evaluate user experience in
games, which showed a correct correlation between
gameplay events and the valence of the classified fa-
cial expressions.
The rest of this paper is organized as follows: in
the next section the literature on assessing the user
experience of interfacing technologies in games is re-
viewed, in section 3 the developed game and the cho-
sen devices for both interfacing methods are intro-
duced, the employed measurement factors for assess-
ing the user experience are explained in section 4, the
experiential results are discussed in section 5, and fi-
nally, the paper is concluded in section 6.
2 RELATED WORK
This section provides an overview on existing ap-
proaches on evaluating the effect of input devices on
the user experience in games. In (Natapov et al.,
2009) the user experience of playing a game using
Wii
R
remote and a gamepad are compared. It is
shown that the throughput of the Wii
R
remote is
significantly higher than the gamepad. At the same
time, the error rate of Wii
R
remote is higher than the
gamepad. Despite this, the Wii
R
remote was the pre-
ferred controller for playing games amongst the test
subjects. In (Bateman et al., 2011) the performance
difference of game input devices for steering a car
has been studied, and it is shown that a thumbstick
performs significantly better in terms of game com-
pletion time than a steering wheel and a mouse.
For examining the user experience of different
game input devices, self-determination theory (Deci
and Ryan, 2002) has been commonly used to study
factors that influence motivation. The Player Expe-
rience of Needs Satisfaction (PENS) evaluation in-
strument encompasses evaluation of concepts such as
intrinsic motivation, competence, autonomy, related-
ness, presence and intuitive controls through the use
of questionnaires (Ryan et al., 2006). PENS was used
in a study showing that realistic and tangible mapping
of controllers with game tasks increases the experi-
ence of autonomy and presence, but not competence
(McEwan et al., 2012). PENS has further been used in
(Birk and Mandryk, 2013) with self-discrepancy the-
ory (Higgins, 1987) to study self-perception during
playing of a game, including the effect of extraver-
sion, agreeableness, conscientiousness, neuroticism,
and openness to experience. In this study three in-
put devices, the Kinect
R
, the PlayStation Move
R
and
the gamepad are compared. It is shown that Kinect
R
produces significantly higher positive affect than the
Move and gamepad. Furthermore, Kinect
R
showed
to be more enjoyable than the gamepad. Moreover,
it was shown that Kinect
R
provided higher auton-
omy, relatedness, immersion and agreeableness than
the gamepad, while the gamepad increased the neu-
roticism of the user compared to Kinect
R
.
Regarding the effect of motion control in a collab-
orative multi-user game, (Lindley et al., 2008) shows
that input based on motion increases the engagement
and social interaction in the game. In (Dahlgren and
Lyck, 2011) grounded theory is used to examine the
effect of motion controllers on the gameplay experi-
ence, compared to a gamepad. The interviews showed
that motion controllers can enhance the gameplay,
making the players more immersed, if the control
mapping is sufficiently realistic and natural. Studies
have further shown that interactivity in the form of
natural controller mapping increases spatial presence
(Skalski et al., 2007) and immersion (Pietschmann
et al., 2012), which has been shown to predict enjoy-
ment of games (Shafer et al., 2011). The studies show
that motion controlled input devices that are mapped
naturally can increase spatial presence and immer-
sion, which leads to greater entertainment value, com-
pared to when a gamepad is used.
3 THE DEVELOPED GAME
To evaluate the user experience of the two interfacing
technologies, a game was developed that features a
humanoid avatar, which is controlled by the user. The
avatar needs to be navigated through a game course
using kinetic interaction, while objects are moving to-
wards the user. There are two types of objects; target
objects that need to be hit, and obstacle objects that
need to be dodged. The two types of objects and the
avatar are shown on Figure 1 (top). Every time an ob-
ject is successfully hit or dodged, points are scored.
The purpose of the game is to score as many points as
possible.
As mentioned before, two interfacing methods
InterfacingAssessmentusingFacialExpressionRecognition
187
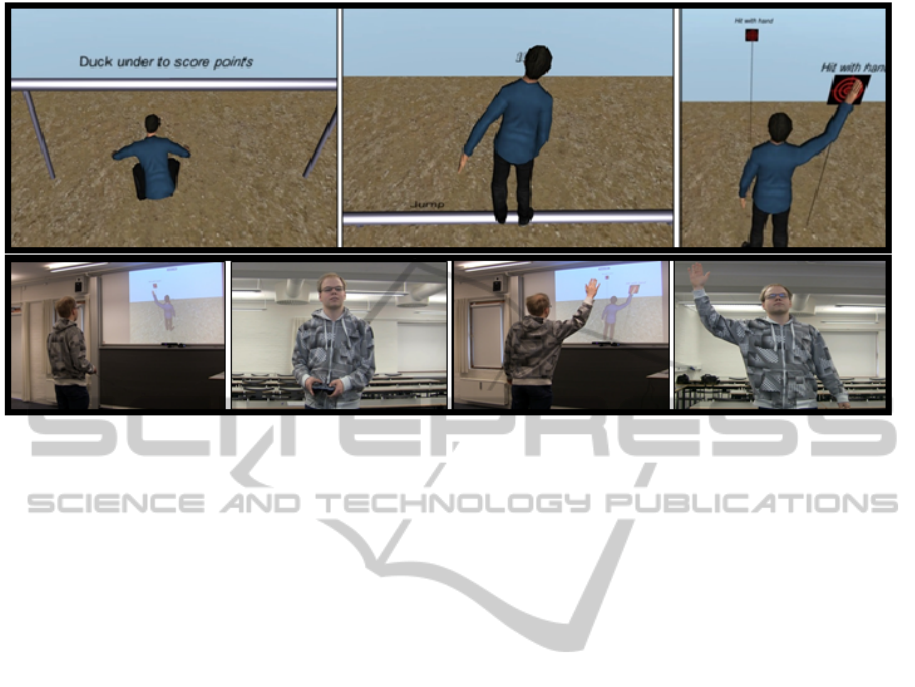
Figure 1: Top: The environment of the game showing the avatar and the two types of objects. The obstacle objects in the
first two images on the left should be dodged (duck under or jump over) and the target object in the right most image should
be hit. Bottom: The player with the gamepad interface (two left images), and with the motion controlled interface (two right
images).
have been used in this paper. One interfacing method
uses the fine motor skills of the hand (gamepad), and
the other one uses gross motor skills of the entire body
(motion controlled). Historically, video games have
employed a gamepad in some form as input device,
where a gamepad is defined as a controller held with
one or two hands, using the fingers to provide input.
As such, the gamepad is the standard interfacing tech-
nology for games. The chosen gamepad input device
in this paper is a Logitech
R
RumblePad 2
R
, because
it is a modern gamepad with features equal to those
found on the current generation of gaming consoles.
The motion controllers that are commercially pop-
ular today as gaming controllers, and thus are candi-
dates for input devices for game developers, fall into
the categories of the hand held device, such as the
Wii remote
R
and the PlayStation Move
R
, and whole-
body tracking devices, such as the Kinect
R
. The
Kinect for Windows
R
is chosen as the input device
for the motion controlled interface. It is selected be-
cause it allows for the widest range of movements of
the user, encompassing both movements of the hands
that the hand held devices also cover, and movements
of the rest of the body. Thus, interfacing through the
Kinect
R
allows a wider range of body movements as
input to the game, compared to a hand held device.
This will enable an interface that fully utilizes mo-
tion of the user’s body as input mechanism, in order
to fully examine the possibilities of motion controlled
gaming.
4 USER EXPERIENCE
ASSESSMENT
For comparing the two different interfacing meth-
ods, using the chosen devices described in the pre-
vious section, both objective and subjective evalua-
tion methods are used in accordance with the princi-
ple of triangulation (Jick, 1979), such that the strength
in one method can compensate for the weakness in
another, leading to a more valid result, without scien-
tific artifacts caused by the use of a single evaluation
method only. The conclusion of this study will there-
fore be cross-validated by comparing the results of the
objective and subjective methods.
The hedonic and pragmatic quality measures are
evaluated subjectively by asking test subjects to
choose the interface they find most entertaining and
easiest to learn to use. The pragmatic quality is fur-
ther evaluated objectively by logging the score of the
game. The easier the interface is to learn and the more
accurate it is, the more points the user will score in the
game, as the user has an easier time hitting and dodg-
ing the game objects. The hedonic quality is further
evaluated objectively by a facial expression analysis
system (Ghijsen, 2004), where the SHORE
R
library
(Fraunhofer IIS, 2013), (Kublbeck and Ernst, 2006)
is used to detect and classify the emotional valence of
the expression of a recognized face in a video stream.
The method is chosen because it is capable of infer-
ring affective states of the user in a non-obtrusive way,
VISAPP2014-InternationalConferenceonComputerVisionTheoryandApplications
188

compared to the more intrusive alternative of facial
electromyography, where the muscle activity in the
face is measured through attached electrodes, which
to a greater extend will bias the evaluation. By apply-
ing this SHORE
R
facial expression recognition sys-
tem to an image, first the faces are detected, then for
each detected face its facial expression is expressed
by four numbers. Each of these numbers are asso-
ciated to one of these facial expressions: happiness,
angry, sad, and surprised. Examples of the output of
this system will be shown later in the paper.
5 EXPERIMENTAL RESULTS
To evaluate the user experience of the two interfacing
methods, 25 test subjects have been asked to partici-
pate in the experiments. There were 22 males and 3
females between the ages of 20 and 32 years. Among
them, 21 were experienced with playing video games
on a gamepad-like input device, four were inexperi-
enced with video games using a gamepad-like device.
Each test subject was led into the test room alone by
the test facilitator. It was explained to them that they
were going to play a video game twice, once with a
gamepad interface and once with a motion controlled
interface through Kinect
R
. The game was demon-
strated to them by the facilitator, so they knew how
to play it. The test subject tried both versions, the or-
der of which was switched for every new subject. The
setup is shown in Figure 1 (bottom).
During the experiments the following data were
gathered from each test subject:
• Data from the algorithm that registers and classi-
fies facial expressions of the users as an index of
hedonic quality.
• The score attained while completing the game as
an index of pragmatic quality.
• The questionnaire data evaluating perceived enter-
tainment value and learnability.
The facial expression recognition algorithm clas-
sifies and records the mean percentage value per video
frame of both the positive and negative facial expres-
sions during the use of each interface. The data is
analyzed using a two-sample design with interfacing
method as the treatment factor. It shows whether there
is a difference in each facial expression category dur-
ing the use of the two interfaces. The role of gam-
ing experience level is examined visually through box
plots depicting facial expression values with both ver-
sions of the game and gaming experience level as fac-
tors.
The game score in each prototype version is
equally analyzed in a two-sample design. This de-
termines whether there is a difference in game score
using the two interfaces. Box plots are used to vi-
sually inspect whether gaming experience level is a
factor on game score.
The questionnaire is designed as two AB experi-
ments to evaluate the hedonic and pragmatic quality
of the interfaces. The test subjects are asked to se-
lect the version that they find most entertaining, and
the version they find easiest to learn to use. The di-
chotomous response variable is the preferred proto-
type version. Each AB experiment is analyzed in an
exact binomial test (Crawley, 2005) in order to deter-
mine if one version is chosen significantly more often
than the other. To avoid biasing the AB experiment,
the sequence that the selectable options A and B are
presented in the questionnaire are switched for every
new test subject.
Following subsections describe the obtained re-
sults.
5.1 Facial Expression Analysis
The first step is to objectively evaluate the hedonic
quality of the two interfaces by studying the valence
of the facial expressions. Figure 2 shows the facial
expression graphs of one of the test subjects, while
using the gamepad. For each test subject using each
prototype version an average value per video frame is
computed for each facial expression. It can be seen
in Figure 2 how the facial expression values in per-
centage fluctuate during a game course play-through
using the gamepad interface. Based on these fluctu-
ations the average value is computed for each facial
expression. Taking the blue happy graph as an exam-
ple, it has modest spikes for the entire play-through,
resulting in a 4.59% average value.
The facial expression graphs of the same test sub-
jects while using the Kinect
R
prototype is shown in
Figure 3. As can be seen, the blue happy graph has
significant spikes for most of the play-through, re-
sulting in a 20.17% average happy rating. It can be
seen that this test subject smiles a lot while using the
Kinect
R
. When compared to Figure 2, she doesn’t
smile while using the gamepad. The happy rating her
face is given while using the gamepad isn’t based on
a smile, which is also indicated by the fact that the
happy rating is mostly accompanied by a parallel an-
gry or sad rating. In Figure 3, spikes in the blue happy
curve is rarely accompanied by spikes in the other
curves, as an indication of a smiling face. The smil-
ing face while using the Kinect
R
, resulted in an aver-
age happy rating of 20.17%, compared to the 4.59%
InterfacingAssessmentusingFacialExpressionRecognition
189
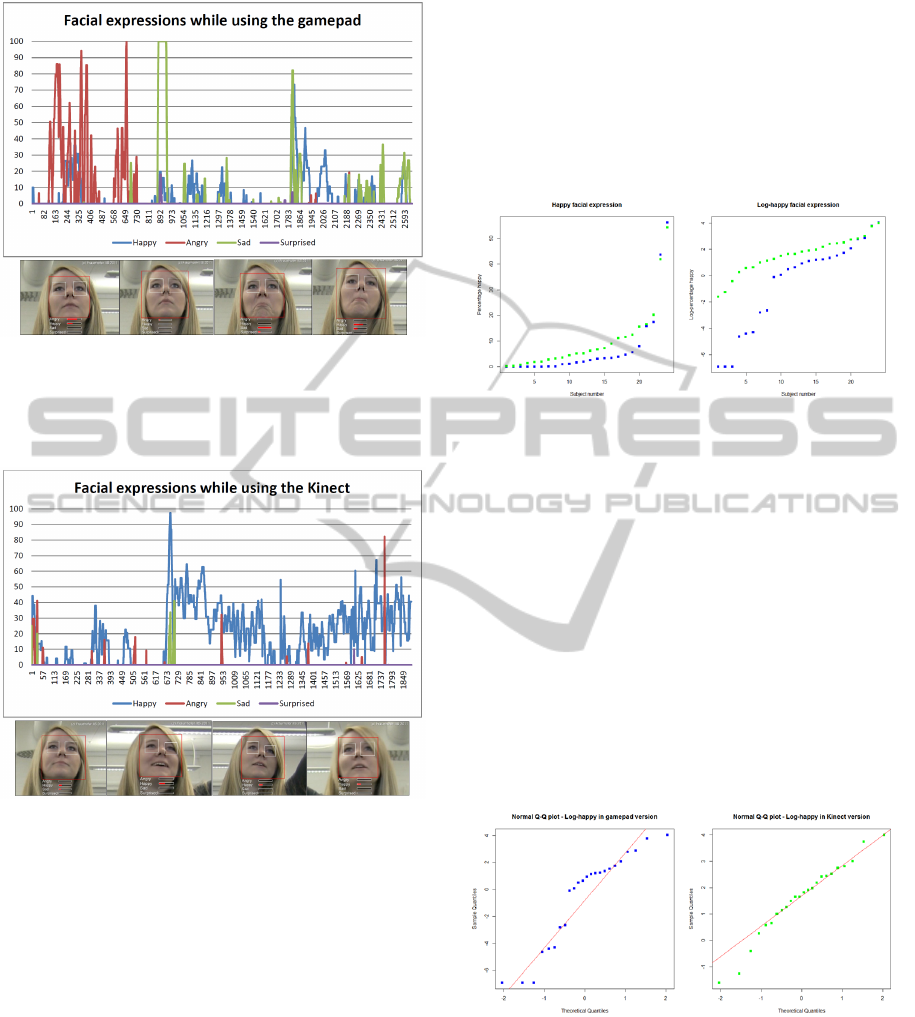
Figure 2: The results of the facial expression recognition
system for a test subjects using the gamepad interfacing
method. On the y-axis is the facial expression values in
percentage, and on the x-axis is the video frame numbers.
Below is shown the main facial expressions.
Figure 3: The results of the facial expression recognition
system for a test subjects using the Kinect
R
interfacing
method. On the y-axis is the facial expression values in
percentage, and on the x-axis is the video frame numbers.
Below is shown the main facial expressions.
happy rating while using the gamepad. This means
that the employed facial expression recognition sys-
tem does its job well of giving a higher average happy
rating during a video sequence where a person smiles,
compared to when not smiling. As such it is judged as
a useful tool to classify and analyze valence of emo-
tions based on facial expressions, particularly happy
facial expression caused by being entertained.
Now, the facial expression data is analyzed in a
two-sample design to determine whether there is a
difference between the facial expressions in the two
prototype versions, signifying a difference in hedonic
quality between the two interfacing methods. First,
the happy facial expression is analyzed. To be able
to submit the two happy samples to a Student’s t-test
(Crawley, 2005), each has to follow normal distribu-
tion. As can be seen in Figure 4 (left), the happy per-
centage values of both samples exhibit exponential
growth, which rules out normal distribution. How-
ever, a logarithmic data transformation results in ap-
proximately linear growth, which is illustrated on the
right graph of Figure 4.
Figure 4: Left: The sorted observations of average happy
facial expression per video frame. The blue are from the
gamepad, the green from the Kinect
R
. Both exhibit an ex-
ponential growth pattern. Right: The logarithm of the same
values. The growth is now close to linear, especially for the
Kinect
R
values.
To determine whether the happy facial expression
data follows log-normal distribution, Q-Q plots of
the logarithm of the two samples are shown in Fig-
ure 5. Both samples appear to follow log-normal
distribution. When the log-values are submitted
to the Kolmogorov-Smirnov normality-test (Crawley,
2005), the gamepad sample comes out with a p-value
at 0.1882 and the Kinect
R
sample at 0.9453. As such,
the Kolmogorov-Smirnov null-hypothesis cannot be
rejected, and the assumption of log-normal distribu-
tion can be accepted for both samples.
Figure 5: Q-Q plots for the logarithm of percentage happy
facial expression. To follow log-normal distribution they
are to lie on a straight line. The Kinect
R
sample does so
very well, while the gamepad sample also does so, but not
as well.
In Figure 6 (left) box plots of the log-samples
are shown. Based on the box plots, it appears that
the test subjects have more happy facial expressions
when using the Kinect
R
, compared to the gamepad.
When submitting the samples to the F-test, the F-
VISAPP2014-InternationalConferenceonComputerVisionTheoryandApplications
190
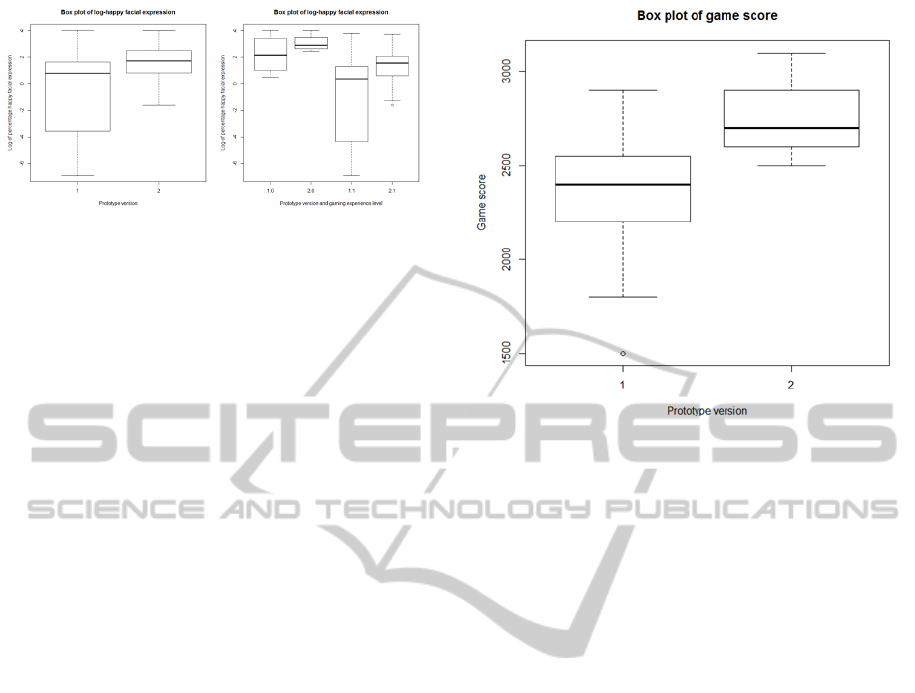
Figure 6: Left) Box plot of the logarithm of average per-
centage happy facial expression per video frame. Proto-
type version 1 is the gamepad, version 2 is the Kinect
R
.
Right) Box plot of the logarithm of average percentage
happy facial expression per video frame. On the x-axis 1.0
is gamepad version with non-gamers, 2.0 is Kinect
R
ver-
sion with non-gamers, 1.1 is gamepad version with gamers,
and 2.1 is Kinect
R
version with gamers.
value comes out at 6.1 with a p-value at 5.262×10
−5
,
meaning that the variance isn’t equal between the
samples. This was also indicated by the box plots,
where the spread of the gamepad values was much
greater than the Kinect
R
values.
The data is submitted to a paired t-test using un-
equal variance. The t-value comes out at -3.475 with
a p-value at 0.002051. The 95% confidence interval
is at -3.443 to -0.8733. As the p-value is well be-
low the critical p-value of 0.05, the null hypothesis
can be rejected stating that the mean log-happy values
are equal in the samples. The Kinect
R
and gamepad
mean values are 1.581 and -0.5769, respectively. It
therefore can be concluded that the test subjects had
significantly more happy facial expressions when us-
ing the Kinect
R
, compared to the gamepad. As an
index of hedonic quality, it signifies that the test sub-
jects had a more pleasurable experience using the mo-
tion controlled interface of the Kinect
R
, compared to
the gamepad interface. To examine whether gaming
experience level is a factor in happy facial expression
level, the box plot including gaming experience level
is shown in Figure 6 (right). When examining the
box plots, it is evident that the non-gamers in gen-
eral had more happy facial expressions when playing,
compared to the gamers. However, both the gamers
and the non-gamers looked happier when using the
Kinect
R
, compared to the gamepad.
Similar analysis has been done for the other three
facial expressions. While the angry and sad facial
expression values didn’t exhibit a clear pattern when
analyzed, the samples for surprised facial expression
showed that the Kinect
R
values were significantly
higher than the gamepad values. The t-value was -
4.126 and the p-value 0.0004117 with a 95 % confi-
dence interval from -3.524 to -1.17. As an index of
hedonic quality, the increase in surprised facial ex-
Figure 7: Box plot of the game score data. On x-axis is the
prototype version, 1 is the gamepad, and 2 is the Kinect
R
,
on the y-axis is the obtained game score.
pression signifies that the Kinect
R
version produces
a more pleasurable experience, which to a greater ex-
tend is capable of surprising the test subjects, com-
pared to the gamepad version. Regarding the effect
of gaming experience level on the amount of sur-
prised facial expression, it appeared that non-gamers
didn’t look significantly more surprised when us-
ing the Kinect
R
, compared to the gamepad version,
meaning that it is only gamers that look significantly
more surprised when using the Kinect
R
.
5.2 Game Score Analysis
Next, the pragmatic quality is analyzed through the
game score. The game score was obtained for each
prototype version for each participant. Figure 7 shows
the box plot of the game score data. It can be seen
from this figure that the gamepad scores were spread
out more widely from 1500 to 2900. The middle 50%
of the gamepad values (the box in the box plot) are all
below the middle 50% of the Kinect
R
values, indicat-
ing that the gamepad sample has significantly lower
values. The mean game scores of each sample for
gamepad and Kinect
R
are 2365.22 and 2756.52, re-
spectively.
In order to determine whether there is a significant
difference between the mean values of the gamepad
and Kinect
R
samples, they are submitted to a paired
t-test, where the variance is approximated for each
sample. Prior to that, the assumption of normal dis-
tribution has been validated through Q-Q plots and
the Kolmogorov-Smirnov normality-test. The t-value
comes out at -5.964 with a p-value at 5.301×10
−6
.
InterfacingAssessmentusingFacialExpressionRecognition
191
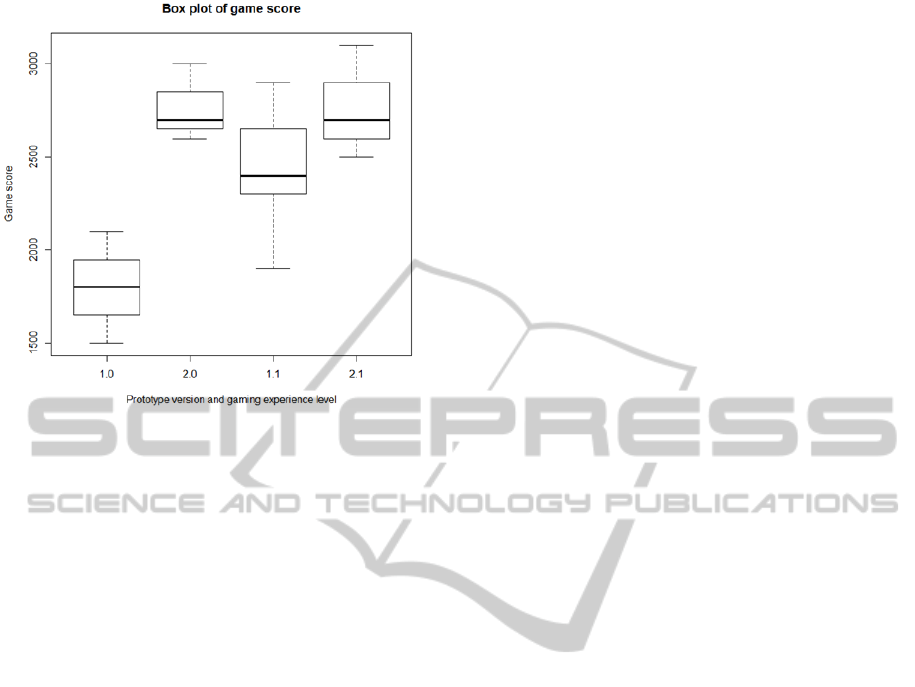
Figure 8: Box plot of the game score data. On the x-axis 1.0
is gamepad version with non-gamers, 2.0 is Kinect
R
ver-
sion with non-gamers, 1.1 is gamepad version with gamers,
and 2.1 is Kinect
R
version with gamers.
The 95% confidence interval is -527.37 to -255.23.
As the Kinect
R
score is greater than the gamepad
score, it can be concluded that the Kinect
R
interface
has a higher pragmatic quality than the gamepad, as
the test subjects was able to score higher when using
the Kinect
R
interface as an indication of an interface
that is easier to learn to use, and one that has greater
accuracy. By studying the box plot in Figure 8, it
can be seen that non-gamers score much lower than
gamers when using the gamepad. This was expected
as gamers are previously trained in using a gamepad-
like input device for playing games like the proto-
type, where non-gamers are not. In terms of Kinect
R
scores, both gamers and non-gamers score equally, in-
dicating that gaming experience level doesn’t influ-
ence the ability to use the Kinect
R
interface. The
bottom-line is that the Kinect
R
interface has greater
pragmatic quality than the gamepad interface for both
gamers and non-gamers, but for non-gamers the dif-
ference in pragmatic quality is much greater than for
gamers.
5.3 Questionnaires Analysis
Finally, the questionnaire data is analyzed. The pur-
pose is to find out how the self-reported evaluation
of hedonic and pragmatic quality comes out for the
two prototype versions. Out of the 25 test subjects,
22 chose the Kinect
R
as the prototype version that
they found most entertaining to use. When submit-
ted to an exact binomial test, the p-value comes out at
0.0001565 with 95% confidence interval from 0.6878
to 0.9745. The null-hypothesis can therefore be re-
jected, stating that each prototype version is equally
likely to be selected, with the Kinect
R
version being
selected 88% of the time, and the gamepad 12% of the
time. It can therefore be accepted that the Kinect
R
version is selected significantly more often than the
gamepad version, when being asked to select the ver-
sion that provides the most entertaining experience.
As such, the Kinect
R
version is perceived as having
significantly higher hedonic quality by the test sub-
jects, providing a more pleasurable experience when
used.
When examining the role of gaming experience
level on the perceived hedonic quality of the two in-
terfaces, it can be seen that the three test subjects that
selected the gamepad version as the most entertain-
ing all were gamers. All non-gamers selected the
Kinect
R
version as most entertaining. It indicates that
people who are inexperienced in playing video games
using a gamepad-like device are even more likely to
prefer the Kinect
R
over the gamepad, when consider-
ing entertainment value.
When examining the pragmatic quality based on
the questionnaire data, 23 out of the 25 chose the
Kinect
R
as the version that was easiest to learn to
use. The binomial test comes out with a p-value of
1.943×10
−5
with a 95% confidence interval at 0.7397
to 0.9902. This means that the Kinect
R
version is
chosen significantly more often than the gamepad ver-
sion, when asked to select the version that is easiest to
learn to use. The Kinect
R
version is selected 92% of
the time, with the gamepad 8% of the time. Thus, the
Kinect
R
version is perceived as having significantly
higher pragmatic quality, than the gamepad version.
The two test subjects that find the gamepad version
easier to learn to use are both gamers, who are experi-
enced in playing video games with a gamepad-like de-
vice. The test subjects who are not previously trained
in using the gamepad, all choose the Kinect
R
as eas-
ier to learn to use. This indicates that non-gamers are
more likely to prefer the motion controlled interface
of the Kinect
R
, when considering pragmatic quality,
compared to gamers.
6 CONCLUSIONS AND
DISCUSSIONS
In the general context of gaming, this paper has
compared two interfacing technologies, traditional
gamepad and motion controlled techniques. To do so,
a game has been developed which can be played using
both of the interfacing technologies. Then, a group
of 25 test subjects have been asked to play the game
VISAPP2014-InternationalConferenceonComputerVisionTheoryandApplications
192

twice using the available interfacing methods. During
the gaming process both hedonic and pragmatic qual-
ity measures of the test subjects have been monitored
and analyzed using subjective and objective assess-
ment methods.
Using the subjective evaluation method of a ques-
tionnaire designed as an AB experiment, significantly
more test subjects chose the Kinect
R
interface as the
most entertaining, compared to the gamepad inter-
face. In terms of pragmatic quality, significantly more
test subject chose the Kinect
R
interface as easier to
learn to use, compared to the gamepad interface. Fur-
thermore, an objective evaluation method was applied
by analyzing the facial expressions of the test sub-
jects. The result was that the test subjects had signif-
icantly more happy and surprised facial expressions
when using the Kinect
R
, compared to the gamepad.
As an index of hedonic quality, it signifies that the test
subjects had a more pleasurable experience using the
motion controlled interface of the Kinect
R
, compared
to the classical gamepad interface, causing them to
look happier and more surprised. This cross-validates
the subjective result. Furthermore, an objective eval-
uation method for pragmatic quality, using the logged
game scores of the test subjects, cross-validated the
obtained subjective result of a higher pragmatic qual-
ity of the Kinect
R
interface.
Facial expression recognition proved to be a use-
ful application of computer vision, suited to evaluate
the hedonic quality of the interfacing technologies in
an objective, non-obtrusive manner.
REFERENCES
Bateman, S., Doucette, A., Xiao, R., Gutwin, C., Mandryk,
R., and Cockburn, A. (2011). Effects of view, input
device, and track width on video game driving. In
Graphics Interface 2011, pages 207–214, St. John’s,
Canada.
Birk, M. and Mandryk, R. L. (2013). Control your game-
self: effects of controller type on enjoyment, motiva-
tion, and personality in game. In Proceedings of the
SIGCHI Conference on Human Factors in Comput-
ing Systems, CHI ’13, pages 685–694, New York, NY,
USA. ACM.
Crawley, M. J. (2005). Statistics: An Introduction using R.
Wiley. ISBN 0-470-02297-3.
Dahlgren, K. and Lyck, M. (2011). Motion control: In con-
trol or out of control? Master’s thesis, Stockholm
University.
Deci, E. and Ryan, R. (2002). Handbook of Self-
Determination Research. University of Rochester’s
Press.
Fraunhofer IIS (2013). Intelligent Systems -
Fraunhofer Institute for Integrated Circuits.
http://www.iis.fraunhofer.de/de/bf/bsy/fue/isyst.html.
Ghijsen, M. (2004). Facial expression analysis for human
computer interaction. IEEE Transactions on Visual-
ization and Computer Graphics, 2(3):147–161.
Hassenzahl, M., Burmester, M., and Koller, F.
(2003). Attrakdiff: Ein fragebogen zur messung
wahrgenommener hedonischer und pragmatischer
qualitt.
Higgins, E. T. (1987). Self-discrepancy: a theory relating
self and affect. Psychol Rev, 94(3):319–340.
Jick, T. D. (1979). Mixing qualitative and quantitative meth-
ods: Triangulation in action. Administrative Science
Quarterly, 24(4):pp. 602–611.
Kublbeck, C. and Ernst, A. (2006). Face detection and
tracking in video sequences using the modified cen-
sus transformation. Image and Vision Computing,
24(6):564 – 572.
Lindley, S. E., Le Couteur, J., and Berthouze, N. L. (2008).
Stirring up experience through movement in game
play: effects on engagement and social behaviour.
In Proceedings of the SIGCHI Conference on Human
Factors in Computing Systems, CHI ’08, pages 511–
514, New York, NY, USA. ACM.
McEwan, M., Johnson, D., Wyeth, P., and Blackler, A.
(2012). Videogame control device impact on the play
experience. In Proceedings of The 8th Australasian
Conference on Interactive Entertainment: Playing the
System, IE ’12, pages 18:1–18:3, New York, NY,
USA. ACM.
Natapov, D., Castellucci, S. J., and MacKenzie, I. S.
(2009). Iso 9241-9 evaluation of video game con-
trollers. In Proceedings of Graphics Interface 2009,
GI ’09, pages 223–230, Toronto, Ont., Canada,
Canada. Canadian Information Processing Society.
Pietschmann, D., Valtin, G., and Ohler, P. (2012). The effect
of authentic input devices on computer game immer-
sion. pages 279–292.
Ryan, R., Rigby, and Przybylski, A. (2006). The Motiva-
tional Pull of Video Games: A Self-Determination
Theory Approach. Motivation and Emotion,
30(4):344–360.
Shafer, D. M., Carbonara, C. P., and Popova, L. (2011).
Spatial presence and perceived reality as predictors
of motion-based video game enjoyment. Presence:
Teleoper. Virtual Environ., 20(6):591–619.
Skalski, P., Lange, R., Tamborini, R., and Shelton, A.
(2007). Mapping the road to fun: Natural video game
controllers, presence, and game enjoyment. In 57th
Annual Conference of the International Communica-
tion Association.
Tan, C. T., Rosser, D., Bakkes, S., and Pisan, Y. (2012).
A feasibility study in using facial expressions analy-
sis to evaluate player experiences. In Proceedings of
The 8th Australasian Conference on Interactive Enter-
tainment: Playing the System, IE ’12, pages 5:1–5:10,
New York, NY, USA. ACM.
InterfacingAssessmentusingFacialExpressionRecognition
193
