
A Study on Autonomic Nervous System Responses and Feauture
Selection for Emotion Recognition
Emotion Recognition using Machine Learning Algorithms
Byoung-Jun Park
1
, Eun-Hye Jang
1
, Sang-Hyeob Kim
1
, Myung-Ae Chung
1
and Jin-Hun Sohn
2
1
Electronics and Telecommunications Research Institute, Daejeon, Republic of Korea
2
Department of Psychology & Brain Research Institute, Chungnam National University, Daejeon, Republic of Korea
Keywords: Emotion, Recognition, Physiological Signals, Feature Selection.
Abstract: This study is related with emotion recognition based on autonomic nervous system responses. Three
different emotional states, fear, surprise and stress, are evoked by stimuli and the autonomic nervous system
responses for the induced emotions are measured as physiological signals such as skin temperature,
electrodermal activity, electrocardiogram, and photoplethysmography. Twenty-eight features are analysed
and extracted from these signals. The results of one-way ANOVA toward each parameter, there are
significant differences among three emotions in some features. Therefore we select eight features from 28
features for emotion recognition. The comparative results of emotion recognition are discussed in view
point of feature space with the selected features. For emotion recognition, we use four machine learning
algorithms, namely, linear discriminant analysis, classification and regression tree, self-organizing map and
naïve bayes, and those are evaluated by only training, 10-fold cross-validation and repeated random sub-
sampling validation. This can be helpful to provide the basis for the emotion recognition technique in
human computer interaction as well as contribute to the standardization in emotion-specific ANS responses.
1 INTRODUCTION
Physiological signal is one of the most commonly
used emotional cues. In recent emotion recognition
research, the one of main topics is to recognize
human’s feeling or emotion using multi-channel
physiological signals for the implementation of
emotional intelligence in human computer
interaction (Wagner, Kim and Andre, 2005).
Emotion recognition has been studied using facial
expression, gesture, voice and bio signal. Bio signal
may happen to artifact due to motion, and have
difficulty mapping emotion-specific responses
pattern. However, bio signals have some advantages
which are less affected by environment than any
other modalities as well as possible to observe user’s
state in real time. In addition, they also can be
acquired spontaneous emotional responses and not
caused by responses to social masking or factitious
emotion expressions (Drummond and Quah, 2001).
In that respect, correlation between emotion and
autonomic nervous system (ANS) responses in
human may have a major influence from
development and test of emotion theory to human
computer interaction (HCI) studies (Eom, Park, Noh
and Sohn, 2011).
Many previous studies on emotion have reported
that there is correlation between basic emotions
(happiness, sadness, anger, etc.) and physiological
responses (Kreibig, 2010; Bailenson, Pontikakis,
Mauss, Gross, Jabon, Hutcherson, Nass, and John,
2008; Calvo, Brown and Scheding, 2009; Liu, Conn,
Sarkar, and Stone, 2008). Also, experimental studies
to distinguish specific emotions by using ANS
response are being carried out and suggesting
common ANS responses of some emotions
(Stemmler, 1989; Ekman, Levenson and Friesen,
1983; Kreibig, 2010). Recently, emotion recognition
using physiological signals based on ANS response
has been performed by various machine learning
algorithms, e.g., Fisher Projection (FP), k-Nearest
Neighbor algorithm (kNN), Linear Discriminant
analysis, and Support Vector Machine (SVM).
Previous researches have conducted a recognition
accuracy of over 80% on average seems to be
acceptable for realistic applications (Picard, Vyzas
and Healey, 2001; Haag, Goronzy, Schaich and
116
Park B., Jang E., Kim S., Chung M. and Sohn J..
A Study on Autonomic Nervous System Responses and Feauture Selection for Emotion Recognition - Emotion Recognition using Machine Learning
Algorithms.
DOI: 10.5220/0004731201160121
In Proceedings of the International Conference on Bio-inspired Systems and Signal Processing (BIOSIGNALS-2014), pages 116-121
ISBN: 978-989-758-011-6
Copyright
c
2014 SCITEPRESS (Science and Technology Publications, Lda.)

Williams, 2004; Calvo, Brown and Scheding, 2009).
In this study, we discuss the feature selection
using correlation with the specific ANS responses
and negative emotions and the emotion recognition
using machine learning algorithms. It is important to
recognize negative emotions (e.g., fear, surprise and
stress) because they are primarily responsible for
gradual declination or downfall of our normal
thinking process, which is essential for our natural
(unforced) survival, even in the struggle for
existence. We have already reported the recognition
results of three negative emotions (Jang, et al., 2012,
2013). As a follow-up work, we perform extra
analysis of emotion recognition on the reduced
feature space with various criteria. To classify three
negative emotions four machine learning algorithms,
which are Linear Discriminant Analysis (LDA),
Classification And Regression Tree (CART), Self
Organizing Map (SOMs), and Naïve Bayes, are used.
The results will offer information about the emotion
recognizer with feature selections using physiology
signals induce by negative emotions.
2 NEGATIVE EMOTION AND
PHYSIOLOGICAL SIGNALS
Negative emotions play an important role in
adaptation of living and surviving the evolution of
human. In particular, Negative emotion is described
‘protection reaction’ such as flight, withdrawal,
vomiting, crying and ‘destruction reaction’ such as
aggressive.
2.1 Emotional Stimuli
Thirty emotional stimuli (3emotions x 10sets) which
are the 2-4 min long audio-visual film clips captured
originally from movies, documentary, and TV shows
are used to successfully induce three emotions. Fear-
inducing films are the scene which have tense and
dreary atmosphere. Surprise clips are a section in
which startling accident occurred and stress clip is
TV adjustment scene that was mixture of black and
white with white noise sound as shown in Table 1.
The audio-visual film clips used as emotion
stimuli are examined their suitability and
effectiveness by preliminary study which 22 college
students rated the category and intensity of their
experienced emotion on emotional assessment scale.
The suitability of emotional stimuli means the
consistency between the experimenters’ intended
emotion and the participants’ experienced emotion
and the effectiveness is determined by the intensity
of emotions reported by the participants. The result
showed that emotional stimuli had the suitability of
89% and the effectiveness of 9.1 point on average.
Table 1: The examples of emotional stimuli.
Emotion Contents Example
Fear
ghost, haunted
house, scare, etc.
Surprise
sudden or
unexpected
scream etc.
Stress
audio/visual
noise on screen,
etc.
Prior to the experiment, participants are introduced
to detail experiment procedure and have an
adaptation time to feel comfortable in the
laboratory’s environment. Then an experimenter
attaches electrodes on their wrist, finger, and ankle
for measurement of physiological signals.
Physiological signals are measured for 60 sec prior
to the presentation of emotional stimulus (baseline)
and for 2 to 4 min during the presentation of the
stimulus (emotional state), then for 60 sec after
presentation of the stimulus as recovery term.
Participants rate the emotion that they experience
during presentation of the film clip on the emotion
assessment scale. This procedure is repeated 3 times
for elicitation of 3 differential emotions.
Presentation of each film clip is count-balanced
across each emotional stimulus. This experiment is
progressed by the same procedures over 10 times.
2.2 Measurement of Physiological
Signals and Feature Extraction
The ANS responses of emotions induced by stimuli
are measured using MP100 of Biopac Systems Inc.
(USA) and AcqKnowledge (version 3.8.1) is used
for signal analysis. Electrodermal activity (EDA) is
measured from two Ag/AgCl electrodes attached to
the index and middle fingers of the non-dominant
hand. Electrocardiogram (ECG) is measured from
both wrists and one left ankle (reference) with the
two-electrode method based on lead I.
Photoplethysmography (PPG) and skin temperature
(SKT) are measured from the little finger and the
AStudyonAutonomicNervousSystemResponsesandFeautureSelectionforEmotionRecognition-EmotionRecognition
usingMachineLearningAlgorithms
117
ring finger of the non-dominant hand, respectively.
Appropriate amplification and band-pass filtering
are performed.
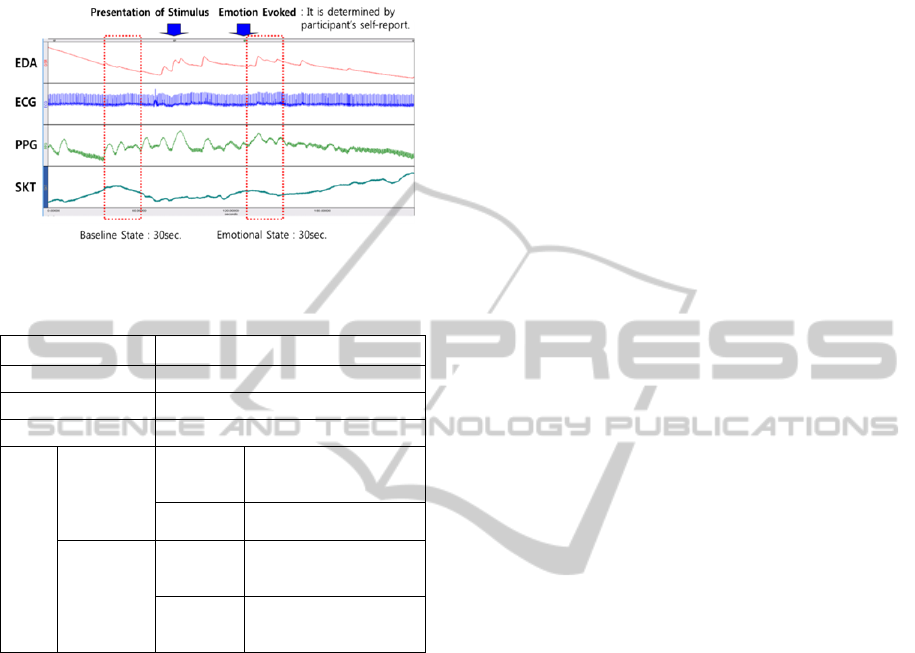
Figure 1: Analysis of physiological signals.
Table 2: Features extracted from physiological signals.
Signals Features
EDA
SCL, NSCR, meanSCR
SKT
meanSKT, maxSKT
PPG
meanPPG
ECG
Time
domain
Statistical
Parameter
meanRRI, stdRRI,
meanHR, RMSSD,
NN50, pNN50
Geometric
parameter
SD1, SD2, CSI, CVI,
RRtri, TINN
Frequency
domain
FFT
FFT_apLF, FFT_apHF,
FFT_nLF, FFT_nHF,
FFT_LF/HF ratio
AR
AR_apLF, AR_apHF,
AR_nLF, AR_nHF,
AR_LF/HF ratio
The physiological signals for emotions are acquired
for 1 minute long baseline state prior to presentation
of emotional stimuli and 2-4 minutes long emotional
states during presentation of the stimuli. 270 data
except severe artifact are used for analysis. To
extract features, the obtained signals are analyzed
for 30 seconds from the baseline and the emotional
state as shown in Figure 1. The emotional states are
determined by the result of participant’s self-report
(scene that emotion is most strongly induced during
presentation of each stimulus).
Skin conductance level (SCL), average of skin
conductance response (meanSCR) and number of
skin conductance response (NSCL) are obtained
from EDA. The mean (meanSKT) and maximum
skin temperature (maxSKT) and the mean amplitude
of blood volume changes (meanPPG) are gotten
from SKT and PPG, respectively. RRI is the interval
time of R peaks on the ECG signal. RRI and hear
rate (HR) offers the mean RRI (meanRRI) and
standard deviation (stdRRI), the mean hear rate
(meanHR), RMSSD, NN50 and pNN50. RMSSD is
the square root of the mean of the sum of the squares
of differences between successive RRIs. NN50 is the
number of RRI with 50 msec or more and the
proportion of NN50 divided by total number of RRI
is pNN50. RRtri is to divide the entire number of
RRI by the magnitude of the histogram of RRI
density and TINN is the width of RRI histogram. In
addition to those, we use the fast Fourier transform
(FFT) and the auto regressive (AR) power spectrum.
The band of low frequency (LF) is 0.04~0.15 Hz and
the high frequency (HF) is 0.15~0.4Hz. The total
spectral power between 0.04 and 0.15 Hz is apLF
and the normalized power of apLF is nLF. apHF and
nHF are the total spectral power between 0.15 and
0.4 Hz and the normalized power, respectively.
L/Hratio means the ratio of low to high frequency
power. These parameters are resulted by means of
FFT and AR. LF and HF are used as indexes of
sympathetic and vagus activity, respectively. The
L/Hratio reflects the global sympatho-vagal balance
and can be used as a measure of this balance.
Twenty-eight features are firstly extracted and
analyzed from the physiological signals based on
ANS response of each emotion, which have been
used in emotion recognition study frequently as
shown in Table 2.
3 DIFFERENCES IN
AUTONOMIC NERVOUS
SYSTEM RESPONSES AMONG
NEGATIVE EMOTIONS
The differences of physiological signals among three
emotions (alpha level at .05) are analysed by one-
way ANOVA (SPSS ver. 15.0). The results of one-
way ANOVA using difference value of signals
subtracting emotional states from baseline shows
statistically significant differences among three
emotions in NSCR, mean SCR, mean SKT, max
SKT and FFT_apHF (which is value to integrate an
absolute value power of HF extracted from FFT) as
shown in Table 3.
To verify the difference among three emotions in
detail, Figure 2 illustrates data analysed by LSD post
hoc test. Here, x axis indicates each emotion, fear,
surprise and stress, and y axis presents the difference
values between emotion and baseline states. There
are significant differences of NSCR among all
emotions and mean SCR between fear and stress,
and between surprise and stress. SCR and NSCR,
which were extracted from EDA, decreased for the
response of baseline while all emotions are evoked.
BIOSIGNALS2014-InternationalConferenceonBio-inspiredSystemsandSignalProcessing
118
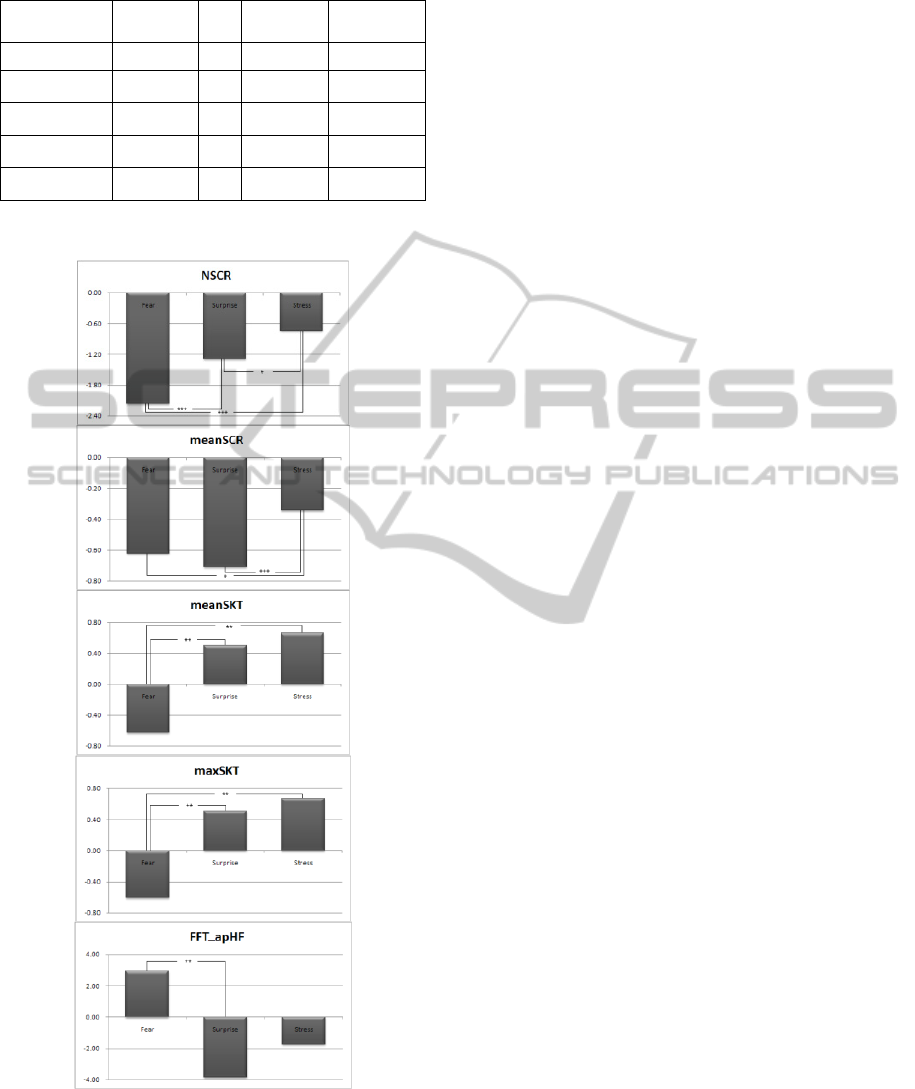
Table 3: Result of one-way ANOVA toward parameters.
ANOVA
Sum of
Square
df
Mean of
Square
F-score
NSCR 100.398 2 50.199 20.886***
meanSCR 7.363 2 3.681 6.242**
meanSKT 94.884 2 47.442 5.827**
maxSKT 91.563 2 45.781 5.744***
FFT_apHF 2,322.00 2 1,161.00 3.833*
* p < .05, ** p < .01, *** p < .001
df: degree of freedom
Figure 2: The results of LSD post-hoc test (*p<.05,
**p<.01, **p<.001).
Also, mean and max SKT distinguished between
fear and surprise and between fear and stress. SKT
decreased during fear induction and increased during
surprise and stress from baseline. Finally, significant
difference between fear and surprise was in
FFT_apHF. There were an increase of FFT_apHF in
fear and decreases of FFT_apHF in surprise and
stress.
To compare results of emotion recognition on
feature space, we have select eight feature base on
difference in ANS responses among negative
emotions. The selected features are SCL, NSCR,
meanSCR, meanSKT, meanPPG, meanHR,
FFT_LF/HF ratio and AR_LF/HF ratio.
4 EMOTION RECOGNITION
In this study, we have used linear discriminant
analysis (LDA), which is one of the oldest
mechanical classification systems and linear models,
classification and regression tree (CART) which is a
robust classification and regression tree, self
organizing map (SOM), and Naïve Bayes recognizer
based on density for emotion recognition.
LDA is a method used in statistics, pattern
recognition and machine learning to find a linear
combination of features, which characterizes or
separates two or more classes of objects or events
(Duda, Hart and Stork, 2000). CART is one of
decision tree and nonparametric technique that can
select from among a large number of variables those
and their interactions that are most important in
determining the outcome variable to be explained
(Breiman, Friedman, Olshen and Stone 1984).
SOMs called Kohonen map, is a type of artificial
neural networks in the unsupervised learning
category and generally present a simplified,
relational view of a highly complex data set
(Kohone, 2001). The Naïve Bayes algorithm is a
classification algorithm based on Bayes rule and
particularly suited when the dimensionality of the
inputs is high (Duda, Hart and Stork, 2000).
The four machine learning algorithms were
evaluated on only training (TR), 10-fold cross-
vallidation (CV) and repeated random sub-sampling
validation (RRSV). For TR, the entire dataset is used
to build a recognizer and evaluate the built
recognizer. TR has the overfitting problem. For
solution of the overfitting problem, there are CV and
RRSV. In 10-fold cross-validation, the entire dataset
is partitioned into 10 equal size subsets. Of the 10
subsets, a single subset is retained as the testing data
for testing the recognizer, and the remaining 9
subdatasets are used as training data to build a
recognizer. In RRSV, the 70% of the whole
AStudyonAutonomicNervousSystemResponsesandFeautureSelectionforEmotionRecognition-EmotionRecognition
usingMachineLearningAlgorithms
119

emotional patterns are selected randomly for training,
the remaining patterns are used for testing purposes
and this is repeated 10 times.
Table 4: Result of emotion recognition on feature space
with 28 features.
Machine Learning
Algorithms
TR CV
RRSV
Training Testing
LDA
56.9 45.4 58.9±1.7 44.0±3.7
CART
87.2 44.4 87.4±1.9 42.9±4.2
SOM
Supervised 43.1 36.5 43.0±1.8 35.5±4.5
Unsupervised 59.5 31.9 60.5±1.6 32.4±5.5
Naive Bayes
80.9 54.9 81.9±2.9 46.9±4.8
Table 5: Result of emotion recognition on feature space
with 8 features.
Machine Learning
Algorithms
TR CV
RRSV
Training Testing
LDA
52.6 48.0 54.2±2.3 47.0±3.4
CART
85.5 40.5 82.9±1.5 43.3±4.8
SOM
Supervised 47.7 47.4 49.9±2.0 44.2±4.4
Unsupervised 63.8 39.1 65.1±2.6 40.3±4.3
Naive Bayes
72.7 49.3 73.8±3.2 43.3±5.5
Table 4 and 5 show the recognition results
(recognition accrracy) by using the TR, CV and
RRSV for 28 features and 8 features, respectively.
We used feature normalization and the related
parameters of algorithms used default values, which
have offered with toolbox. As shown in results, the
accraccy of emotion recognition have higher values
for trainign than testing. The CV exhibits the results
for testing. To apply to real system, we have to
discuss in the view point of testing. For 28 features,
the results of emotion recogntion for CV has range
of 31.9 to 54.9% when all emtions are recognized
for test dataset. The accuracy of recognition for
RRSV shows in range 32.4 to 46.9 for testing. The
similar results accurs when dealing with 8 features.
Namlely, we have achieved similar accuracy of
emtion recognition with lower dimensionality. In the
pattern recognition, a method with low
dimensionality offer an intuitive interpretation of the
relationship between features and emotions with the
use of fewer resoruces. The comparative results
reveal that the original feature space has been
reduced up to 71% with the similar accurcy of
emotion recognition.
5 CONCLUSIONS
The aim of this study is to classify three negative
emotions, fear, surprise, and stress, induced by
stimuli. For this, we have gotten the physiological
signals based on autonomic nervous system
responses of the evoked emotions. Also, twenty-
eight features have been analysed and extracted from
these signals, and we select eight features based on
the results of one-way ANOVA. The results of one-
way ANOVA using difference value of signals
subtracting emotional states from baseline shows
statistically significant differences among three
emotions in eight features, SCL, NSCR, meanSCR,
meanSKT, meanPPG, meanHR, FFT_LF/HF ratio
and AR_LF/HF ratio. To classify three emotions, we
used four machine learning algorithms, namely,
linear discriminant analysis (LDA), classification
and regression tree (CART), self-organizing map
(SOM) and Naïve Bayes, and the results of those
were reported by only training (TR), 10-fold cross-
validation (CV) and repeated random sub-sampling
validation (RRSV). As shown in results, the similar
results have been gotten when dealing with 28 and
selected 8 features. Therefore the original feature
space has been reduced up to 71% with the similar
accurcy of emotion recognition. However, in spite of
the reduced feature space, there is a problem with
improvement of recognition accuracy for the
negative emotions, becuase recognition results
showed the low accuracy for testing. We will
investigate various methodologies for dealing the
accuracy improvement of emotion recognition in the
future research. Nevertheless, these results can be
useful in developing an emotion theory based on
physiological responses in HCI.
ACKNOWLEDGEMENTS
This research was supported by the Converging
Research Center Program through the Ministry of
Science, ICT and Future Planning, Korea
(2013K000329 and 2013K000332).
BIOSIGNALS2014-InternationalConferenceonBio-inspiredSystemsandSignalProcessing
120

REFERENCES
Wagner, J., Kim, J., Andre, E., 2005. From physiological
signals to emotions: Implementing and comparing
selected methods for feature extraction and
classification. IEEE International Conference on
Multimedia and Expo.
Drummond, P. D., Quah, S. H., 2001. The effect of
expressing anger on cardiovascular reactivity and
facial blood flow in Chinese and Caucasians.
Psychophysiology, vol. 38, pp. 190.
Eom, J. S., Park, H. J., Noh, J. H., Sohn, J. H., 2011.
Cardiovascular response to surprise stimulus. Korean
Journal of the Science of Emotion & Sensibility, vol.
14, pp. 147.
Kreibig, S. D., 2010. Autonomic nervous system activity
in emotion: A review. Biological psychology, vol. 84,
pp. 394.
Bailenson, J. N., Pontikakis, E. D., Mauss, I. B., Gross, J.,
Jabon, M. E., Hutcherson, C. A. C., Nass, C., John, O.,
2008. Real-time classification of evoked emotions
using facial feature tracking and physiological
responses. International journal of human-computer
studies, vol. 66, pp. 303.
Calvo, R., Brown, I., Scheding, S., 2009. Effect of
experimental factors on the recognition of affective
mental states through physiological measures.
Advances in Artificial Intelligence, vol. 5866, pp. 62.
Liu, C., Conn, K., Sarkar, N., Stone, W., 2008.
Physiology-based affect recognition for computer-
assisted intervention of children with Autism
Spectrum Disorder. International journal of human-
computer studies, vol. 66, pp. 662.
Stemmler, G., 1989. The autonomic differentiation of
emotions revisited: convergent and discriminant
validation. Psychophysiology, vol. 26, pp. 617.
Ekman, P., Levenson, R.W., Friesen, W.V., 1983.
Autonomic nervous system activity distinguishes
among emotions. Science, vol. 221, pp. 1208.
Picard, R. W., Vyzas, E., Healey J., 2001. Toward
machine emotional intelligence: Analysis of affective
physiological state. IEEE Transaction on Pattern
Analysis and Machine Intelligence, vol. 23, pp. 1175.
Haag, A., Goronzy, S., Schaich, P., Williams, J., 2004.
Emotion recognition using bio-sensors: First steps
towards an automatic system. Affective Dialogue
Systems, vol. 3068, pp. 36.
Jang, E.-H., Park, B.-J., Kim, S.-H., Huh, C., Eum, J.,
Sohn, J.-H., 2012. Emotion Recognition Through ANS
Responses Evoked by Negative Emotions. The Fifth
International Conference on Advances in Computer-
Human Interactions, pp. 218.
Jang, E.-H., Park, B.-J., Kim, S.-H., Chung, M.-A., Park,
M.-S., Sohn, J.-H., 2013. Classification of Three
Negative Emotions based on Physiological Signals.
The Second International Conference on Intelligent
Systems and Applications, pp. 75.
Duda, R. O., Hart, P. E., Stork, D. G., 2000. Pattern
Classification.
Breiman, L., Friedman, J. H., Olshen, R. A., Stone, C. J.,
1984. Classification and Regression Trees. Wadsworth.
Kohonen, T., 2001. Self-Organizing Maps
. Springer
Series in Information Sciences, vol. 30, Springer.
AStudyonAutonomicNervousSystemResponsesandFeautureSelectionforEmotionRecognition-EmotionRecognition
usingMachineLearningAlgorithms
121
