
A Fraud Detection Visualization System Utilizing Radial Drawings and
Heat-maps
Evmorfia N. Argyriou
1
, Antonios Symvonis
1
and Vassilis Vassiliou
2
1
School of Applied Mathematical & Physical Sciences, National Technical University of Athens, Athens, Greece
2
Vodafone Greece, Halandri, Greece
Keywords:
Information Visualization, Fraud Management Systems, Data Visualization, Fraud Detection.
Abstract:
We present a prototype system developed in cooperation with a business organization that combines informa-
tion visualization and pattern-matching techniques to detect fraudulent activity by employees. The system is
built upon common fraud patterns searched while trying to detect occupational fraud suggested by internal
auditors of a business company. The main visualization of the system consists of a multi-layer radial drawing
that represents the activity of the employees and clients. Each layer represents a different examined pattern
whereas heat-maps indicating suspicious activity are incorporated in the visualization. The data are first pre-
processed based on a decision tree generated by the examined patterns and each employee is assigned a value
indicating whether or not there exist indications of fraud. The visualization is presented as an animation and
the employees are visualized one by one according to their severity values together with their related clients.
1 INTRODUCTION
Internal fraud detection gains more and more atten-
tion as fraudulent activity appears in ascendant trend
during the last years. Fraud is defined as “the inten-
tional misuse or abuse of the assets of a company (As-
sociation of Certified Fraud Examiners, 2012)” and
may be committed by employees, clients or other en-
tities. Studies on business fraud show that most of the
reported fraud cases have been committed by trusted
associates and this is referred to as “occupational or
employee fraud”. Such schemes may continue for
years until fraud is confirmed, producing a huge cost
both to the global economy and to the company. As
a result of fraud, business reputation, company value
and public and client trust are negatively affected.
Even though advanced information technology
has been incorporated into organizations to reduce
the risk of internal fraud, monitoring diverse systems
that produce textual logs in non-uniform formats is a
time-consuming task. Information visualization can
be promising, since it facilitates the quick identifica-
tion of fraudulent activity. In this paper, we present a
system developed in cooperation with a business or-
ganization that exploits the advantages of information
visualization and pattern recognition to detect suspi-
cious patterns concerning fraudulent financial state-
ments in systems in which a pair of entities (em-
ployee and client) are involved. Towards this direc-
tion, the system produces a multi-layer radial drawing
(see Fig. 1) representing the activity of employees and
clients along with other significant information that
enable the identification of possible fraud patterns.
Since occupational fraud schemes are well-hidden
in the huge amount of data, we were seeking for an
approach that would present to the auditor all the
recorded events according to their severity. On the
other hand, visualizing large data-sets simultaneously
is confusing and inefficient. For this reason, the sys-
tem measures the similarity of the activity of the em-
ployees based on fraud detection patterns (suggested
by auditors based on their experience and the frame-
work of the company on internal fraud risk reduction)
and appropriate heat-maps are generated and incorpo-
rated in the system. The produced visualization is pre-
sented as an animation. The system supports supple-
mentary functionalities such as a database log viewer,
export log mechanisms, storing and post-processing
of data, plots and charts.
2 RELATED WORK
Fraud detection has been studied enough in the lit-
erature. To the best of our knowledge, there exist
only few works oriented exclusively on occupational
153
N. Argyriou E., Symvonis A. and Vassiliou V..
A Fraud Detection Visualization System Utilizing Radial Drawings and Heat-maps.
DOI: 10.5220/0004735501530160
In Proceedings of the 5th International Conference on Information Visualization Theory and Applications (IVAPP-2014), pages 153-160
ISBN: 978-989-758-005-5
Copyright
c
2014 SCITEPRESS (Science and Technology Publications, Lda.)
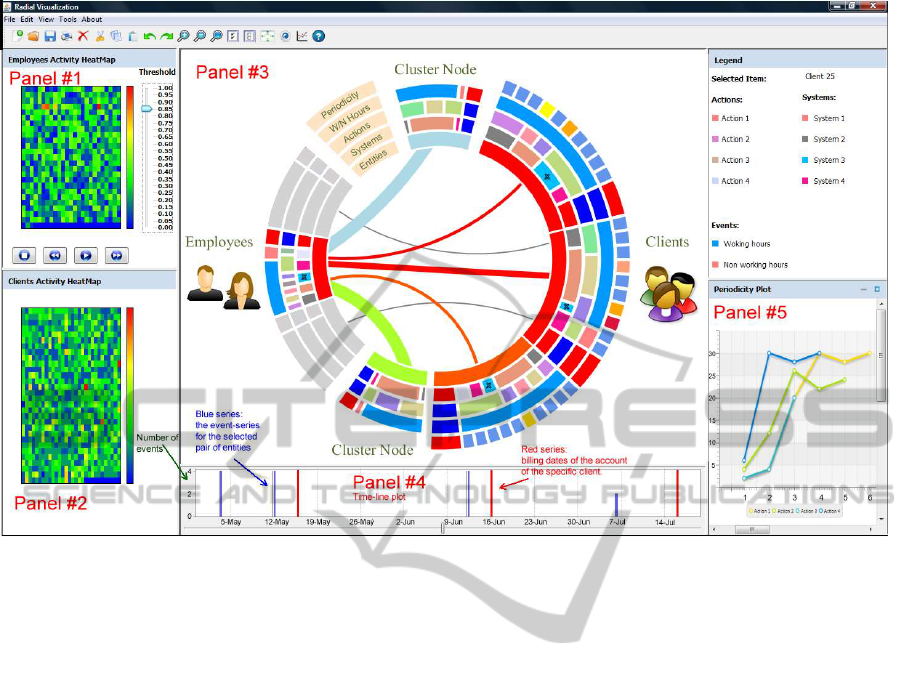
Figure 1: A snapshot of the interface of the system.
fraud detection. Luell (Luell, 2010) utilizes data-
mining and visualization techniques to detect client
advisor fraud in a financial institution. Eberle and
Holder (Eberle and Holder, 2009) detect structural
anomalies in transactions and processes propagated
by employees using a graph representation. Syner-
Scope (SynerScope, 2011) is an industrial tool capa-
ble of detecting financial fraud using a visualization
scheme similar to ours representing the billing links
and relations between the company and other entities.
The main difference is that our system is oriented on
occupational fraud detection based on patterns sug-
gested by auditors and, thus, it is equipped with a de-
tection mechanism that preprocesses the data and the
visualization conforms to these patterns. We also uti-
lize animations to avoid cluttering the visualization.
A visualization system based on concentric circles
was presented in (Argyriou and Symvonis, 2012) aim-
ing at identifying periodic events using an algorithm
for periodicity detection. Our system extends the one
presented in (Argyriou et al., 2013a) that detects pe-
riodic patterns that may conceal occupational fraud
in several ways: (i) The visualization of our system
provides a complete view of all the examined patterns
and the results of the examination on each pattern (in
(Argyriou et al., 2013a), the detection procedure was
a “black-box” determining the order of the presenta-
tion of the clients in a video representing their activ-
ity in which suspicious clients appeared first; partial
results of the detection procedure were illustrated in
additional plots and charts, which hindered the inves-
tigation), (ii) the detection mechanism is based on a
decision tree even though we have incorporated most
of the patterns presented in (Argyriou et al., 2013a),
(iii) for periodicity detection, we apply a variation of
the Longest Common Subsequence algorithm (Vla-
chos et al., 2003) that tackles noisy data, (iv) a par-
allel coordinates plot has been added to detect un-
usual employee behavior, (v) the system provides a
database-viewer to facilitate the investigation proce-
dure. Many of the existing works on fraud detection
in general, use data-mining (Bolton and Hand, 2002),
(Kou et al., 2004), (Phua et al., 2010) and pattern
matching or graph pattern matching approaches (Sen-
ator et al., 1995), (Senator et al., 2002), (Wolverton
et al., 2003). Visualizations have also been used for
financial crime detection (Chang et al., 2008),(Huang
et al., 2009),(Giacomo et al., 2010), (Didimo et al.,
2011), (Didimo et al., 2012). For details on the above
works refer to (Argyriou et al., 2013b). This paper is
structured as follows: In Section 3, we describe the
detection procedure. In Section 4, we present the fea-
tures of the visualization. Section 5 presents a case-
study based on real data. We conclude in Section 6
with open problems and future work.
IVAPP2014-InternationalConferenceonInformationVisualizationTheoryandApplications
154

3 DETECTION PROCEDURE
As input, the system takes log files from diverse con-
trol systems that are appropriately parsed and stored
in a database using a uniform format. Records may
be generated by systems involving an employee and
a client consist (among other secondary fields) of a
time-stamp, an employee ID, a client ID and an ac-
tion. An event, say e, is defined as a 4-tuple (t, u,c,a),
where: (i) t corresponds to the time-stamp of the oc-
currence of e, (ii) u corresponds to an employee, (iii) c
represents a client, and (iv) a is the action taken by
the employee. For an event e = (t,u, c,a), we say
that client c is related to e and is also related to em-
ployee u. For a pair of employee-client (u,c), an
event-series T
u,c
= {e
1
(u,c)
,e
2
(u,c)
,.. .} is a sequence of
events e
i
(u,c)
= (t
i
,u, c,a
i
) related to client c and em-
ployee u.
The visualization may be generated either based
on the whole data-set of the database or on queries
performed by the auditor in the startup screen of the
system. As mentioned above, data have to be prepro-
cessed before producing the visualization such that
employees with strong indication of fraud are distin-
guished. For this reason, for a given employee u,
the event-series with each related client will be evalu-
ated based on fraud patterns and a value indicating the
severity of the related events (within range [0,1]) will
be assigned first to the event-series and then, to the
employee. If several fraud patterns are identified, em-
ployee u is assigned the maximum severity value of
the already calculated event-series related to u. The
evaluation is performed based on a decision tree gen-
erated by the following patterns suggested by the au-
ditors (see Fig. 2): (i) There exist more than X events
related to employee u and client c within a time inter-
val of Y days/months where X,Y are configurable by
the auditor (refer to the green rectangular node of the
first layer belowthe root of the decision tree in Fig. 2),
(ii) the employee has performed unauthorized actions
(based on a list of actions provided by the auditors)
and, (iii) the employee operated in systems that she
is not authorized to use. In the case where patterns
(ii) or (iii) occur, the event-series of the employee is
assigned the maximum value (i.e., value 1) such that
the employee is definitely distinguished in the visual-
ization. However, in the case where pattern (i) occurs,
the investigation has to proceed further. Then, the pat-
terns that are taken into consideration are:
• Event-series periodicity: A common pattern
while examining such fraud schemes is the occur-
rence of events in regular time basis. For instance,
an employee modifies intentionally the account of
a client every month within the billing cycle of
the account and more precisely, before its billing
date. Assuming that event-series T
u,c
related to
employee u and client c is ordered according to
the time-stamps of the events, the system aims
to detect similarities between pattern time-series
based on a variation of Longest Common Subse-
quence algorithm (Vlachos et al., 2003), which is
robust under noisy conditions. The pattern time-
series include the ideal time-series if the events
between the entities appear in time intervals that
equal exactly to 1, 7,15,30 and other time-series
identified in the past as fraud patterns. In the case
where similarity with any of the above time-series
is detected, we consider the event-series of the
employee to be periodical.
• Events occurring outside working hours:
Fraudulent activities usually occur outside work-
ing hours, on holidays or at the end of the em-
ployee’s shift. For this reason, if such events oc-
cur they have to be taken under consideration.
• Employee’s frequency in recorded systems:
Each employee according to her responsibilities
operates in specific business systems. If this is
not the case, then the employee has to justify the
recorded event. Also, in several systems such as
fraud management systems (FMS), it is expected
that an employee monitors the activity of a suspi-
cious client. Hence, events stemming from these
systems have to be given smaller weight.
• Actions taken by the employee: Similarly to the
previous case, there exist some actions that an em-
ployee is unlikely, but not unauthorized to per-
form since they do not conform to her duties.
The idea behind the decision tree was to corre-
spond to each layer one fraud pattern and create a
path according to the result of the examination on
each pattern. We consider the importance of pat-
terns based on their corresponding layer in the de-
cision tree, such that the higher ones (closer to the
root) are more important. Let x = [x
1
,x
2
,x
3
,x
4
,x
5
]
be the pattern vector examined (e.g., x = [0, 0,0, 0,0]
corresponds to non-fraudulent activity) and let y =
[y
1
,.. . ,y
5
] be the vector resulting from the traversal
of the decision tree from its root to its leaves accord-
ing to the evaluation of the events of pair (u,c) on
each factor. If the examination of the events leads to
“Unauthorized action” or “Unauthorized system” the
event-series is directly assigned value 1. Else, each
tree layer i is assigned a weight, say w
i
,i = 1,. .., 5,
based on the formula presented in (Stillwell et al.,
1981) such that dissimilarities between the two vec-
tors that occur at higher levels of the tree will be
more important. For this reason, the distance be-
AFraudDetectionVisualizationSystemUtilizingRadialDrawingsandHeat-maps
155

Same pair of
Employee-Client
Unauthorized
Action
Unauthorized
System
No pattern
No
Yes
No
Yes
No
Yes
No
Yes
No
Yes
No
Yes
No
Yes
No
Yes
No
Yes
NoYes NoYes
NoYes NoYes No
Yes
NoYes
Periodicity ?
Working Hours ?
Is Employee a
Common
Actions ?
1 1 10
1
0
0 0
0 0 0 0 0 0 0 0
00
01
1 1 1
1
1
1 1 1 1 1 1 1 1
0
w
1
w
2
w
3
w
4
w
5
Employee
Frequent User
of the System?
Access Within
Figure 2: The decision tree based on which the event-series of the employees are assigned a severity value.
tween vectors x,y, say d(x,y), representing the dis-
similarity by the pattern vector,is calculated by apply-
ing the normalized Weighted Euclidean Distance met-
ric formula d(x,y) =
q
∑
5
i=1
(x
i
− y
i
)
2
∗ w
i
/
q
∑
5
i=1
w
i
.
This value (or the maximum of the already calcu-
lated values, if more than one fraud patterns exist)
corresponds to the severity value of the event-series
of employee u, which is the value finally assigned
to the employee. Based on these values the sys-
tem generates a heat-map representing all employees
by rectangular nodes and gradient colors from blue
to red (refer to the upper-left heat-map of Fig. 1),
such that nodes with color close to color-red represent
employees with strong indications of fraud, whereas
blue colored nodes employees with no suspicion of
fraud. Similarly to the severity calculation of the
event-series of employees, the system assigns also a
severity value to clients based on the above patterns.
The only difference is that for a given client c, the
severity value is calculated on all the events related to
c (not only the ones that concern a specific employee).
In this manner, a client involved in suspicious activity
with two or more employees will be distinguished.
4 FEATURES OF THE SYSTEM
The visualization window
1
consists of two heat-maps
representing the severity of the activity of employees
and clients (refer to Panels #1 and #2 of Fig. 1, resp.).
Due to space constraints, details about the selection of
the particular type of color-maps can be found in (Ar-
gyriou et al., 2013b). At startup only the heat-map
representing the activity of the employees is gener-
1
The reader is suggested to print the paper in color.
ated. The auditor selects a threshold value that deter-
mines the employees that will be presented based on
their severity values. The visualization is animated
and each time an employee together with her related
clients is illustrated. Before an employee is presented,
the heat-map for her related clients is generated.
The main visualization of the system is a multi-layer
radial drawing where each layer L
1
,.. . ,L
5
(see Fig. 3)
represents a different aspect of the audit data (sys-
tems, actions, within working hours or not, periodic-
ity) and each circular sector corresponds to an entity
(employee, client or cluster). Then, a graph is gener-
ated; its nodes correspond to each of the above enti-
ties, whereas its edges correspond to the connections
among them. The innermost layer of the visualiza-
tion (layer L
1
of Fig. 3) accommodates the nodes of
the graph (drawn as portions of a ring). Nodes rep-
resenting employees are drawn to the left-part of the
visualization where the ones representing their related
clients to the right part. To avoid cluttering the visu-
alization with nodes representing clients with no indi-
cation of fraud, the auditor can specify thresholds that
split clients in one or two clusters (low-severity clus-
ter and/or medium-severity cluster) according to their
severity values. These nodes are accommodated on
top and to the bottom part of the visualization. The
color of the nodes (apart from the ones representing
clusters and the gray-colored ones that will be ex-
plained later) follows the color of the corresponding
entities in the heat-maps. The light-blue (green, resp)
colored cluster-node corresponds to the low (medium,
resp) severity cluster (refer to reference points 1 and
2 of Fig. 3, resp.). Regarding the edges of the draw-
ing, the system supports either circular arc edges or
straight-line edges. The thickness of an edge is pro-
portional to the number of connections between the
employee and the client while its color is determined
IVAPP2014-InternationalConferenceonInformationVisualizationTheoryandApplications
156

by the color of the client. In a fraud context, “fat”
edges (unless referring to cluster nodes) and in partic-
ular, the red-colored ones may be indications of fraud
that have to be further examined.
Subsequent layers (i.e., layers L
2
− L
5
) represent
the patterns described in Section 3 and are split into
two regions A and B (refer to Fig. 3). Region A repre-
sents a heat-map indicating the result of the examina-
tion of the entity in the specific pattern. Red color in-
dicates identification of suspicious pattern. Region B
illustrates information about each corresponding ex-
amined pattern. In layer L
2
, the differentbusiness sys-
tems related to the each of the entities are represented.
Each such system is characterized by a specific color
and occupies space proportional to the corresponding
aggregate percentage of use by the entity. For each
employee, this percentage is calculated based on the
aggregated percentage of use on all clients that are
currently drawn in the visualization, whereas for each
client based on the percentage of use by the employee
currently visualized (unless more than one employ-
ees related to a client are drawn simultaneously in the
visualization). Similarly, for cluster nodes the aggre-
gated percentage of use for all clients that belong to
the cluster is calculated. Systems for which the em-
ployee is an unauthorized or not a frequent user are
marked by an X (refer to reference point 3 of Fig. 3).
Layer L
3
corresponds to the actions reported for
each entity, and are drawn in a similar manner as the
ones in layer L
2
. Again unauthorized or suspicious
actions are marked with an X. Layer L
4
represents
the percentage of events that occur within or outside
working hours. The light-blue colored parts represent
events occurring within working hours, whereas the
light-red colored parts indicate the existence of events
occurring outside working hours (e.g., see reference
points 4 and 5 of Fig. 3, resp). For each client node
there exists an additional layer (refer to L
5
of Fig. 3,
e.g., see reference point 6) that indicates whether or
not the event-series of the client is periodical. The
event-series is compared with the pattern time-series
stored in the system and a heat-map is generated in-
dicating the degree of similarity with each pattern.
Again, light-red colors indicate suspicious cases.
Regarding the investigation procedure, as already
mentioned the auditor specifies a threshold and the
employees with assigned severity value above the
threshold are presented with their related clients in
the visualization one by one. The auditor is able to
start, pause or stop the video and process the visual-
ization. In the case where a client node is selected,
additional related employees can be added to the vi-
sualization, which facilitates the possible identifica-
tion of two or more employees that may cooperate in
committing fraud (the case where an employee node
is selected is treated similarly). In Fig. 3, gray col-
ored nodes (see reference point 7) represent nodes
added during post-processing when a client node is
selected (refer to the node pointed by the green ar-
row of Fig. 3). If more than one node representing
employees exist simultaneously in the visualization,
the auditor is able to select one of them and add the
related employees to the visualization. Gray-color
is utilized for non-selected employee nodes together
with their edges and related clients (if they are not
related also to the selected employee) to avoid dis-
tracting the auditor. In the case where a cluster node
is selected, the corresponding rectangles in the heat-
map representing clients are marked with an X such
that they can be added (if desired) to the visualiza-
tion. However, the system permits a specific number
of additions of employee or client nodes in order to
avoid cluttering the visualization area. If this num-
ber is exceeded, optionally a new visualization can be
produced, where only the inner-most layer of the ra-
dial drawing (i.e., the one corresponding to the clients
and employees) is drawn along with the relations be-
tween them. Again, the width of the edges is pro-
portional to the number of events that relate two enti-
ties. In the case where further investigation is needed
the auditor selects the desired node (which becomes
larger) and the other layers of the radial drawing (i.e.,
L
2
− L
5
) that correspond to the particular node appear
in the visualization. In this manner, the system is able
to visualize simultaneously a larger set of entities and
reveal the relations between them. However, this may
slow down the investigation and for this reason, we
adopted the animation approach and the simultaneous
visualization of all layers for each node. Due to space
constraints, details about the ordering of the nodes
in the visualization can be found in (Argyriou et al.,
2013b).
Panel #4 of Fig. 1 accommodates a time-line plot
representing the event-series for the selected pair of
entities (refer to the blue series), where the x−axis
corresponds to the date of the occurrence of each
event and the y−axis to the number of events occurred
during the specific date. The red series represents the
billing date of the account of the specific client for
each month. This plot facilitates the identification
of possible periodic activity especially close to the
billing date of the account of the client. In employee
fraud schemes, it is also possible that the event-series
related to a pair of entities is periodical only based on
a specific action. For this reason, we have incorpo-
rated in the system a second plot (refer to Panel #5
of Fig. 1) that presents all reported actions by distinct
series. In this plot, the y−axis corresponds to the day
AFraudDetectionVisualizationSystemUtilizingRadialDrawingsandHeat-maps
157
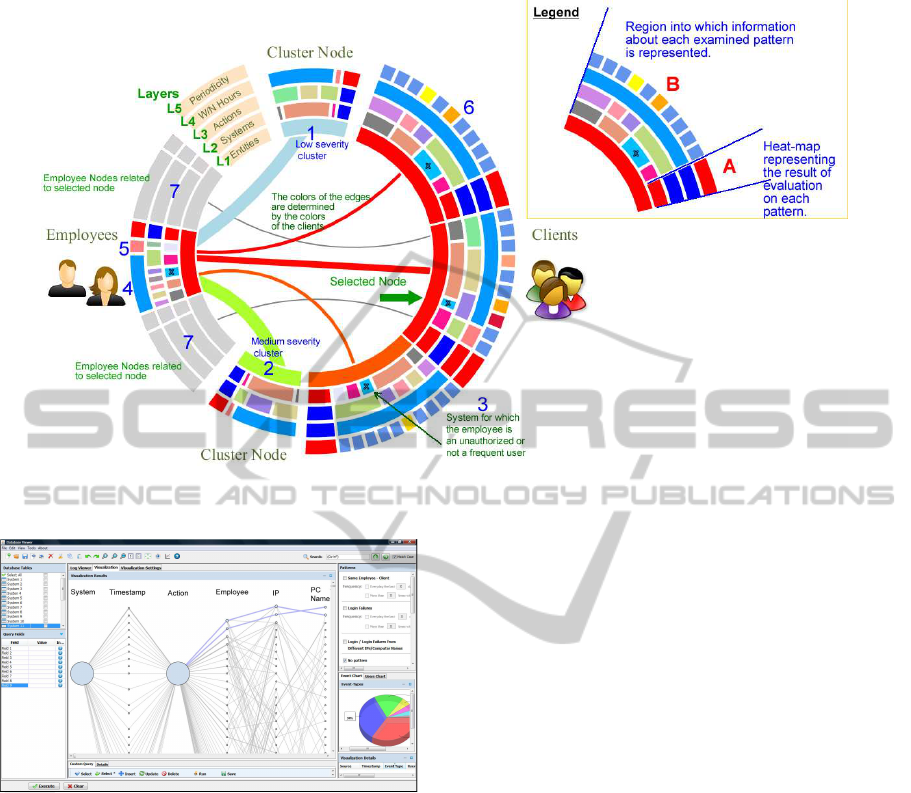
Figure 3: Description of the main-visualization of the system. “Fat” edges (unless referring to cluster nodes) and in particular,
the red-colored ones may be indications of fraud that have to be further examined.
Figure 4: A parallel coordinates plot to monitor failed login
attempts in a specific system.
of the month that event x related to a specific action
occurred (e.g., the first event related to an action that
occurred on the 15th day of a month will be drawn on
point (1,15). For this case, we ignore multiple occur-
rences of events related to the same action occurred
the same day of the month. In the case where peri-
odicity occurs for a specific action, the corresponding
series will have part (or the whole series) almost par-
allel to x−axis.
The system supports also mechanisms to detect
patterns of unusual employee behavior such as unau-
thorized access to computers, business systems and
accounts of employees or clients by producing a par-
allel coordinates plot (see Fig. 4). In this case, each
record consists of an employee, a time-stamp, an IP
indicating the address of the employee’s computer, a
computer name and an action (i.e., login, login fail-
ure, etc). The size of the nodes and the edges is pro-
portional to the number of their occurrences in the
database. The nodes on each layer are ordered by
their number of occurrences in the data-set. The pat-
terns commonly used in this scenario are: (i) More
than X failed login attempts within a time intervalofY
days/months, where X,Y are configurable by the au-
ditor, and (ii) Login attempts or failed login attempts
occurring from different IPs and/or computer names.
5 CASE STUDY
We present the results of the evaluation of the sys-
tem on real data-sets stemming from two control sys-
tems of a business company. All data provided to us
were anonymous for data privacy reasons. The data-
set consists of 180.637 entries lying within a time in-
terval of six months. The data-set consists of 710 dis-
tinct employees and 83.030 distinct clients. The audi-
tors have also included a set of entries corresponding
to a “fictional” fraud case scenario in which an em-
ployee modifies the account of a client. We were not
communicated any information regarding the billing
dates of the accounts of the clients.
Since one of the data-sets stems from a fraud man-
agement system, it is expected that reoccurring ac-
tivity between the same pair of employee and client
will occur (a “suspicious” client is expected to be su-
pervised by an employee). For this reason, we con-
IVAPP2014-InternationalConferenceonInformationVisualizationTheoryandApplications
158
centrated our study in identifying pairs of employees
and clients that appear to have more that 10 related
events and occur in regular time basis, and in partic-
ular, monthly. The employees’ heat-map indicated 41
employees that were related with the same client with
more than 10 events. Among these employees, 17 of
them had periodic activity and events occurring out-
side working hours (the corresponding rectangles in
the employees’ heat-map were “close to” color-red),
while the remaining 24 employees had events occur-
ring outside working hours (the corresponding rect-
angles in the employees’ heat-map were “close to”
color-orange). Also, no employee used unauthorized
systems or actions, whereas only one employee had
used non common actions.
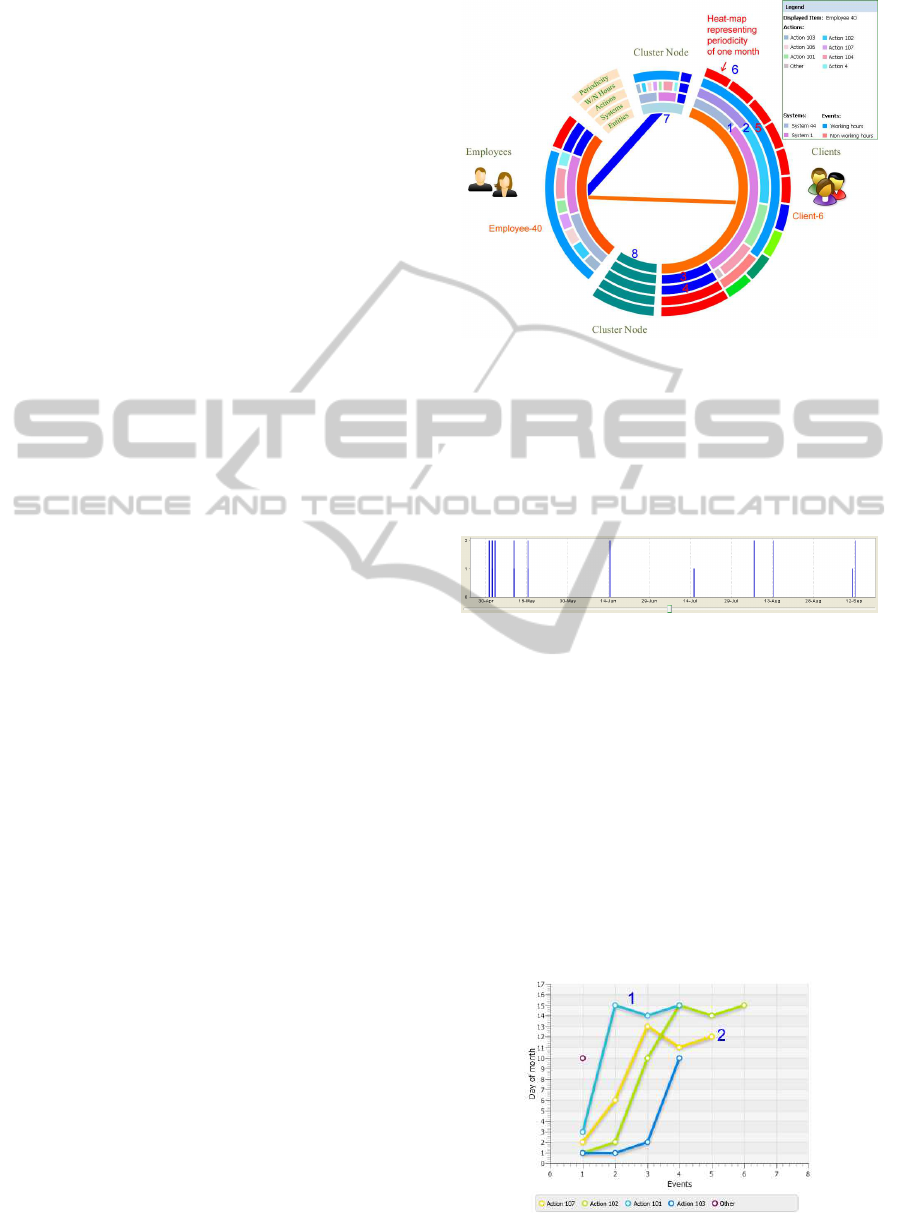
Due to space constraints, we will only present the
“fictional” fraud case. A detailed description of the
case study can be found in (Argyriou et al., 2013b). In
Fig. 5, Employee-40 is related to Client-6 with more
than 10 events, using two business systems for which
she is a frequent user and common actions (see refer-
ence points 1 and 2 of Fig. 5; the parts representing
the systems and the actions are not marked by an X,
which implies that the user was frequent for the spe-
cific systems or had performed common actions, and
the corresponding heat-maps are blue-colored; see
reference points 3 and 4 of Fig. 5). All the events that
related these entities occurred within working hours
(see reference point 5 of Fig. 5). However, the event-
series of Employee-40 appears to have strong sim-
ilarity with six fraud pattern time-series, including
the one that corresponds to periodicity of one month,
which is represented by the first heat-map of the each
periodicity layer (see reference point 6 of Fig. 5).
Also, Client-6 was not related to any other employee
(when selected, no other employee was added to the
visualization). All other clients related to Employee-
40, where placed in the low-severity cluster, whereas
no client was placed in the medium-severity cluster
(see reference points 7 and 8 of Fig. 5, resp.). The
first suspicions according to the auditors, are raised
by the fact that there exists activity between the two
entities stemming from two business systems.
The auditors explained that the time-line plot (re-
fer to Fig. 6) matches to a fraud case scenario accord-
ing to which there exists some activity at the begin-
ning (between April - May) with no specific period-
icity and then, appears periodic activity (from May to
September). In the first time interval, the fraudster is
trying to organize her fraud by performing a number
of actions. Once the fraud is organized, only peri-
odic actions are required. Another suspicious obser-
vation is that the events from May to September occur
close to the same dates of each month (from 10th to
Figure 5: A frame of the animation illustrating the activity
of Employee-40.
15th). Of course, there exist some “noisy” data that
have to be excluded in order to understand the fraud
pattern. These may have been caused either on pur-
pose to cover up the fraud or were part of the duties
of the employee.
Figure 6: The time-line plot indicates monthly activity.
The above assumption is reinforced by the plot of
Fig. 7 which reveals the periodic occurrence of each
performed action. For instance, “Action 101” (see ref-
erence point 1) appears to have periodicity around the
15th day of the month from its second occurrence and
later. Also, “Action 107” (see reference point 2) ap-
pears to have periodicity around the 11th-13th day of
the month from its third occurrence and later. In par-
ticular, the vast majority of events are recorded be-
tween the 10th and the 15th day of the month. We
could be more convinced that this case consists fraud
if we knew exactly the billing cycle of the account of
the client.
Figure 7: A plot indicating the periodic pattern for the per-
formed actions.
AFraudDetectionVisualizationSystemUtilizingRadialDrawingsandHeat-maps
159

In a similar manner, the frames of the animation
illustrating the other highly-ranked employees were
investigated. We gave more attention to the 17 frames
of the animation containing periodic events. Fortu-
nately for the company, the only real evidence of
fraud existed in the fictional data added by the au-
ditors. However, the auditors had not identified all
these cases while examining the data-sets manually
and they had to make an additional investigation.
6 CONCLUSIONS AND FUTURE
WORK
We presented an integrated fraud management visual-
ization system that aims to identify patterns that may
conceal occupational fraud through a combination of
pattern recognition and visualization. Our work opens
several aspects for future work such as incorporation
of more fraud patterns, use of more statistical methods
and, extension of the system in order to identify more
complicated fraud schemes (client fraud, telecommu-
nication fraud, etc.) in a wider variety of business
systems.
ACKNOWLEDGEMENTS
The work of Evmorfia N. Argyriou has been co-
financed by the European Union (European Social
Fund ESF) and Greek national funds through the
Operational Program ”Education and Lifelong Learn-
ing” of the National Strategic Reference Framework
(NSRF) - Research Funding Program: Heracleitus II.
Investing in knowledge society through the European
Social Fund.
REFERENCES
Argyriou, E. N., Sotiraki, A., and Symvonis, A. (2013a).
Occupational fraud detection through visualization. In
ISI, pages 4–7.
Argyriou, E. N. and Symvonis, A. (2012). Detecting peri-
odicity in serial data through visualization. In ISVC,
volume 7432, pages 295–304.
Argyriou, E. N., Symvonis, A., and Vassiliou, V. (2013b).
A fraud detection visualization system utilizing ra-
dial drawings and heat-maps. Technical report,
arXiv:submit/0845288.
Association of Certified Fraud Examiners (2012). Report to
the Nation on Occupational Fraud and Abuse.
Bolton, R. J. and Hand, D. J. (2002). Statistical fraud de-
tection: A review. Statistical Science, 17:2002.
Chang, R., Lee, A., Ghoniem, M., Kosara, R., and Ribarsky,
W. (2008). Scalable and interactive visual analysis of
financial wire transactions for fraud detection. Infor-
mation Visualization, 7(1):63–76.
Didimo, W., Liotta, G., and Montecchiani, F. (2012).
Vis4aui: Visual analysis of banking activity networks.
In GRAPP/IVAPP, pages 799–802.
Didimo, W., Liotta, G., Montecchiani, F., and Palladino, P.
(2011). An advanced network visualization system for
financial crime detection. In PacificVis, pages 203–
210.
Eberle, W. and Holder, L. B. (2009). Mining for insider
threats in business transactions and processes. In
CIDM, pages 163–170.
Giacomo, E. D., Didimo, W., Liotta, G., and Palladino, P.
(2010). Visual analysis of financial crimes. In AVI,
pages 393–394.
Huang, M. L., Liang, J., and Nguyen, Q. V. (2009). A vi-
sualization approach for frauds detection in financial
market. IV ’09, pages 197–202.
Kou, Y., Lu, C.-T., Sirwongwattana, S., and Huang, Y.-P.
(2004). Survey of fraud detection techniques. In Net-
working, Sensing and Control, 2004 IEEE Int. Conf.,
volume 2, pages 749–754.
Luell, J. (2010). Employee fraud detection under real world
conditions. PhD thesis.
Phua, C., Lee, V. C. S., Smith-Miles, K., and Gayler, R. W.
(2010). A comprehensive survey of data mining-based
fraud detection research. CoRR, abs/1009.6119.
Senator, T. E., Goldberg, H. G., Shyr, P., Bennett, S.,
Donoho, S., and Lovell, C. (2002). chapter The
NASD regulation advanced detection system: inte-
grating data mining and visualization for break detec-
tion in the NASDAQ stock market, pages 363–371.
Senator, T. E., Goldberg, H. G., Wooton, J., Cottini, M. A.,
Khan, A. F. U., Klinger, C. D., Llamas, W. M., Mar-
rone, M. P., and Wong, R. W. H. (1995). The financial
crimes enforcement network ai system (fais) identify-
ing potential money laundering from reports of large
cash transactions. AI Magazine, 16(4):21–39.
Stillwell, W. G., Seaver, D. A., and Edwards, W. (1981).
A comparison of weight approximation techniques in
multiattribute utility decision making. Organ. Behav-
ior and Human Performance, 28(1):62 – 77.
SynerScope (2011). http://www.synerscope.com/.
Vlachos, M., Hadjieleftheriou, M., Gunopulos, D., and
Keogh, E. (2003). Indexing multi-dimensional time-
series with support for multiple distance measures. In
ACM SIGKDD int. conf. on Knowledge discovery and
data mining, KDD ’03, pages 216–225.
Wolverton, M., Berry, P., Harrison, I., Lowrance, J., Mor-
ley, D., Rodriguez, A., Ruspini, E., and Thomere, J.
(2003). Law: A workbench for approximate pattern
matching in relational data. In IAAI, pages 143–150.
IVAPP2014-InternationalConferenceonInformationVisualizationTheoryandApplications
160
