
Probabilistic Neural Network for Predicting Resistance
to HIV-Protease Inhibitor Nelfinavir
Letícia Martins Raposo
1
, Mônica Barcellos Arruda
2
,
Rodrigo de Moraes Brindeiro
2
and Flavio Fonseca Nobre
1
1
Biomedical Engineering Program, Federal University of Rio de Janeiro, Ilha do Fundão, Rio de Janeiro, Brazil
2
Laboratory of Molecular Virology, Federal University of Rio de Janeiro, Ilha do Fundão, Rio de Janeiro, Brazil
Keywords: Classifier, Resistance, HIV, Probabilistic Neural Networks.
Abstract: Resistance to antiretroviral drugs has been a major obstacle for a long-lasting treatment of HIV infected
patients. The development of models to predict drug resistance is already recognized as useful for helping
the decision making process regarding the best therapy for each individual HIV+. The aim of this study was
to develop classifiers for predicting resistance to HIV protease inhibitor Nelfinavir using probabilistic neural
network (PNN). The data were provided by the Molecular Virology Laboratory of the Health Sciences
Center, Federal University of Rio de Janeiro (CCS-UFRJ/Brazil). Using a combination of bootstrap and
cross-validation to develop the classifiers, four features were selected to be used as input for the network.
Additionally, this approach was also used to define the spread parameter of the PNN networks. Final
modelling strategy involved the development of four PNN networks with balanced data and evaluation of
the models was done using a separate test set. The accuracies on the test set of the classifiers ranged from
71.2 to 76.0% and the area under the receiver operating characteristic (ROC) curve (AUC) ranged from 0.70
to 0.73. For the two best classifiers the sensitivity and specificity were 66.7% and 78.9% respectively, and
the accuracy and AUC were 76.0% and 0.73 for both classifiers. The classifiers showed performances very
close to two existing expert-based interpretation systems (IS), the Stanford HIV db and the Rega algorithms.
The analysis also illustrates the use of a computational approach for feature selection and model parameters
estimation that can be used in other settings.
1 INTRODUCTION
The acquired immunodeficiency syndrome (AIDS),
first documented in 1981, is an infectious disease
caused by the human immunodeficiency virus
(HIV). This syndrome is one of the main causes of
death in the world, been responsible for about 1.8
million deaths in 2010 (UNAIDS, 2011).
Despite the efforts of researchers worldwide, the
design of an effective vaccine and cure of HIV are
still uncertain (Barouch, 2008). Nevertheless, some
approved antiretroviral drugs are available for
treatment of HIV infection and currently, the use of
multiple drugs, known as highly active antiretroviral
therapy (HAART), is widely available to HIV-
infected patients. Many people infected with HIV
gained years of life due to the use of HAART
(Bushman et al, 1998). Currently several
governments and different international
organizations are providing free antiretroviral
therapy to patients from developing countries
(Peeters, 2001).
However, despite all efforts, some HIV-infected
patients had treatment failure due to various factors
such as drug toxicity and resistance, sub-optimal
drug metabolism and poor adherence. Among these
causes, drug resistance plays a central role in
HAART failure (Richman, 2006).
The use of tests that identify HIV drug resistance
is recommended as an important monitoring tool in
clinical practice. Phenotyping is considered the gold
standard test and it provides a direct quantitative
measure of the susceptibility of certain strains of
HIV drugs. However, this test is quite expensive,
demanding a long time to obtain results and it is a
complex procedure requiring specialized
laboratories (Wang and Larder, 2003; Vermeiren et
al, 2007). Alternatively, genotyping is able to
determine the presence or absence of specific
genetic mutations in the HIV that were previously
17
Martins Raposo L., Barcellos Arruda M., Brindeiro R. and Fonseca Nobre F..
Probabilistic Neural Network for Predicting Resistance to HIV-Protease Inhibitor Nelfinavir.
DOI: 10.5220/0004735900170023
In Proceedings of the International Conference on Bioinformatics Models, Methods and Algorithms (BIOINFORMATICS-2014), pages 17-23
ISBN: 978-989-758-012-3
Copyright
c
2014 SCITEPRESS (Science and Technology Publications, Lda.)

associated with drug resistance. This test become a
routine diagnostic tool for monitoring HIV
infections since it is a faster and less expensive test,
and therefore a more available procedure (Wang and
Larder, 2003). Based on the genotype, a variety of
methods have been developed for the prediction of
resistance mutations directly from the sequences.
Different techniques have being applied to the
development of predictive models, including those
based on statistical methods (Prosperi et al, 2009;
Van der Borght et al, 2013), neural networks (Bonet
et al, 2007; Pasomsub et al, 2010), support vector
machine (Beerenwinkel et al, 2003) and decision
trees (Beerenwinkel et al, 2002). For the
development of such predictive models one has a
protein sequence of length n, and since there are 20
amino acids it results in 20
n
possible features to
represent one sequence. Therefore, one of the major
issues is to reduce the dimension of the features that
represent the protein sequence. This can be achieved
by using some feature selection method to find the
best features subset with major influence in the
resistance.
The objectives of this paper are: (i) to evaluate a
new feature selection strategy combining bootstrap
and cross-validation, (ii) to investigate the
performance of the probabilistic neural network
(PNN) as a tool to predict resistance to Nelfinavir, a
protease inhibitor used to promote viral suppression
and improve immunity in HIV-infected patients, and
(iii) to compare the predictive value of the PNN with
two well-know interpretation systems (IS).
2 MATERIALS AND METHODS
The data were provided by the Laboratory of
Molecular Virology of the Center of Health
Sciences, Federal University of Rio de Janeiro
(CCS-UFRJ/Brazil), a member of the network of
genotyping laboratories of the Ministry of Health
(RENAGENO).
For this study a total of 625 amino acid
sequences of the protease enzyme of the pol gene of
HIV-1, subtypes B, from 625 patients infected by
this virus were analyzed. Additional available
variables were CD4 T cell count and viral load in the
last period of treatment.
Basic demographic and clinical information of
the patients under study are described in Table 1,
where non-resistants refer only to Nelfinavir.
The dependent variable was the indication of
whether or not the patient had resistance to
the inhibitor Nelfinavir. Patients that for the last
Table 1: Summary of clinical characteristics of patients
(n=625).
Parameters All
Resistants Non
resistants
Average age,
years (±sd)
38.15
(12.00)
36.13
(11.47)
38.68
(13.72)
Male, (%) 421 (67.4)
81 (12.96) 340 (54.4)
Average viral
load, log
copies/ml
(IQR)
4.58 (4.09
- 5.00)
4.50 (4.00
- 4.91)
4.60 (4.11
- 5.02)
Average CD4
T cell count,
cells/mm³
(IQR)
300.5
(127.0 -
420.0)
304.7
(164.5 -
443.2)
299.4
(124.5 -
407.0)
sd: standard deviation
IQR: interquartile range
regimen of the therapy had no indication of being
using Nelfinavir were considered as susceptible and
the outcome variable was coded as 0, while those
who shown failure were coded as 1 and classified as
resistant to the drug. The explanatory variables
where a set of selected amino acid mutation
positions for the HIV-1 protease gene (PR) known to
influence drug resistance, the CD4 T cell count and
the viral load. The positions included for analysis
were those reported by Johnson et al (2011), an
update list of the International Antiviral Society
(IAS-USA), which lists the mutations associated
with resistance to antiretroviral drugs. The selected
amino acid positions were: L10, D30, M36, M46,
A71, V77, V82, I84, N88 and L90. To implement
the neural network model, the amino acids were
coded using the Eisenberg consensus hydrophobicity
scale (Eisenberg et al, 1984), shown in Table 2.
The 625 available samples were divided into two
different subsets using stratified sampling: a training
set with 500 patients and an external test set
composed with 125 patients. In the training group,
400 patients had no resistance to Nelfinavir, while
100 were resistant. In the test group, 30 patients
were resistant to the antiretroviral therapy and 95
had no resistance. The training set was used for the
selection of input variables and the spread parameter
of the PNN model, and the test set was used to
evaluate the final performance of the models.
It is important to select the best set of input
variables to enhance the classification process as
well as to reduce the training and test time of the
models. This feature selection was carried out using
a combination of bootstrap, a technique proposed by
Efron (1979) which yields a new set of data by
resampling with replacement the original data set,
and cross-validation. We obtain 100 bootstrap
BIOINFORMATICS2014-InternationalConferenceonBioinformaticsModels,MethodsandAlgorithms
18
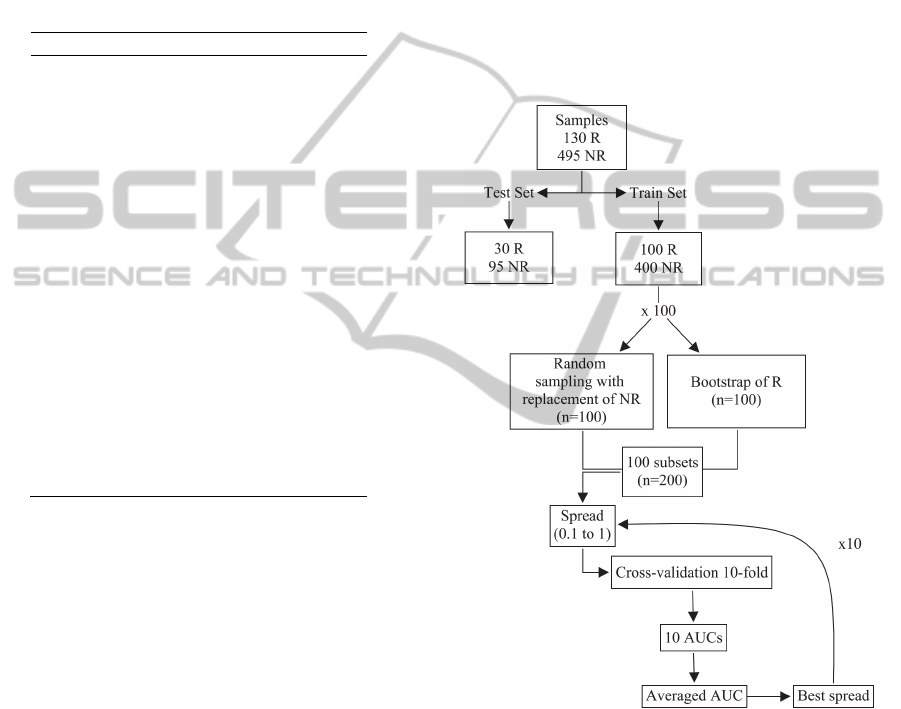
samples with the same size of the resistant samples
in the training set (100), and each of these bootstrap
samples was combined with a random sample of size
100 obtained from sampling with replacement from
the 400 non-resistant samples, resulting in a
balanced set of paired data (100 resistant and 100
non-resistant). For each of these balanced subsets, a
PNN model was implemented and the spread is
varied from 0.1 to 1 in steps of 0.1.
Table 2: Eisenberg hydrophobicity scale.
Amino Acid Symbol Value
Arginine R - 2.53
Lysine K - 1.50
Aspartic acid D -0.30
Glutamine Q -0.85
Asparagine N -0.78
Glutamic acid E -0.74
Histidine H - 0.40
Serine S -0.18
Threonine T -0.05
Proline P 0.12
Tyrosine Y 0.26
Cysteine C 0.29
Glycine G 0.48
Alanine A 0.62
Methionine M 0.64
Tryptophan W 0.81
Leucine L 1.06
Valine V 1.08
Phenylalanine F 1.19
Isoleucine I 1.38
For each spread, the best set of variables was
obtained using sequential forward selection (SFS)
method. The criterion to choose the variables was
based on the area under the receiver operating
characteristic (ROC) curve (AUC). First, for each
bootstrap sample the average AUC associated to the
10-fold cross-validation set is computed for each of
the variables. In 10-fold cross-validation, the
balanced set of paired data is randomly partitioned
into 10 equal subsamples. The PNN is trained with
nine-tenths of the data, and the remaining single
subsample is used for testing the model, computing
the AUC. The cross-validation process is
repeated 10 times, with each of the 10 subsamples
used exactly once to compute an estimated AUC.
The ten AUC's from the folds were averaged to
produce a single estimation. The input variable with
the best average AUC is selected.
In the next step, all possible two-dimensional
vectors containing the variable selected in the
previous step are formed. A new PNN in each case
is trained and its AUC is calculated. As before, the
variable that yields the largest average AUC is
selected. The procedure continues by evaluating
each additional variable at a time, and the algorithm
finishes when the nth dimensional vector computed
from the nth step does not improve the AUC. This
process is repeated for each spread value and the
model with largest AUC is selected, storing the
variables that were selected and the corresponding
spread value. This procedure is repeated for each
one of the 100 bootstrap samples and the number of
times each input variable is selected is computed.
The final input variables are those that were selected
at least in 60% of the bootstrap samples. Figure 1
summarizes the methodology of this study.
Figure 1: Scheme of variable selection and spread of PNN.
In this study, we used the Probabilistic Neural
Network, a type of artificial neural network
appropriate for classification problems developed by
Specht (1990). This particular neural network has a
faster training than the multilayer perceptron
network. It generates accurate predicted target
probability scores, approaches Bayes optimal
classification and it is relatively insensitive to
outliers.
PNN is an implementation of the kernel
discriminant analysis statistical algorithm and it is
ProbabilisticNeuralNetworkforPredictingResistancetoHIV-ProteaseInhibitorNelfinavir
19
based on Bayesian decision to classify the input
vectors. The optimal decision rule, which minimizes
the average cost of misclassification, is called the
optimal decision rule of Bayes (Berrar et al, 2003).
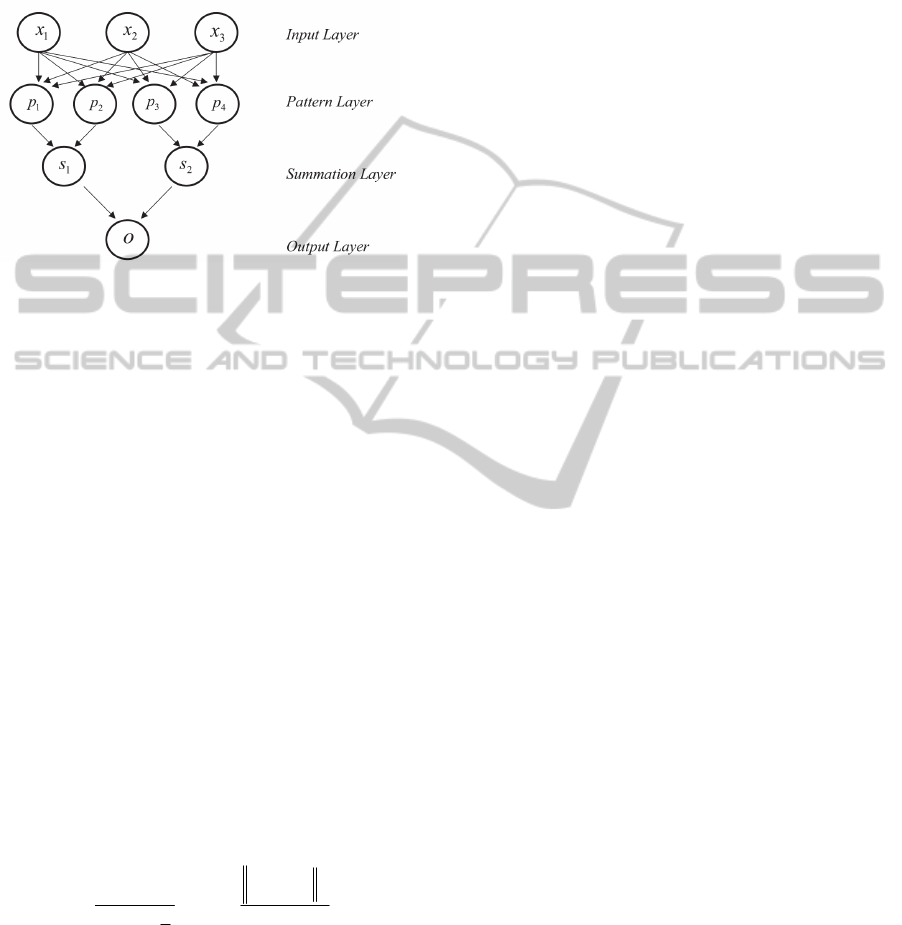
The architecture of a typical PNN is as shown in
Figure 2.
Figure 2: Basic architecture of a probabilistic neural
network.
The input layer has as many neurons as the number
of the explanatory variables, which here, initially are
the most frequent mutations found in the protease
gene associated with resistance to Nelfinavir
(positions: L10, D30, M36, M46, A71, V77, V82,
I84, N88 and L90), CD4 T cell count and viral load.
This input layer does not perform any operation on
the input vectors, and they only are used to feed the
input values to each of the neurons in the pattern
layer. The pattern layer contains one neuron for each
case in the training data set. The weights of the
neurons are the feature values describing the case
plus the class to which it belongs. Each pattern
neuron forms a dot product of the input pattern
vector with a weight vector, and then performs a
non-linear operation on the result. Each neuron
receives the input vector and estimates its
probability density function (PDF), using the Parzen
window method (Parzen, 1962). In this study, the
Gaussian function was used as THE Parzen window.
The ith kernel node in the jth group is defined as a
Gaussian basis function:
2
2
,
2
2
,
2
exp
2
1
ji
d
ji
xx
xp
(1)
where x
i,j
is the vector of the sample that is stored in
the standard unit of class i or j, d is the number of
input variables and σ is a smoothing factor that
affects the shape of the surface of the decision
network, and is known as the spread of the PNN.
The summation layer has as many processing
elements as there are classes to be recognized. This
layer sums the results separated by class that come
from the pattern layer. The output layer, which
provides the classification of the input data, makes
the decision based on the maximum probability of
the Bayes’ rule. A competitive transfer function on
the output neurons selects the node with the highest
output, and output a 1 (positive identification) for
that class and a 0 (negative identification) for non-
targeted classes.
The ROC curve analysis was used to evaluate the
classifiers and to select the optimal probability
threshold. This curve is obtained by plotting pairs of
sensitivity and false positive rate (1-specificity) at
each point (Zweig and Campbell, 1993). A model
totally incapable of discriminating values belonging
to one class or another has an AUC equal to 0.5. The
higher the model's ability to discriminate the values
to the classes, the more the curve approaches the
upper left corner of the graph and the AUC
approaches 1. Additionally we computed the
accuracy, sensitivity, specificity and positive and
negative predictive values for the final models.
The accuracy (Acc) is defined as the proportion
of correct classification by the model over the total
sample. This metric is given by the following
formula:
Acc = (TP + TN) / (TP + FP + TN + FN) (2)
where TP, FP, TN and FN are true positives, false
positives, true negatives and false negatives,
respectively.
The sensitivity (Se) is defined as the proportion
of true positives as compared to the total positive
class, whereas specificity (Sp) comprises the
proportion of true negatives in relation to the total
negative class.
Se = TP / (TP + FN) (3)
Sp = TN / (TN + FP) (4)
The classifiers were compared to two expert-based
interpretation systems, the Stanford HIV db (version
6.2.0) (Liu and Shafer, 2006) and Rega (version
8.0.2) (Van Laethem et al, 2009). The performance
of both algorithms was analysed using the same test
set used with the PNN classifiers. Stanford HIV db
classifies the results in five levels of resistance:
susceptible, potential-low, low, medium and high
resistance. The algorithm Rega, on the other hand,
ranks according to a defined cut-off, where values
below 1.25 are considered susceptible; values
greater than or equal to 1.25 represent an
intermediate resistance while values greater than 2.0
indicate high level of resistance.
BIOINFORMATICS2014-InternationalConferenceonBioinformaticsModels,MethodsandAlgorithms
20
The proposed PNN classifiers were implemented
using the MATLAB software package (MATLAB
version 7.0 with neural networks toolbox), and some
of the statistical analysis was done using the open
source R software.
3 RESULTS
The proposed combined approach of bootstrap and
10-fold cross validation was used to select the best
feature subset to predict Nelfinavir resistant cases.
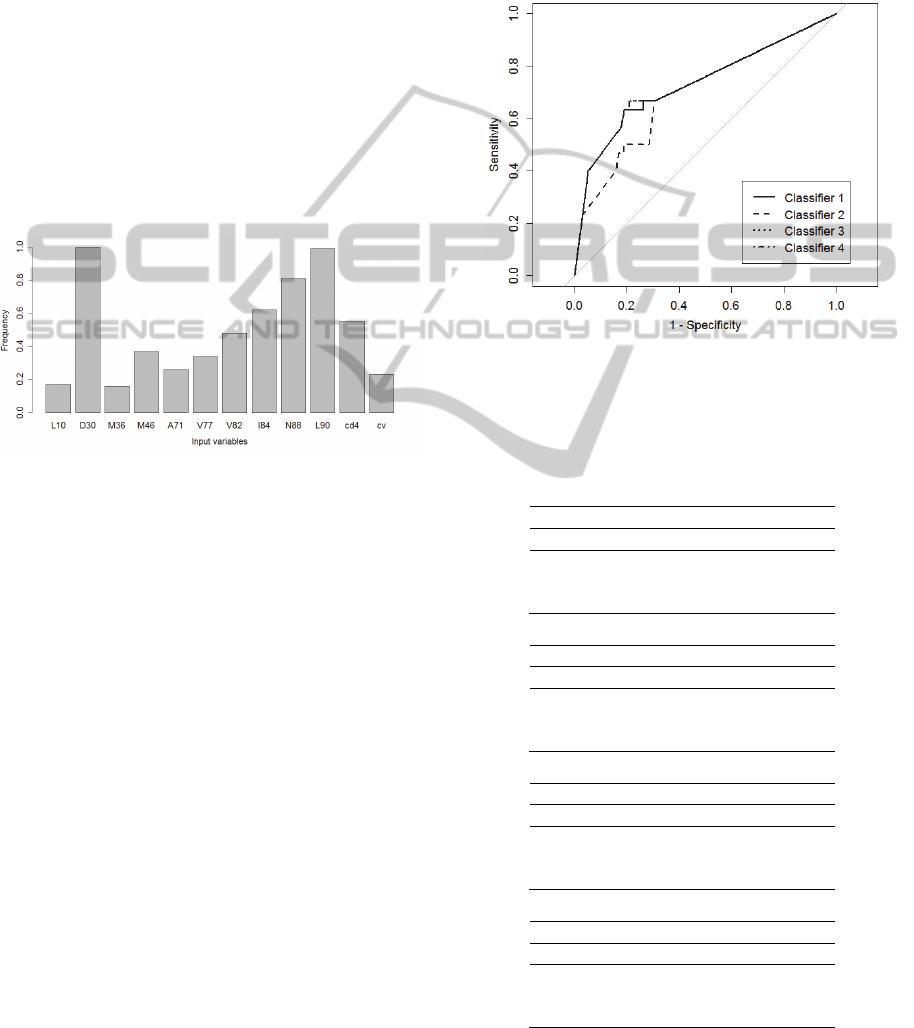
The selected features for the input vector for the
PNN classifier had only 4 mutation positions: D30,
I84, N88 and L90. The percentages that each one of
the available input variables was selected in the 100
bootstrap samples are shown in Figure 3.
Figure 3: Frequency of variables selected in the 100
bootstrap samples.
The final set of features was selected considering
from all simulations the set that was present in more
than 60% of the simulations. The spread of the PNN
was set to 0.73, the average of the 100 spreads
derived at each iteration for selecting the features.
The test set, which was not used at any stage of
the procedure for feature selection and parameter
estimation, was used to evaluate four PNN
classifiers. These classifiers were obtained by using
the same 100 resistant samples combined with a
random sample of size 100 without replacement
from the 400 non-resistant patients. Tables 3 and 4
show the performance of these classifiers. The
classifiers 3 and 4 showed the best results. Values of
sensitivity and specificity were 66.7% and 78.9%
respectively. The accuracy was 76.0% and the AUC
was 0.73. The ROC curves for the four classifiers
are shown in Figure 4.
Stanford HIV db and Rega showed three levels
of resistance for the test set: susceptible,
intermediate resistance and high level of resistance.
To compare the performance of these algorithms
with our results, the results were classified according
to two criteria: (1) samples classified as susceptible
were assigned to the class of non-resistant and
intermediate and high resistance formed the resistant
class, and (2) samples classified as susceptible or
intermediate resistance composed the class of non-
resistant and samples classified as high resistance
composed resistant class. Table 5 summarizes the
performance of these two algorithms.
Figure 4: ROC curve for the four PNN classifiers.
Classifiers 1, 3 and 4 had similar behavior.
Table 3: Distribution of patients in the test set according to
the classifiers output versus observed class (n = 125). R:
resistants; NR: non resistants.
A) Classifier 1
Observed Classes (Targets)
Outputs R (%) NR (%) Total
R 20 (16) 26 (20.8) 46
NR 10 (8) 69 (55.2) 79
Total 30 95 125
B) Classifier 2
Observed Classes (Targets)
Outputs R (%) NR (%) Total
R 15 (12) 18 (14.4) 33
NR 15 (12) 77 (61.6) 92
Total 30 95 125
C) Classifier 3
Observed Classes (Targets)
Outputs R (%) NR (%) Total
R 20 (16) 20 (16) 40
NR 10 (8) 75 (60) 85
Total 30 95 125
D) Classifier 4
Observed Classes (Targets)
Outputs R (%) NR (%) Total
R 20 (16) 20 (16) 40
NR 10 (8) 75 (60) 85
Total 30 95 125
ProbabilisticNeuralNetworkforPredictingResistancetoHIV-ProteaseInhibitorNelfinavir
21

Table 4: Performance of PNN classifiers.
AUC
Se (%) Sp (%) Acc (%)
Classifier 1
0.73
66.7 72.6 71.2
Classifier 2
0.70
50.0 81.1 73.6
Classifier 3
0.73
66.7 78.9 76.0
Classifier 4
0.73
66.7 78.9 76.0
Mean
0.72
62.5 77.9 74.2
Se: sensitivity; Sp: specificity and Acc: accuracy.
Table 5: Performance of Stanford HIVdb and Rega
algorithms.
Se (%) Sp (%) Acc (%)
Stanford HIVdb
Criterion 1 70.0 60.0 62.4
Criterion 2 66.7 70.5 69.6
Rega
Criterion 1 53.3 63.2 60.8
Criterion 2 23.3 74.7 62.4
Se: sensitivity; Sp: specificity and Acc: accuracy.
4 DISCUSSION
In the present study, we developed PNN classifiers
to predict the resistance to the antiretroviral
Nelfinavir. This analysis was done for the first time
using data from the National Genotyping Network
(RENAGENO) with a focus in the development of
predictive modeling.
Here, it was demonstrated that the Eisenberg
hydrophobicity scale is a suitable approach to
represent the HIV genotype. Additionally, with the
use of the combined proposed approach for feature
selection, we derived a reduced set of input features
that resulted, for the available data, in a classifier
with prediction performance that was greater or at
least comparable to two well-known interpretation
systems.
The available data set had fewer instances of the
resistance class compared to the susceptible or non-
resistance class. This condition is a well-known
problem for most classification algorithms (He and
Garcia, 2009). Here, we addressed this problem by
using random undersampling of the majority class.
This procedure was important to avoid the great
tendency of the model to be biased towards the
majority class. For example, if the data have a large
number of negative cases, it is likely that the
classifier will show a higher specificity than
sensitivity, which may result in a greater accuracy.
So it is important that, beyond global performance
metrics, such as AUC or Acc, other parameters
should be evaluated in a study, such as sensitivity
and specificity. The absence of these parameters
may lead to misinterpretations. Many studies do not
present these parameters, reporting only accuracy,
making it difficult to proper evaluated their results.
For instance, in a recent study, Pasomsub et al
(2010), with a feedforward artificial neural network
showed that the developed classifier had an AUC
equal to 0.94 (IC: 0.92 - 0.97) for the antiretroviral
Nelfinavir. However, they did not mention other
performance indices, such as sensitivity and
specificity, and additionally there is no mention if
their dataset is balanced or not.
In our study, the performance of the classifiers
showed accuracies ranging from 71.2 to 76.0% and
AUC ranging from 0.70 to 0.73. The four classifiers
showed very similar performances, and in all cases
they were at least comparable to the Stanford HIVdb
and Rega algorithms. In a previous work, Raposo et
al (2013) evaluated the use of a logistic regression
model with the same data of the present study. Four
models were also obtained and the performance was
inferior to the PNN model. Average performance for
the logistic was: AUC equal to 0.67, 72.4% of
accuracy, 56.7% of sensitivity and 77.4% of
specificity.
An addition issue that merits some discussion is
related with the use of balanced data set. Here, our
main interest is in a system capable to identify
resistance to a particular antiretroviral, therefore
models with higher sensitivity should be preferred.
When using unbalanced data, the PNN model
showed sensitivity and specificity equal to 50% and
93.7%, respectively. This is an expected result
considering the large number of non-resistant
individuals compared to resistants. The AUC was
0.71, similar to the balanced dataset case, but the
accuracy of 83.2% is higher, which is a result of the
unbalanced dataset. Using a global metric to
compare performance, such as AUC, there was no
major difference between using balanced or
unbalanced data. However, if we stick with the
model obtained using the unbalanced data, the
sensitivity of 50% would be equivalent to a random
chance to indicate that an individual is resistant to
the drug, in contrast with the model obtained with
balanced which has a sensitivity of 62.5%
.
5 CONCLUSIONS
This paper presented four models to predicting HIV
drug resistance. The classifiers 3 and 4 showed the
best results and achieved a sensitivity of 66.7% and
a specificity of 78.9%. The accuracy was 76.0% and
BIOINFORMATICS2014-InternationalConferenceonBioinformaticsModels,MethodsandAlgorithms
22

the AUC was 0.73.
These results show that the classifiers proposed
in this study presents similar results to the Stanford
HIV db and Rega algorithms that are used for many
clinicians to determine resistance to specific
antiretrovirals. This suggests that our models can be
used for the classification of new individuals in
relation to the development of resistance to
Nelfinavir and is a simple cost-effective tool that can
help clinicians in the management of each HIV+
individual.
REFERENCES
Barouch, D.H. 2008. Challenges in the development of an
HIV-1 vaccine. Nature 455, 7213, 613 – 619.
Beerenwinkel, N., Schmidt, B., Walter, H., Kaiser, R.,
Lengauer, T., Hoffmann, D., Korn, K. and Selbig, J.
2002. Diversity and complexity of HIV-1 drug
resistance: a bioinformatics approach to predicting
phenotype from genotype. Proc. Natl. Acad. Sci. U. S.
A. 99, 8271 – 8276.
Beerenwinkel, N. Däumer, M., Oette, M., Korn, K.,
Hoffmann, D., Kaiser, R., Lengauer, T., Selbig, J. and
Walter, H. 2003. Geno2pheno: Estimating phenotypic
drug resistance from HIV-1 genotypes. Nucleic Acids
Res. 31, 3850–3855.
Berrar, D. P., Downes, C. S. and Dubitzky, W. 2003.
Multiclass Cancer Classification Using Gene
Expression Profiling and Probabilistic Neural
Networks. In: Pacific Symposium on Biocomputing'03,
5 - 16.
Bonet, I., Garcia, M.M., Saeys, Y., Sanchez, R., Saeys, Y.,
Van de Peer, Y. and Grau, R. 2007. Predicting Human
Immunodeficiency Virus (HIV) Drug Resistance
Using Recurrent Neural Networks. In: Mira, J.,
Álvarez, J. R. (Eds.), IWINAC (1), vol. 4527, Lecture
Notes in Computer Science, 234 - 243. Springer.
Bushman, F., Landau, N.R. and Emini, E.A. 1998. New
developments in the biology and treatment of HIV.
Proc Natl Acad Sci USA 95, 19, 11041 – 11042.
Efron, B. 1979. Bootstrap methods: another look at the
jackknife. The annals of Statistics, 1-26.
Eisenberg, D., Schwarz, E., Komaromy, M., and Wall, R.
1984. Analysis of membrane and surface protein
sequences with the hydrophobic moment plot. Journal
of Molecular Biology 179, 1, 125-142.
He H. and Garcia, E.A. 2009. Learning from Imbalanced
Data. IEEE Transactions on Knowledge and Data
Engineering 21, 9, 1263-1284.
Johnson, V.A., Calvez, V., Günthard, H.F., Paredes
R., Pillay, D., Shafer, R., Wensing, A.M. and Richman
D.D. 2011. 2011 update of the drug resistance
mutations in HIV-1. Top Antivir Med 19, 4, 156 - 164.
Liu, T.F. and Shafer, R.W. 2006. Web Resources for HIV
type 1 Genotypic-Resistance Test Interpretation. Clin
Infect Dis 42, 11, 1608-1618.
Parzen, E. 1962. On estimation of a probability density-
function and mode. Ann Math Statist 33, 3, 1065 –
1076.
Pasomsub, E., Sukasem, C., Sungkanuparph, S., Kijsirikul
and B., Chantratita, W. 2010. The application of
artificial neural networks for phenotypic drug
resistance prediction: evaluation and comparison with
other interpretation systems. Jpn J Infect Dis. 63, 2, 87
- 94.
Peeters, M. 2011. The genetic variability of HIV-1 and its
implications. Transfus Clin Biol. 8, 3, 222 – 225.
Prosperi, M.C.F., Altmann, A., Rosen-Zvi, M. Aharoni,
E., Borgulya, G., Bazso, F,Sönnerborg, A., Schülter,
E., Struck, D., Ulivi, G., Vandamme, A., Vercauteren,
J. and Zazziet, M. 2009. Investigation of expert rule
bases, logistic regression, and non-linear machine
learning techniques for predicting response to
antiretroviral treatment. Antivir Ther. 14, 433-442.
Raposo, L., Arruda, M., Brindeiro, R. and Nobre, F. 2013.
Logistic Regression Models for Predicting Resistance
to HIV Protease Inhibitor Nelfinavir
XIII Mediterranean Conference on Medical and
Biological Engineering and Computing 2013, Springer
International Publishing, 41, 1237 - 1240.
Richman, D.D. 2006. Antiviral drug resistance. Antiviral
Res. 71, 117–121.
Specht, D. F. 1990. Probabilistic neural networks, Neural
Netw. 3, 1, 109 - 118.
UNAIDS 2011. How to get to zero: Faster. Smarter.
Better.
Van der Borght, K., Verheyen, A., Feyaerts, M., Van
Wesenbeeck, L., Verlinden, Y., Van Craenenbroeck,
E. and Van Vlijmen, H. 2013. Quantitative prediction
of integrase inhibitor resistance from genotype through
consensus linear regression modeling. Virology
Journal 10, 8, 1 – 12.
Van Laethem, K., Geretti, A.M., Camacho, R. and
Vandamme A.M. 2009. Algorithm for the use of
genotypic HIV-1 resistance data (version Rega
v8.0.2), from: http://rega.kuleuven.be/cev/avd/
software/rega-algorithm.
Vermeiren, H., Van Craenenbroeck, E., Alen, P.,
Bacheler, L., G. Picchio, G. and Lecocq, P. 2007.
Prediction of HIV-1 drug susceptibility phenotype
from the viral genotype using linear regression
modeling. J Virol Methods 145, 1, 47 – 55.
Wang, D. and Larder, B. 2003. Enhanced prediction of
lopinavir resistance from genotype by use of artificial
neural networks. J Infect Dis. 188, 5, 653 - 660.
Zweig, M.H. and Campbell, G. 1993. Receiver-operating
characteristic (ROC) plots: a fundamental evaluation
tool in clinical medicine. Clin Chem 39, 4, 561 - 577.
ProbabilisticNeuralNetworkforPredictingResistancetoHIV-ProteaseInhibitorNelfinavir
23
