
Statistical Identification of Co-regulatory Gene Modules using
Multiple ChIP-Seq Experiments
Xi Chen
1
, Xu Shi
1
, Ayesha N. Shajahan-Haq
2
, Leena Hilakivi-Clarke
2
,
Robert Clarke
2,3
and Jianhua Xuan
1
1
Department of Electrical and Computer Engineering, Virginia Tech, Arlington, VA 22203, U.S.A.
2
Lombardi Comprehensive Cancer Center, Department of Oncology, Georgetown University,
Washington, DC 20057, U.S.A.
3
Department of Physiology and Biophysics, Georgetown University, Washington, DC 20057, U.S.A.
Keywords: ChIP-Seq, TFBS, Target Genes, MCMC, Co-regulatory Modules.
Abstract: ChIP-Seq experiments provide accurate measurements of the regulatory roles of transcription factors (TFs)
under specific condition. Downstream target genes can be detected by analyzing the enriched TF binding
sites (TFBSs) in genes’ promoter regions. The location and statistical information of TFBSs make it
possible to evaluate the relative importance of each binding. Based on the assumption that the TFBSs of one
ChIP-Seq experiment follow the same specific location distribution, a statistical model is first proposed
using both location and significance information of peaks to weigh target genes. With genes’ binding scores
from different TFs, we merge them into a weighted binding matrix. A Markov Chain Monte Carlo (MCMC)
based approach is then applied to the binding matrix for co-regulatory module identification. We
demonstrate the efficiency of our statistical model on an ER-α ChIP-Seq dataset and further identify co-
regulatory modules by using eleven breast cancer related TFs from ENCODE ChIP-Seq datasets. The
results show that the TFs in individual module regulate common high score target genes; the association of
TFs is biologically meaningful, and the functional roles of TFs and target genes are consistent.
1 INTRODUCTION
Chromatin immunoprecipitation with massively
parallel DNA sequencing (ChIP-Seq) has greatly
advanced the regulation mechanism analysis by
identifying transcription factor binding sites
(TFBSs) of specific protein of interest (Park, 2009).
This technology helps biologists investigate that
how proteins interact with DNA to regulate gene
expression, which is essential for understanding
many biological processes and disease states.
Recently, to examine the principles of the human
cancer transcriptional regulatory network, many
ChIP-Seq experiments are being carried out in
various cancer cells to test hundreds of TFs under
different treatment conditions (Dunham et al., 2012;
Hurtado et al., 2011; Ross-Innes et al., 2010; Schultz
et al., 2010). With resources from the ENCODE
project (Dunham et al., 2012), researchers can now
investigate different TFs simultaneously under the
same cell type (Gerstein et al., 2012).
For ChIP-Seq data analysis, several motif searching
tools (Bailey et al., 2006; Heinz et al., 2010) are
widely used for both known motifs enrichment and
de novo motif discovery. In target gene annotation
(McLean et al., 2010; Salmon-Divon et al., 2010),
however, only the distance between the peak
location and the transcription starting site (TSS) of
its target gene is utilized to establish gene regulation.
As a result, over one thousand target genes are
obtained but no rank information provided. A
narrowed down gene list with fewer false positives
is desirable for biologists to perform further
validation. To tackle this issue existing in current
target gene identification, new methods utilizing
more information from the peak files are developed.
A reasonable assumption used in the TIP method
(Cheng et al., 2011) is that TFBSs in target genes’
promoter region would follow the same position-
specific probability distribution. But it is known that
only a portion of the TFBSs contain the TF
associated motifs, usually constituting 20 ~30% of
all peak files (Bailey et al., 2006; Heinz et al., 2010).
109
Chen X., Shi X., N. Shajahan-Haq A., Hilakivi-Clarke L., Clarke R. and Xuan J..
Statistical Identification of Co-regulatory Gene Modules using Multiple ChIP-Seq Experiments.
DOI: 10.5220/0004736801090116
In Proceedings of the International Conference on Bioinformatics Models, Methods and Algorithms (BIOINFORMATICS-2014), pages 109-116
ISBN: 978-989-758-012-3
Copyright
c
2014 SCITEPRESS (Science and Technology Publications, Lda.)

In that case, it is hard to assert that the TFBSs
without similar sequence pattern would follow the
same location-specific distribution. The false
positives in the peak files will contaminate observed
TFBS’s distribution. Furthermore, TIP only utilizes
each peak’s location information, regardless its
significance. The p-value of each peak indicates the
confidence of the current TFBS. If all the peaks
were treated equally when we generated the TFBS’s
location specific distribution, the low confident
peaks would lower the sensitivity of the target gene
identification. To improve these potential
weaknesses in TIP method, we proposed a more
rigorous hypothesis that the TFBSs containing
similar motifs should follow the same position-
specific distribution, and developed a statistical
model by incorporating peak’s both location and
statistics information to reveal the weight of each
gene. This approach offers a statistical inspection of
the binding relationship between enriched TFBSs
and associated target genes.
With the accumulation of ChIP-Seq data sets, we
can investigate the co-association among multiple
TFs and further identify co-regulatory modules.
Previous studies in location correlation of peak files
from multiple ChIP-Seq data sets provide evidence
for different TFs’ co-association (Gerstein et al.,
2012). The module identification is an on-going
topic for regulatory network analysis. Biclustering
methods (Turner et al., 2005) (Ihmels et al., 2004)
are widely used to provide multiple local optimal
solutions for module identification. They could
provide a quick view about the distribution of major
modules in a global picture. However, most
biclustering methods are unsupervised and use
different criteria to select final modules, therefore at
the gene level, the module size is not well controlled
and the results are provided without any rank
information regarding the difference among genes.
In this study, we further proposed a Markov
Chain Monte Carlo (MCMC) based approach to
investigate co-regulation mechanism. By clustering
the TFs into several candidate groups, a large
binding network is divided into several sub-
networks. Then, searching for multiple local optimal
modules in the entire binding network is equivalent
to identifying individual global optimal module in
each sub-network. In each sub-network, we used an
MCMC based approach to identify high confident
co-regulated genes. To overcome the over-fitting of
clustering methods, which actually provides non-
overlap TF clusters, we carried out a TF refinement
step by adding or deleting TFs randomly to highly
confident genes and checking the contribution of
each TF in our list to enforce co-regulation in
current module. By repeating these two steps for all
sub-networks, we identified a list of co-regulatory
modules with co-associated TFs and high confidence
target genes. Our method allows overlap among
modules at both TF and gene levels, which were not
included in earlier studies (Segal et al., 2003; Su et
al., 2010). To validate our method, we applied the
proposed scheme to analyse eleven breast cancer
related TFs’ ChIP-Seq datasets obtained from the
ENCODE project. Our computational results are
well supported by available biological literatures and
provide a detailed interpretation for the regulation
mechanism of selected TFs in breast cancer.
2 METHODS
First of all, for each TF’s ChIP-Seq experiment, we
calculated the target gene scores by using the peak
files reported by MACS, and generated gene
annotation file from GREAT (McLean et al., 2010).
A binding matrix is formed with binding scores as
units. Secondly, we applied affinity propagation
clustering (APC) (Frey and Dueck, 2007) to classify
the columns (TFs) of the matrix, and extracted sub-
networks with associated TFs and genes. Then, an
MCMC based approach was used to identify the
genes regulated by each cluster of TFs with high
score. Finally, after target gene selection, we applied
another round of sampling by adding or deleting TFs
dynamically to refine the regulators in each module.
2.1 Data Pre-processing
We downloaded the peak files processed by MACS
for the selected breast cancer TFs from the
ENCODE (http://genome.ucsc.edu/ENCODE/). The
information we extracted from these peak files
includes peak’s start, end, summit, summit height
and the significance p-value. To lower the impact of
false positive peaks, for each TF, we used HOMER
(Heinz et al., 2010) to isolate the peaks enriched by
Figure 1: Flowchart of the proposed approach for
regulatory module identification.
BIOINFORMATICS2014-InternationalConferenceonBioinformaticsModels,MethodsandAlgorithms
110

TF associated motifs. For gene annotation, with user
specified upstream and downstream promoter
region, GREAT was used to generate peak
annotations with distance information.
2.2 Gene’s Binding Score Calculation
Given the input ChIP-Seq data, we proposed a
statistical model to evaluate each target gene’s
relative importance based on the observations from
specific TF’s ChIP-Seq data, as detailed in Eq. (1):
() 1
,| ,|
g
gg
loca i
P
Gene peak input P Gene i input
(1)
where
() 1
g
loca i
indicates that i-th base with
respect to TSS of g-th gene is covered by a peak.
Each peak is composed by several hundreds of bases
and each location follows the location specific
probability distribution. Thence, the probability for
each peak equals to the sum of the probability of all
the bases it covers. Further, considering the
conditional relationship of two steps, peak calling
and gene annotation, Eq. (1) can be extended as:
() 1
,| ,
g
gg
loca i
P
Gene peak input P Gene i input P i input
(2)
There are two components for this joint
probability.
(|,)
g
P Gene i input
is the conditional
probability that g-th gene is a true target given by
the significant binding signal (peak) at i-th base.
While
(| )
P
i input
is the relative importance of i-th
base indicated by the TFBS location specific
distribution. Here the prior probability of P(input) is
set as constant value for all locations.
Probability
(|,)
g
P Gene i input
can be calculated by
the read depth at i-th base and its associated
significance score. The read depth h
g
(i) of i-th base
can be estimated by a triangle approximation as
shown in Fig. 2 and Eq. (3).
(a) (b)
Figure 2: Typical binding site locations with respect to
TSS: (a) TFBS occurs likely at upstream region with
~10kbps to TSS, (b) or downstream but close to TSS,
usually within 1kbps.
where RD
summit
is the reported peak height by peak
calling tool.
s
tart
,
s
ummit
and
end
, as shown in
,
()
,
summit
g
summit
istart
R
D start i summit
summit start
hi
end i
RD summit i end
end summit
(3)
Fig. 2, are the start, summit and end positions of
each reported peak, respectively.
The significance p-value is actually a probability
and cannot be directly used. We used an exponential
distribution to fit the p-value as in Eq. (3) with λ=1.
For g-th gene, q
g
(i) is used to weight the read depth
h
g
(i) at i-th base as Eq. (4):
() exp[ ()]
gg
p-value i q i
(4)
After the normalization with constant value C
(considering the maximum value of peak height and
q score), the conditional probability that g-th gene
can be linked with binding signal observed at i-th
base, which can be calculated as:
,()()/
ggg
P Gene i input h i q i C
(5)
Probability
(| )
P
i input
evaluates the prior
probability of i-th base according to the statistics of
read depth and significance of all peak files. To
generate location specific distribution, we pile up all
genes’ binding signals at i-th base with respect to the
TSS as Eq. (6).
() () () ()
gg gg
gig
Piinput h iq i h iq i
(6)
Compared to the TIP method, in our case the
binding signal at each location is associated with a
weight transformed from its significance. It will
lower the impact of false positive peaks in TFBS’s
distribution along the promoter region.
Given the TFBS distribution in Eq. (6) and
binding signals at each base, similar to Eq. (1), the
g-th gene’s regulatory score can be calculated as:
() 1
() ()
g
ggg
loca i
s
h i q i P i input
(7)
2.3 Module Identification
Module identification problem is to search for
multiple local optimal regulatory networks. In this
paper, we proposed an MCMC based scheme to
identify co-regulatory gene modules. As shown in
Fig. 3, there are three main steps: (1) use APC to
cluster TFs into candidate groups and generate initial
modules; (2) using MCMC to mimic the Markov
process at gene level in each module to identify high
confident co-regulated genes; (3) based on the genes
identified from (2), sampling all TFs to refine the
TFs in each module by adding new TFs or deleting
StatisticalIdentificationofCo-regulatoryGeneModulesusingMultipleChIP-SeqExperiments
111

TF
Gene
i
TF
j
TF
Figure 3: Flowchart of regulatory module identification:
(1) TF clustering; (2) MCMC based gene identification;
(3) TF refinement by using sampling techniques. For
example, Gene 5 will be rejected during the MCMC
process due to its low gene score; in the TF refinement
step, TF 4 gets little support from the target level and it is
deleted; but TF 5, which is not covered by clustering
results for current module, is added because it also
regulates a large portion of genes in current module.
low confident ones. In this way, the multiple local
optimal solutions in the whole binding network are
equivalent to individual global optimal solution in
each associated sub-network.
In each module, during the MCMC process, each
state represents a sampled sub-network with fixed
up-stream regulators and sampled downstream
genes. According to Metropolis sampling algorithm,
for state transition, we proposed a new sub-network
by randomly adding or deleting one gene to current
sub-network. Then, we either accept the proposed
sub-network or keep current network by checking
whether the overall binding intensity is improved.
The state of Markov process is updated accordingly,
and we carry out next round of sampling. Finally,
the Markov process should converge to a sub-
network or a module with strongly co-regulated
genes.
For the m-th cluster with T
m
TFs, we define a
sub-network score as:
,,
11
1
m
T
G
nnggt
gt
nm
Sfs
GT
(8)
where f
n
is a binary vector with length of total gene
number G. In the n-th round of sampling, if g-th
gene is covered by current module, f
n,g
equals to 1,
otherwise it equals to 0. In Eq. (8), the sum of non-
zero units of f
n
is G
n
. Initially we randomly select G
0
genes and sub-network score is S
0
.
In the n-th round of MCMC process, a new sub-
network is proposed by randomly adding or deleting
one gene. The prior probability for adding or
deleting is 0.5. Whether such an adjustment
contributes to co-regulatory characteristic of current
module is determined by the acceptance criterion
defined as follows:
,, 1,,
11 11
1
1
11
mm
TT
GG
n
ng gt n g gt
gt gt
nn
n
S
fs f s
GG
S
(9)
where S
n
and S
n-1
represent sub-module scores for
the proposed sub-module and current sub-module,
respectively. G
n
and G
n-1
are associated numbers of
genes. Here, if α is larger than 1, we accept the
proposed sub-module; else, we accept the proposed
module by probability α. If the proposed sub-module
is rejected, we directly set f
n
= f
n-1
for next round.
After N rounds of sampling, we generate a series
of
|1
n
f
nN
. When N is large enough, the
posterior distribution condition on current module
for g-th gene is proportional to the count of its
appearance as F
g
during the MCMC process:
,
1
1
N
g
ng
n
F
f
N
(10)
With selected top G
m
genes according to F
g
, we
used a sampling method to refine TFs. Using
clustering result as initial TF selection, in k-th
sampling, we randomly added a new TF or deleted a
current TF to current module. Similar to the
definition of Eq. (9), we determined whether the
proposed addition or deletion was accepted or not
according to the binding intensity in current module.
The result was recorded in vector h
k
. Finally, a series
of
|1
k
hkK
were generated. For t-th TF, we
calculated sampling statistics H
t
by summing all h
k,t
.
The distribution of all TFs’ H score reflected the
contribution of each TF to the co-regulation in
current module. We adjusted the TFs by adding new
high score TFs and deleting low score ones. Our
method allows overlap at both gene and TF levels
among different modules. A common TF may
regulate different genes in several modules and
achieve distinct functional roles.
3 RESULTS
3.1 TFBS Location Distribution
Here, we present three TFBS distributions calculated
by our method and another TFBS distribution
calculated by TIP for comparison. By comparing the
distributions between Fig. 4(a) and Fig. 4(b), it can
be seen that MYC associated TFBSs share common
BIOINFORMATICS2014-InternationalConferenceonBioinformaticsModels,MethodsandAlgorithms
112
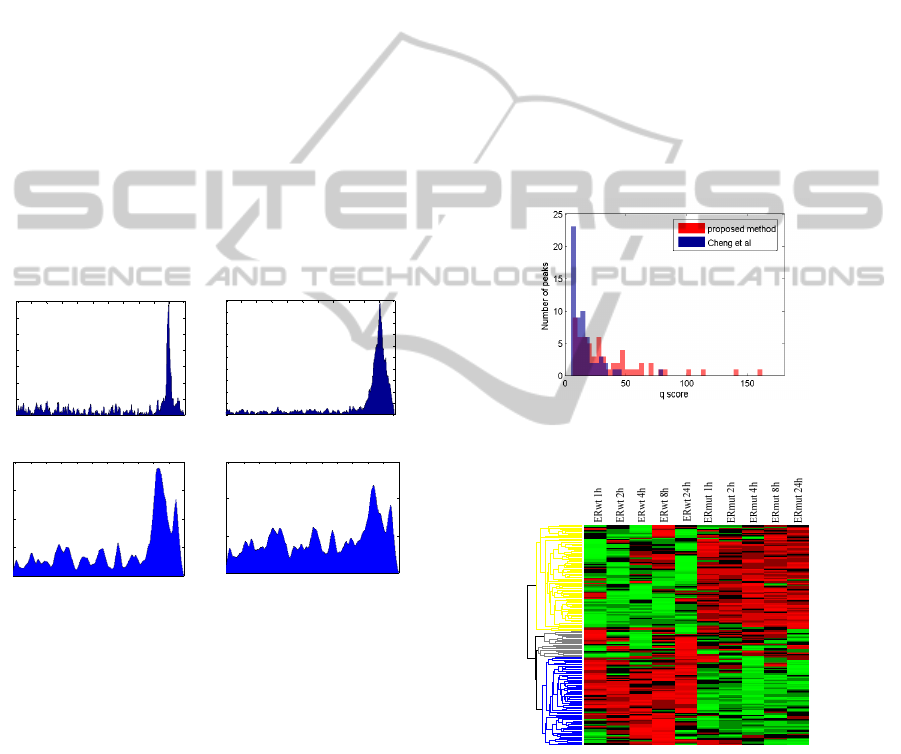
features in different environments (ovarian cancer
cell vs. breast cancer cell). In Fig. 4(a), the
distribution shows a high single sharp peak centred
on TSS, compared to a wider but still single peak at
the same location in Fig. 4(b). Different from MYC,
the ER-alpha’s distribution in Fig. 4(c) shows that
remote binding still has a high probability to occur
and plays important roles in target gene regulation.
Besides the main peak around TSS, another high
probability region appears around 500bps, which is
similar to Fig. 4(a). This observation shows that a
binding within a short range after TSS will also
activate the regulation. If we compare Fig. 4(c) with
the distribution generated by TIP in Fig. 4(d), our
distribution shows a higher probability near TSS and
that all the features such as high probability of
remote binding points are kept. It is well known that
most TFBSs bind close to TSS, i.e. within 2kbps.
But in Fig. 4(d), the distribution is more flat. The
sensitivity of TIP’s distribution is lower due to
assigning equal weight to low significant peaks, a
large portion of which is located far from TSS.
(a)
(b)
(c) (d)
Figure 4: TFBS location specific probability distribution
from upstream -10k to downstream 1k with respect to
TSS: (a) MYC in ovarian cancer cell (in house data); (b)
MYC in MCF-7 breast cancer cell line from the Encode
project; (c) ER-alpha in MDA-MB-231 breast cancer cell
line (Stender, et al., 2010); (d) the same data as (c) but
calculated by the TIP method.
3.2 ER-α ChIP-Seq Data Validation
In this section, we utilized a human ER-α dataset
(Stender et al., 2010) to prove that target genes
identified by our method is not only intensely
regulated by the TF under investigation, but also
functional expressed. From the analysis done by
(Stender et al., 2010), we know that the ER-α
binding genes should have significant expression
change between wide type ER binding (ERwt) and
mutant ER binding (ERmut) conditions. We
calculated binding scores for 612 ERE motif
enriched genes by using our method and TIP,
respectively. We selected top 25%, 177 genes for
further comparisons.
Usually we have more confidence on the high
significant peak files. Thence, it is necessary to
check q scores of identified genes’ peaks (defined by
Eq. (4)). As shown in Fig. 5, our method utilizes
more significant peak files (the red bar) to identify
high score genes. And some relatively low
significant peaks are still used due to their high
location prior in the TFBS distribution. TIP misses
some highly significant peaks because a larger
number of low significant peaks are equally
weighted when the location distribution is generated.
The impact of false positive peaks is raised in TIP.
Figure 5: Significance score distribution of the binding
peaks used to identify high score target genes.
1
h
2
h
4
h
8
h
4
h
h
2
h
4
h
8
h
4
h
3
1
6
9
1
1
9
1
1
1
1
1
7
9
2
1
4
8
6
1
4
2
8
1
1
9
1
1
4
2
1
1
1
4
5
8
7
1
1
8
4
8
6
4
1
1
5
5
3
4
5
1
8
1
2
1
6
3
1
1
9
1
9
1
6
3
7
7
1
5
4
1
4
6
3
7
1
1
3
3
1
1
2
1
1
2
1
1
1
1
1
7
1
7
3
9
2
7
1
1
1
1
6
8
1
1
1
1
5
1
1
1
7
2
1
1
1
5
1
1
1
9
1
1
1
8
8
5
3
6
9
1
1
1
1
4
2
8
1
2
5
1
6
6
1
1
1
5
1
3
1
1
1
1
1
1
9
7
Figure 6: ER-α ChIP-Seq data analysis, heat map of
identified genes’ expression under two conditions.
There is still some gap to claim that the more
significant peaks that we used, the more strongly our
identified genes are regulated by the TF under
investigation. A true/functional binding will either
activate or inhibit its target gene’ expression.
Thence, in the second step, we have checked that
whether our identified target genes have significant
fold change when their upstream regulator ER-α is
1k0 -1k-2k-3k-4k-5k-6k-7k-8k-9k-10k
0
0.2
0.4
0.6
0.8
1
1.2
1.4
x 10
-3
bps
PDF
1k0 -1k-2k-3k-4k-5k-6k-7k-8 k-9k-10k
0
0.1
0.2
0.3
0.4
0.5
0.6
0.7
0.8
0.9
1
x 10
-3
bps
PDF
1k0-1k-2k-3k-4k-5k-6k-7k-8k-9k-10k
0
1
2
3
4
x 10
-4
bps
PDF
1k0-1k-2k-3k-4k-5k-6k-7k-8k-9k-10k
0
1
2
x 10
-4
bps
PDF
StatisticalIdentificationofCo-regulatoryGeneModulesusingMultipleChIP-SeqExperiments
113
muted. The heatmap of our identified genes’
expression profiles are shown in Fig. 6. It can be
seen that, most of the genes have significant fold
change between ERwt and ERmut conditions. We
compared the z-score distribution of our identified
top 177 genes, TIP identified top 177 genes, to all
612 candidate targets, respectively. Based on
Kolmogorov–Smirnov test, we observed that the
distribution of our results supported that it was a
significant subset with p-value 8.7e-3, while the p-
value of the genes identified by TIP was 4.1e-2. It is
evident that our identified genes are more
functionally expressed.
3.3 Co-regulatory Module
Identification
From ENCODE, we downloaded the ChIP-Seq data
of 11 breast cancer related TFs, which are carried
out on MCF7 breast cancer cell line, including
CEBPB, ELF1, EP300, FOXM1, GATA3, HAE2F1,
JUND, MAX, MYC, TCF4 and TCF12. Due to the
multiple possible motifs associated with some TFs,
with HOMER, we collected 36 motifs. Totally there
are 11,957 target genes annotated by GREAT with
upstream 10k and downstream 1k distance control.
After genes’ binding score calculation, we generated
a weighted binding matrix for module identification.
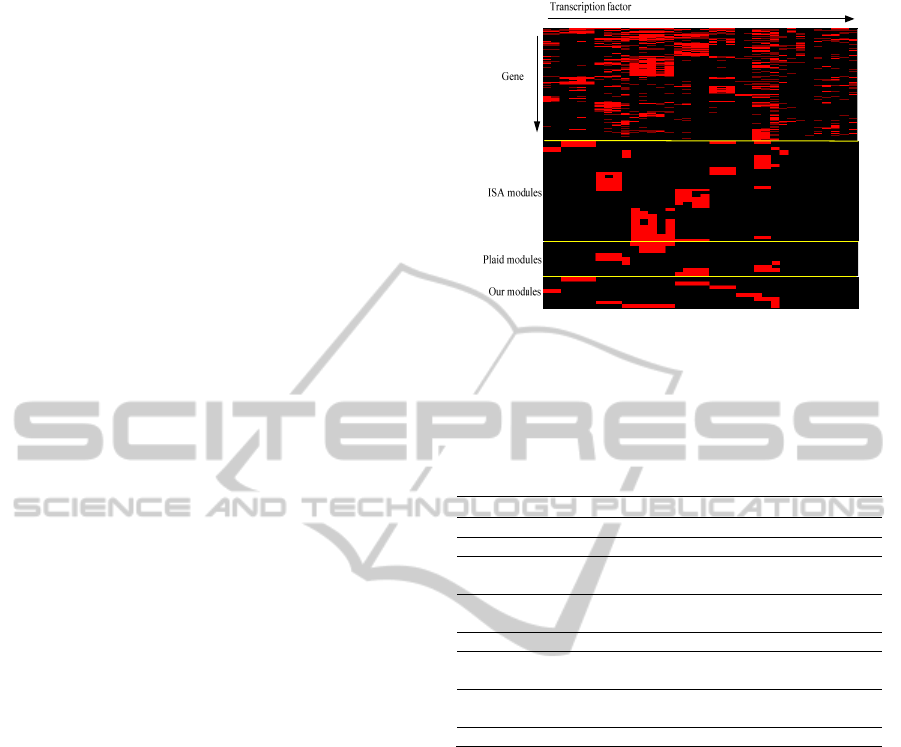
3.3.1 Comparison with Biclustering
To compare the performance of our module
identification method with that of biclustering
methods, we selected two widely used methods,
Plaid (Turner et al., 2005) and ISA (Ihmels et al.,
2004). Each method is carried out on the weighted
binding matrix, and finally, ISA, Plaid and our
method identify 36, 9 and 8 modules, respectively.
The overall binding pattern and three method’s
results are shown in Fig. 7, where the red unit
indicates binding occurrence. For our method, the
motif name and the number of genes identified in
each module are summarized in Table 1. The results
before and after TF refinement are presented as well.
In Fig. 7, it can be found that ISA is more
sensitive to the data matrix and provides quite
diverse biclustering results. We can see that there are
a lot of sub-modules in each dominant one.
Furthermore, its gene list is not well refined so that
the gene set in each module is too large to be further
investigated. The average number of genes is 1,923.
By comparing the results of ISA to the overall
binding pattern, the module containing TCF3 and
TCF4 is missed. Plaid provides isolated but
AP1
JUNAP1
GATA1
GATA4
GATA3
GATA2
E2F1
E2F4
E2F6
MYB
ELF1
GABPA
ELK1
ETS1
ELK4
MYC
cMYCL
cMYC
MAX
FOXA1L
FOXA2
FOXA1
TCF3
TCF4
AP2alpha
A
P2gamma
SP1
BMYB
STAT4
nMYC
TCF12
RMYB
CEBPAP1
CEBPB
NF1
FOXO1
Figure 7: Co-association patterns for multiple motifs and
identified modules of ISA, Plaid and our proposed
method.
Table 1: Summary of identified co-regulatory modules.
Module Gene* Motif name†
1 207/2200 AP1, JUNAP1, (TCF12)
2 588/4875 AP2alpha, AP2gamma, [SP1]
3 720/7961
ELF1 ELK1 ELK4 ETS1 GABPA
MYB [SP1] (FOXO1 BMYB)
4 610/4990
FOXA1 FOXA1L FOXA2
(CEBPAP1 CEBPB RMYB STAT4)
5 642/6466 E2F1, E2F4, E2F6, SP1
6 256/2849
GATA1, GATA2, GATA3, GATA4,
(NF1)
7 333/2775
MAX, MYC, cMYC, cMYCL,
(nMYC)
8 152/544 TCF3, TCF4, [AP2alpha]
*selected gene set/original gene set; † (.) denotes the deleted
TFs after sampling while [.] denotes the added TFs.
dominant modules. The number of genes in
individual module is 600 on average. It provides a
clear picture about the main modules with strong co-
regulation. However, it did miss some less dominant
but still important modules, i.e. modules 1, 4, 6 and
8 in Table 1. Our method not only captures all
important modules reported by ISA and Plaid, but it
also identifies their missed modules. TF refinement
plays quite an important role in the results
improvement. For example, without TF deletion, we
would include some noisy TFs like FOXO1 and
BMYB in module 3, which is not covered by
biclustering methods. ISA and Plaid also report that
AP2alpha and AP2gamma should be combined with
SP1 as a module, which is missed by clustering step.
Another significant advantage of our method is that
we can provide rank information in each module for
further gene selection.
BIOINFORMATICS2014-InternationalConferenceonBioinformaticsModels,MethodsandAlgorithms
114

3.3.2 Result Interpretation
To better understand the regulation mechanism of
this breast cancer case study, we used functional
annotations to investigate co-regulatory modules, as
shown in Fig. 8. It is not strange that AP1 and
JUNAP1 are grouped together. It is known that
increased c-Jun activity is sufficient to trigger
apoptotic cell death (Bossy-Wetzel et al., 1997) and
plays an important role in the apoptosis pathway in
cancer (Bjornsti and Houghton, 2004). In module 2,
there is evidence for the co-existence of transcription
factors AP2 and SP1 in the promoter region of some
important genes in breast cancer (Liu et al., 2009).
ELF1, ELK1, ELK4, ETS1 and GABPA, a group of
ETS family TFs, are grouped with MYB and SP1 by
support of high score common genes in Module 3.
ETS1 activity is modulated by interactions with a
number of factors, including SP1 and MYB
(Wasylyk et al., 2002). FOXA1 and FOXA2 seem to
have at least in part redundant roles and modulate
the transcriptional activity of nuclear hormone
receptors (Bochkis et al., 2012). Module 5 is the
second largest module in this study. The fact that
promoters of growth and cell cycle regulated genes
frequently carry binding sites for transcription
factors of the E2F families and SP1 provides
evidence for what we observed in this module. DNA
repair, DNA replication and cell cycle are the top
functional groups enriched with p-value 4.75e-9,
1.59e-9 and 4.47e-6, respectively. This is consistent
to the report that E2F directly links cell cycle
progression with the coordinate regulation of genes
essential for both the synthesis of DNA as well as its
surveillance (Ren et al., 2002). Module 6 is
regulated by GATA family. While, in this data set,
the GATA related motifs are extracted from ChIP-
Seq file of GATA3, recently identified as one of the
three genes mutated in >10% of breast cancers.
Module 7 promotes a pair of well-known tumor
Figure 8: Identified 8 regulatory modules in the breast
cancer study.
related TFs, MYC and MAX. The transcriptionally
active MYC/MAX dimer promotes cell proliferation
as well as apoptosis (Amati and Land, 1994). In
Module 8 AP2alpha are combined with TCF3 and
TCF4 with high confidence. It is reported that AP-
2α inhibits β -catenin/TCF4 transcriptional activity
in colorectal cancer cells (Li and Dashwood, 2004),
might serve as a novel therapeutic target in cancers
with Wnt signalling.
4 DISCUSSIONS
In this study, we proposed a statistical method to
identify gene co-regulatory modules with multiple
ChIP-Seq experiments. However, the false positive
rate in genes identified from ChIP-Seq study still
needs some effort to improve. For example,
researchers are greatly interested in cancer
recurrence by using different technologies on
multiple data sets to compare different features of
genes in more than one treatment groups. A proper
way is to incorporate gene expression or RNA-Seq
data in the module identification process. With
multiple gene expression samples belonging to early
recurrence or late recurrence in cancer treatment, we
could identify co-regulated and differentially
expressed genes modules. This would link the
physical protein-DNA binding to functional
expression of target genes more intensely. Further, if
combined with time course expression data, it would
help us uncover the regulatory mechanism of
specific drug for cancer treatment.
5 CONCLUSIONS
In this study, we have developed a statistical scheme
to identify co-regulatory gene modules from
multiple ChIP-Seq experiments of TFs. We
developed a statistical model to calculate scores for
the target genes regulated by individual TF. The
TFBS distribution shows that it is condition specific
under different environment. Then, an MCMC
approach is proposed for co-regulatory module
identification. We have used a breast cancer case
study to show that our method is more advanced
than biclustering technology. Finally, through
functional annotations, it is shown that the identified
genes and TFs in each module are closely related by
their common functions, and different modules
participate in different functional roles in the
development of breast cancer.
StatisticalIdentificationofCo-regulatoryGeneModulesusingMultipleChIP-SeqExperiments
115

ACKNOWLEDGEMENTS
This work is supported in part by National Institutes
of Health (NIH) [CA149653, CA149147 and
CA164368].
REFERENCES
Amati, B. and Land, H. (1994) Myc-Max-Mad: a
transcription factor network controlling cell cycle
progression, differentiation and death, Current opinion
in genetics & development, 4, 102-108.
Bailey, T. L., et al. (2006) MEME: discovering and
analyzing DNA and protein sequence motifs, Nucleic
acids research, 34, W369-373.
Bjornsti, M. A. and Houghton, P. J. (2004) The TOR
pathway: a target for cancer therapy, Nature reviews.
Cancer, 4, 335-348.
Bochkis, I. M., et al. (2012) Genome-wide location
analysis reveals distinct transcriptional circuitry by
paralogous regulators Foxa1 and Foxa2, PLoS
genetics, 8, e1002770.
Bossy-Wetzel, E., Bakiri, L. and Yaniv, M. (1997)
Induction of apoptosis by the transcription factor c-
Jun, The EMBO journal, 16, 1695-1709.
Cheng, C., Min, R. and Gerstein, M. (2011) TIP: a
probabilistic method for identifying transcription
factor target genes from ChIP-seq binding profiles,
Bioinformatics, 27, 3221-3227.
Dunham, I., et al. (2012) An integrated encyclopedia of
DNA elements in the human genome, Nature, 489, 57-
74.
Frey, B. J. and Dueck, D. (2007) Clustering by passing
messages between data points, Science, 315, 972-976.
Gerstein, M. B., et al. (2012) Architecture of the human
regulatory network derived from ENCODE data,
Nature, 489, 91-100.
Heinz, S., et al. (2010) Simple combinations of lineage-
determining transcription factors prime cis-regulatory
elements required for macrophage and B cell
identities, Molecular cell, 38, 576-589.
Hurtado, A., et al. (2011) FOXA1 is a key determinant of
estrogen receptor function and endocrine response,
Nature genetics, 43, 27-33.
Ihmels, J., Bergmann, S. and Barkai, N. (2004) Defining
transcription modules using large-scale gene
expression data, Bioinformatics, 20, 1993-2003.
Li, Q. and Dashwood, R. H. (2004) Activator protein
2alpha associates with adenomatous polyposis
coli/beta-catenin and Inhibits beta-catenin/T-cell factor
transcriptional activity in colorectal cancer cells, The
Journal of biological chemistry, 279, 45669-45675.
Liu, R., et al. (2009) Transcription factor specificity
protein 1 (SP1) and activating protein 2alpha (AP-
2alpha) regulate expression of human KCTD10 gene
by binding to proximal region of promoter, The FEBS
journal, 276, 1114-1124.
McLean, C. Y., et al. (2010) GREAT improves functional
interpretation of cis-regulatory regions,
Nature
biotechnology, 28, 495-501.
Park, P. J. (2009) ChIP-seq: advantages and challenges of
a maturing technology, Nature reviews. Genetics, 10,
669-680.
Ren, B., et al. (2002) E2F integrates cell cycle progression
with DNA repair, replication, and G(2)/M
checkpoints, Genes & development, 16, 245-256.
Ross-Innes, C. S., et al. (2010) Cooperative interaction
between retinoic acid receptor-alpha and estrogen
receptor in breast cancer, Genes & development, 24,
171-182.
Salmon-Divon, M., et al. (2010) PeakAnalyzer: genome-
wide annotation of chromatin binding and
modification loci, BMC bioinformatics, 11, 415.
Schultz, D. J., et al. (2010) Anacardic acid inhibits
estrogen receptor alpha-DNA binding and reduces
target gene transcription and breast cancer cell
proliferation, Molecular cancer therapeutics, 9, 594-
605.
Segal, E., et al. (2003) Module networks: identifying
regulatory modules and their condition-specific
regulators from gene expression data, Nature genetics,
34, 166-176.
Stender, J. D., et al. (2010) Genome-wide analysis of
estrogen receptor alpha DNA binding and tethering
mechanisms identifies Runx1 as a novel tethering
factor in receptor-mediated transcriptional activation,
Molecular and cellular biology, 30, 3943-3955.
Su, J., Teichmann, S. A. and Down, T. A. (2010)
Assessing computational methods of cis-regulatory
module prediction, PLoS computational biology, 6,
e1001020.
Turner, H. L., et al. (2005) Biclustering models for
structured microarray data, IEEE/ACM transactions on
computational biology and bioinformatics / IEEE,
ACM, 2, 316-329.
Wasylyk, C., et al. (2002) Sp100 interacts with ETS-1 and
stimulates its transcriptional activity, Molecular and
cellular biology, 22, 2687-2702.
BIOINFORMATICS2014-InternationalConferenceonBioinformaticsModels,MethodsandAlgorithms
116
