
Logos Detection from Moving Vehicles
A. Ben Hamida
1
, M. Brulin
2
and H. Nicolas
2
1
University of Sfax, National School of Engineers, BP 1173, Sfax, 3038, Tunisia
2
Labri, University of Bordeaux, Talence, France
Keywords: Logos’ Detection, License Plates, Pictograms.
Abstract: To deal with road accidents, especially accidents caused by trucks containing dangerous products, the
possible solution is to control these vehicles’ passage. We aim at developing a software technique
confirming that all the entered engines inside a tunnel are securely quitted, to guarantee that no accidents, no
breakdowns have occurred inside. To implement such solution, we identify the ingoing and outgoing trucks
by extracting their significant marks. These marks help to differentiate each vehicle from the other. They are
the mounted logos as license plates and pictograms. To ensure the safe exit of one truck, we look for the
similarity between the ingoing and outgoing vehicle’s images by comparing their detected symbols. In this
paper, we present a controlling system capable to extract logos from moving trucks to verify their safe
entrees and exits. Both theoretical analyses and experimental results are provided to show the performance
of the proposed system.
1 INTRODUCTION
Most of the accidents happen in goods’ road
transport. At the same time, this sector supports
nearly 75% of the total traffic in tones. In the case of
hazardous product’s transport, in addition to the
usual consequences of transportation’s accidents, can
pop up the effects of the transported product. In fact,
the dangerous materials’ accident combines a
primary effect immediately felt (fire, explosion,
spills), and secondary effects (airborne spread of
toxic fumes, water pollution or soil). Generally, a
hazardous material is a substance that by its physical-
chemical characteristics, toxicological, or the nature
of its reactions can pose risks to the humans or the
environment. In case of accident, it is essential for
emergency services to be rapidly informed about the
nature of the carried products in the immobilized
vehicle. Consequently, a truck, carrying an unsafe
substance, traveling on roads is always characterized
by three types of logos:
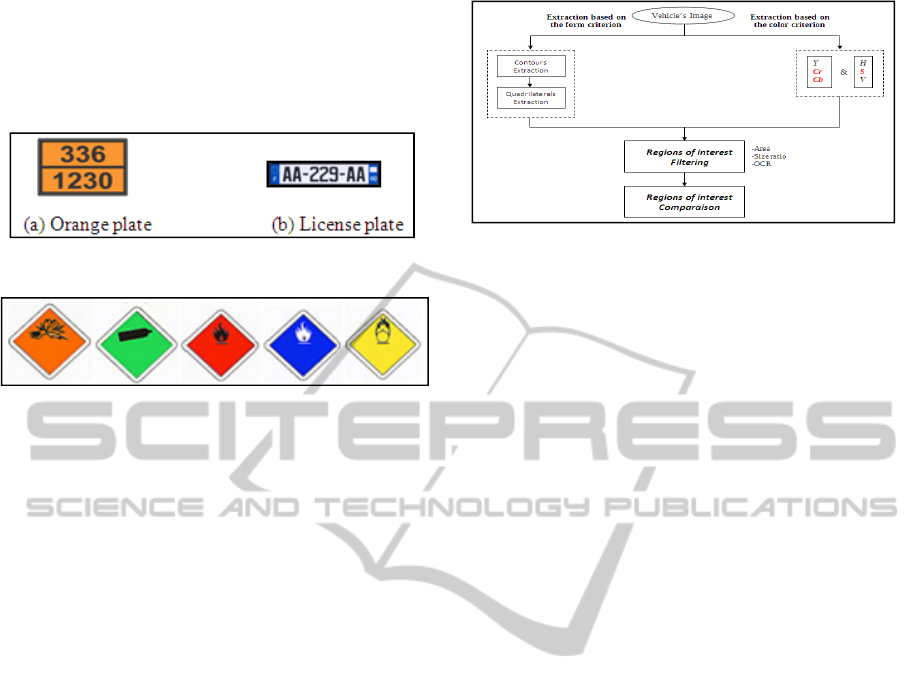
-Rectangular plates, with numbers only, mounted
in front and in the back of the vehicle. They are a
30x40 cm plates colored with a reflective orange and
edged with a black border. The upper part, as
mentioned in figure 1(a), provides information about
the detailed characteristics of the material to quickly
evaluate the risks. The lower part presents the
identification number of the product registered as 4-
digits number.
- Diamond-shape symbols, shown in figure 2,
placed behind and on either sides of the vehicle.
Named pictograms, they are various colored panels,
having the shape of a 30 cm edge square. They
report the major hazard of the substance.
-Rectangular plates, with numbers and letters,
mounted in front and in the back of the vehicle.
They are the license plates as shown in figure 1(b).
They can be another characteristic that ameliorates
the vehicle’s unique identification. Almost, it’s
usually a 52x11 cm plate.
So that, all trucks have distinctive marks
informing about the carried product, mounted at the
front and the back. Exploiting these characteristics,
we can extract logos from images taken for moving
trucks while their entrees and their exits from a
tunnel. The context of the existing problem is that
trucks carrying hazardous materials circulating on the
roads. The greatest risk occurs when a truck enters
through a tunnel without living it. The purpose is to
control these trucks and make sure that everyone is
properly coming out. Otherwise, there was certainly
an accident or breakdown that prevented its exit or
delayed it. In this case the emergency services’
intervention is obligatory. As solution, two cameras
are placed one at the entrance, the other at the
613
Ben Hamida A., Brulin M. and Nicolas H..
Logos Detection from Moving Vehicles.
DOI: 10.5220/0004739906130618
In Proceedings of the 9th International Conference on Computer Vision Theory and Applications (VISAPP-2014), pages 613-618
ISBN: 978-989-758-004-8
Copyright
c
2014 SCITEPRESS (Science and Technology Publications, Lda.)
tunnel’s exit. They provide videos taken for passing
trucks. The developed system is based on images
extracted from videos, to compare between the
incoming and outgoing vehicles. This paper focuses
on the logos’ detection from moving vehicles.
Figure 1: Example of plates.
Figure 2: Examples of pictograms' models.
Through the literature, we couldn’t find previous
works closely related to our subject. Almost, no one
was interested in detecting logos from moving
vehicle. The majority of the papers are concentrated
separately in license plate recognition and road signs’
extraction. As example, Kiran et al. in (Kiran et al.,
2009), Paulo C et al in (Paulo and Correia, 008)
present a vision based vehicle guidance system able
to detect and recognize traffic signs. These papers
deal with the detection and recognition of traffic
signs from image sequences using the color
information. The authors in (Malik et al., 2010);
(Soheilian et al., 2010); (de la Escalera et al., 1997)
present systems for the detection of road signs from a
road scene image and extracts the pictogram inside
the sign. (Chang et al., 2004); (Rahman et al., 2003);
(Sunghoon et al., 2002); (Megalingam et al., 2010);
(Tamer and Cizmeci, 2009) such as many other
works propose different approaches of license plate
recognition.
2 PROPOSED VEHICLES
CONTROLLING SYSTEM
OVERVIEW
The overall system’s scheme takes as input two
images of the truck (at the entrance and the exit) and
generates as result a decision of similarity (a decisive
score) between the two existing trucks in the pictures.
In what follows, we will discuss the developed
system as presented in figure 3 and explain its stages.
Figure 3: Developed system's stages.
2.1 Regions of Interest Extraction
In our case, the regions of interest are the plates and
the diamond-shaped logos existing in the image. For
this, we have to wonder how the eye can distinguish
a logo in the image’s universe. First of all, color
plays an important part so it will be a decisional
criterion in our technique. Then it is continuity, in
fact, a logo is rarely a set of dispersed pixels but
rather a contiguous area with a specific form. So,
these particular features can be mainly classed in two
types: the color and the shape. Therefore, we narrow
our research in the image’s areas that meet both
criteria. We apply a double analysis to the vehicle’s
image: in the first one, we look for regions satisfying
the color’s criterion. At the second, we extract those
with the required forms.
Regions of interest Extraction based on color
criterion
The logos are quite different from the rest of the
image. Their colors are limited to: saturated red,
saturated orange, saturated yellow, saturated blue...
We can distinguish that they almost vary between the
red and blue colors’ levels. In this case, RGB and
YCrCb colors spaces are efficient for logos’
extraction. YCrCb model provide low distance
between two visually similar colors, while in RGB
model they appear dissimilar. That’s why, our choice
converges to using the red Cr and blue Cb
components of YCrCb color space. Since all the
logos’ colors are saturated, we enhance their
extraction by using the saturation component S of the
HSV model. In other words, we extract areas with
highly saturated colors in the images. We classify
every pixel in the image using this equation:
,
∈
,
,
,
,
With :
,
: Pixel of coordinates and of the image .
VISAPP2014-InternationalConferenceonComputerVisionTheoryandApplications
614

,
, : Red and blue component of
YCrCb model and Saturation component of
HSV model.
, : Red and blue classes.
,
,
: fixed thresholds.
The thresholds are empirically fixed with a large
number of images. Some results are shown in figure
4.
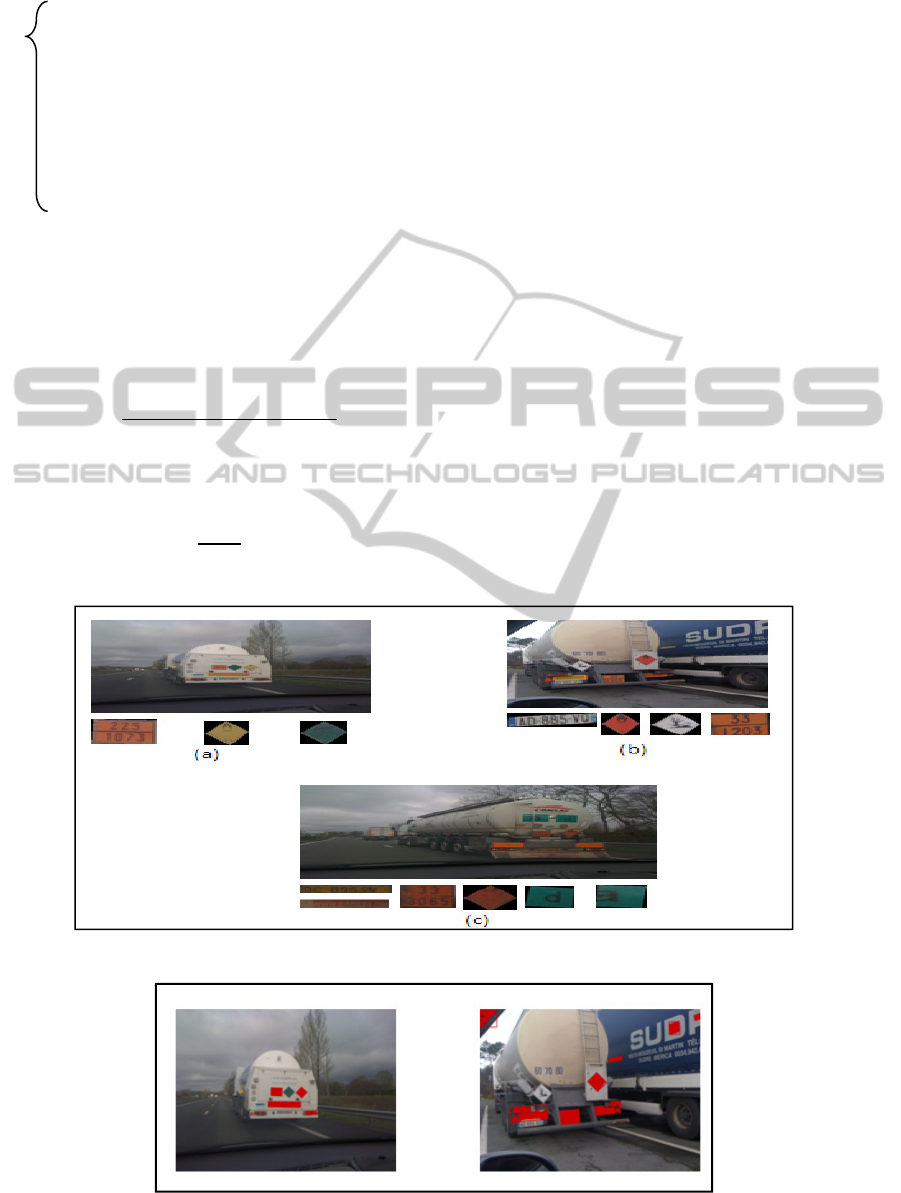
Regions of interest Extraction based on form
criterion
The form is the second decisive criterion in regions
of interest extraction. In plus, the previous step leads
to false negative detections, where it can miss some
logos because of their unsaturated color or for natural
reasons: low luminosity, shadow superimposed, and
plates with spots.... This magnifies the need for a
second analysis based on the form. We can
distinguish that the researched logos forms are
limited to rectangle or rhombus. In this step, we look
for the existing quadrilaterals in the image. We
preprocess the image and find its contours. Then, we
extract the closed contours which:
- Are convex
- Have four sides
- Have four right angles
Some results are presented in figure 5.
Regions of interest Filtering
The major problem of the extraction based on
color criterion step is that the detected regions do not
necessarily have the desired shapes. This detection
leads to false positives that have unlooked-for shapes
or are different from logos. Therefore, we apply an
additional step for the rhombus and rectangles’
extraction from the detected regions (examples of
results are made in Figure 6). We scan the studied
area trying to find the largest rectangle or rhombus
with the highest percentage of the contours coverage.
The surface can be another characteristic for the
regions filtering; a logo is always smaller than a truck
in terms of area. So, all that is detected as too large is
eliminated. As already mentioned in the first part, the
searched logos have normalized dimensions, the
height/width ratio is always invariant. So that, the
size’s ratio is also a discriminant characteristic.
Filtering the detected zones based on area and size’s
ratio allows detecting only the regions most likely to
be logos. At the end of this stage, we obtain the
regions of interest representing the desired distinctive
logos.
As shown in the introduction, the rectangular
plates (orange or license plates) contain always
textual information oppositely to the rhombus logos.
Basing on this assumption, we can enhance our
filtering by adding another characteristic: All
rectangular plates without textual information and all
diamond shaped logos with textual information are
rejected. That’s why; we use an optical character
recognition system (OCR) to extract text from the
logo’s image.
a. Regions of interest Comparison
Each truck going in or out of the tunnel is
characterized by all the logos extracted during the
two first stages. The decision of similarity between
two vehicles is taken by comparing their logos. The
metric for measuring similarity will be the
correspondence between these regions of interest. For
this, we compute the correlation between two input
and output images. We compare each logo from the
first truck’s image with all the others logos from the
second one and select the most similar. The
comparison is based on some criteria. For each
criterion, a score is calculated to finally lead to an
overall score which will decide whether the two
images are representing the same truck or not. The
comparison’s criteria are:
-Matching score
: To measure the similarity
between two logos, we use the Template Matching
technique. We look for the small areas of an image
that matches a pattern. So we scan the image from
the left top to the bottom right searching for the best
match with the model. At the end, we get a
normalized score expressing the degree of
resemblance.
-Histograms correlation
: For this metric, we
compare the gray level histograms of both logos’
images and calculate a similarity score.
-Areas ratio of the two logos
: The logo retains the
same area between the two images. Having an areas’
ratio close to 1, shows the correspondence between
the two.
1
||
,
,
With A1 and A2 the areas of two images
-Ratio of length / width ratio of the two logos
: Just
as the areas ratio, the length / width ratio is
maintained. We aim at having a result close to 1 to
ensure the similarity between the two thumbnails.
:1
||
,
,
With R1 and R2 are the length / width ratio of the
two logos
-Score of belonging to a class
: The score of
correspondence between two logos is calculated as
LogosDetectionfromMovingVehicles
615
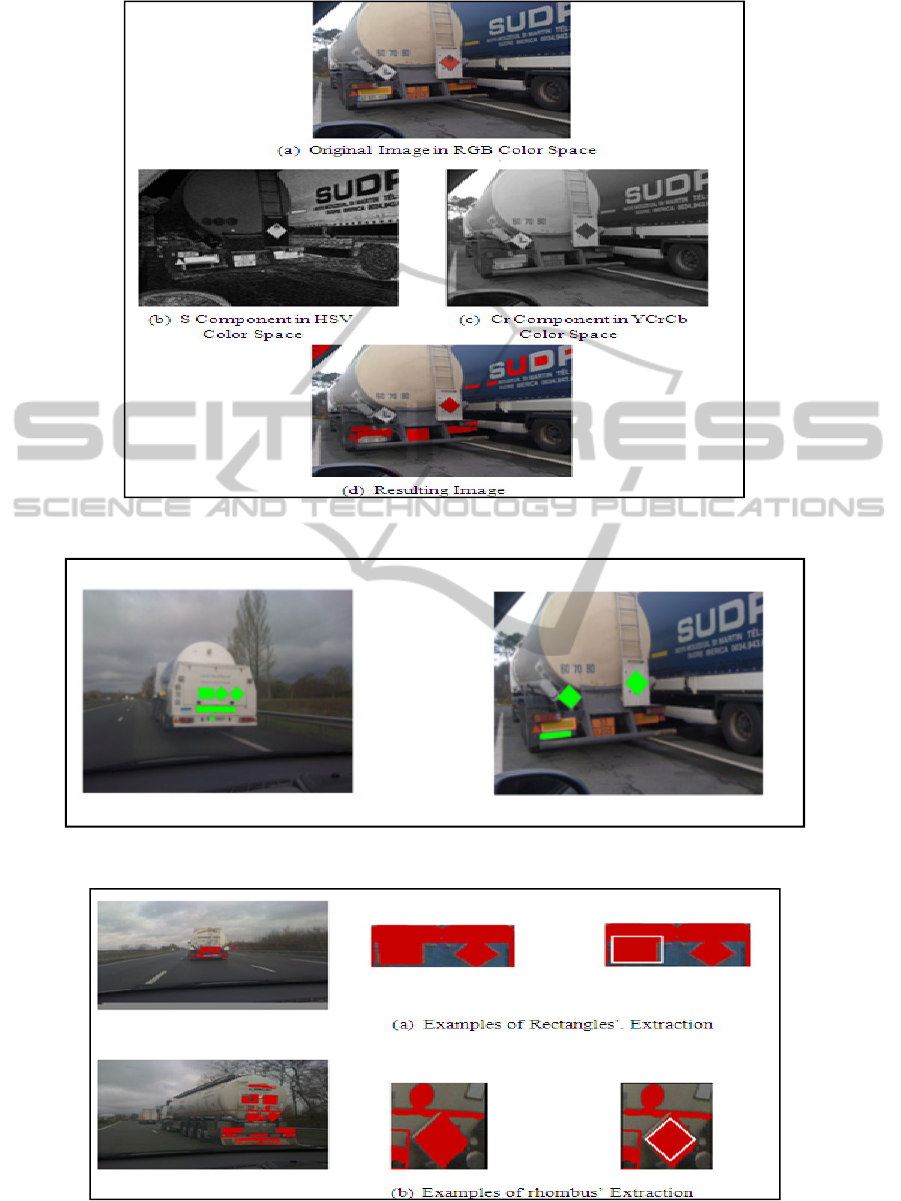
Figure 4: Results of logos detection based on the color criterion.
Figure 5: Results of logos detection based on the form criterion.
Figure 6: Results of extracting rectangles and rhombus from the detected regions.
VISAPP2014-InternationalConferenceonComputerVisionTheoryandApplications
616
follows:
= 1, if logo1 and logo2 are from the same class
(both are plates, license plates, diamond
shaped).
0.5, If Logo1 and Logo2 Have the Same Shape
(One is a license plate and the other is an orange
plate or vice versa)
0, if logo1 and logo2 have different shapes
(one rectangle and one diamond or vice versa)
Going through all the extracted regions of interest,
we calculate a correlation scoreS
,
between each
two. The highest score represents the most similar
thumbnails. It is between 0 and 1 and calculated as
follows:
Comparison scores between two thumbnail
images I and J:
S
,
S
S
S
S
S
5
Thus,theoverallscoreofsimilaritybetweentwo
imagesS
is derived by calculating the average of
the best scores.
S
∑
,
,
With N: number of best scores obtained
3 RESULTS AND EVALUATION
We evaluate the proposed technique by testing
different images of vehicles carrying hazardous
products. Figure 7 shows some results. We can
notice that almost 95% of the logos are correctly
extracted. The false alarm rate, obtained after the
two extraction processes, reaches nearly 5%. The
detection failure (some examples are shown in figure
8) is mainly caused through the color detection’s or
the form detection’s stage. Some cases are rejected
such as a stretched logo due to the perspective effect
or its small size, lack of lighting in the image, some
logos are confused with the trucks taillights... For
the regions of interest filtering stage, the used
thresholds to decide whether the detected region
have the right surface value or size’s ratio are
empirically fixed. It depends on the camera’s zoom
and its position in the tunnel. For the regions of
interest comparing stage, the Table 1 compares the
correlation’s score between the regions extracted
from a trucks input and output images. The best
correlation’s scores are in bold. The overall score
obtained was 0.92, which proves that the same truck
exists in both images. Note that the maximum scores
obtained correspond to logos visually similar. The
correct identification rate in this stage reaches 90%.
Figure 7: Regions of interest extraction results.
Figure 8: Examples of false negatives results.
LogosDetectionfromMovingVehicles
617

Table 1: Correlation scores of logos extracted from two truck’s images.
0,970
0,442 0,2618 0,359
0,445
0,987
0,3998 0,841
0,336 0,239
0,765
0,191
0,342 0,83 0,338
0,984
4 CONCLUSIONS
In this paper, we propose a logos’ detection from
moving vehicles technique. This system is
developed as solution for safe hazardous products’
transport. Using two images for same truck, at the
tunnel’s entree and exit, we control the vehicle and
make sure it is properly coming out. Otherwise,
there was certainly an accident or breakdown that
prevented its exit or delayed it. This control system
is based on three main stages: regions of interest
extraction, regions of interest filtering and regions of
interest comparing. Through experiments, we
demonstrate that we succeed to achieve high
detection and identification’s rate.
REFERENCES
Kiran, C. G.; Prabhu, L. V.; Abdu, R. V.; Rajeev, K.; ,
"Traffic Sign Detection and Pattern Recognition Using
Support Vector Machine," Advances in Pattern
Recognition, 2009. ICAPR '09. Seventh International
Conference on , vol., no., pp.87-90, 4-6 Feb. 2009
doi: 10.1109/ICAPR.2009.58.
Paulo, C. F.; Correia, P. L., "Traffic Sign Recognition
Based on Pictogram Contours," Image Analysis for
Multimedia Interactive Services, 2008. WIAMIS '08.
Ninth International Workshop on , vol., no., pp.67-70,
7-9 May 2008.
Malik, R.; Nazir, S.; Khurshid, J., "Colour based road sign
detection and extraction from still images," Cybernetic
Intelligent Systems (CIS), 2010 IEEE 9th
International Conference on , vol., no., pp.1-6, 1-2
Sept. 2010.
Soheilian B., A.Arlicot, Paparoditis N., « Extraction de
paneaux de signalisation routière dans les images
couleurs », Actes du 17ème congrès francophone en
Reconnaissance de Formes et Inteligence Artificielle,
RFIA’10, Caen, France, p. 743-750, Janvier, 2010.
de la Escalera, A.; Moreno, L. E.; Salichs, M. A.;
Armingol, J. M.; , "Road traffic sign detection and
classification," Industrial Electronics, IEEE
Transactions on , vol.44, no.6, pp.848-859, Dec 1997.
Shyang-Lih Chang; Li-Shien Chen; Yun-Chung Chung;
Sei-Wan Chen; , "Automatic license plate
recognition," Intelligent Transportation Systems, IEEE
Transactions on , vol.5, no.1, pp. 42- 53, March 2004.
Rahman, C. A.; Badawy, W.; Radmanesh, A.; , "A real
time vehicle's license plate recognition system,"
Proceedings. IEEE Conference on Advanced Video
and Signal Based Surveillance, 2003. , vol., no., pp
163- 166, 21-22 July 2003.
Sunghoon Kim; Daechul Kim; Younbok Ryu;
Gyeonghwan Kim; , "A robust license-plate extraction
method under complex image conditions," Pattern
Recognition, 2002. Proceedings. 16th International
Conference on , vol.3, no., pp. 216- 219 vol.3, 2002.
Megalingam, R. K.; Krishna, P.; Somarajan, P.; Pillai, V.
A.; Hakkim, R. U.; , "Extraction of license plate
region in Automatic License Plate Recognition,"
Mechanical and Electrical Technology (ICMET), 2010
2nd International Conference on , vol., no., pp.496-
501, 10-12 Sept. 2010.
Tamer, E.; Cizmeci, B.; , "A different approach for license
plate recognition system," Signal Processing and
Communications Applications Conference, 2009. SIU
2009. IEEE 17th , vol., no., pp.357-360, 9-11 April
2009.
VISAPP2014-InternationalConferenceonComputerVisionTheoryandApplications
618
