
Velum Movement Detection based on Surface Electromyography
for Speech Interface
João Freitas
1,2
, António Teixeira
2
, Samuel Silva
2
, Catarina Oliveira
3
and Miguel Sales Dias
1,4
1
Microsoft Language Development Center, Lisbon, Portugal
2
Dep. Electronics Telecommunications & Informatics/IEETA, University of Aveiro, Aveiro, Portugal
3
Health School/IEETA, University of Aveiro, Aveiro, Portugal
4
ISCTE-University Institute of Lisbon, Lisbon, Portugal
Keywords: Nasal Vowels Detection, Surface Electromyography, Silent Speech Interfaces.
Abstract: Conventional speech communication systems do not perform well in the absence of an intelligible acoustic
signal. Silent Speech Interfaces enable speech communication to take place with speech-handicapped users
and in noisy environments. However, since no acoustic signal is available, information on nasality may be
absent, which is an important and relevant characteristic of several languages, particularly European
Portuguese. In this paper we propose a non-invasive method – surface Electromyography (EMG) electrodes
- positioned in the face and neck regions to explore the existence of useful information about the velum
movement. The applied procedure takes advantage of Real-Time Magnetic Resonance Imaging (RT-MRI)
data, collected from the same speakers, to interpret and validate EMG data. By ensuring compatible
scenario conditions and proper alignment between the EMG and RT-MRI data, we are able to estimate
when the velum moves and the probable type of movement under a nasality occurrence. Overall results of
this experiment revealed interesting and distinct characteristics in the EMG signal when a nasal vowel is
uttered and that it is possible to detect velum movement, particularly by sensors positioned below the ear
between the mastoid process and the mandible in the upper neck region.
1 INTRODUCTION
Conventional speech interfaces solely rely on the
acoustic signal. Hence, this type of interface
becomes inappropriate when used in the presence of
environmental noise, such as in office settings, or
when used in situations where privacy or
confidentiality is required. For the same reason,
speech-impaired persons such as those who were
subjected to a laryngectomy are unable to use this
type of interface. Also, robust speech recognition
and improved user experience, with this type of
interfaces, remains a challenge (Huang et al., 2001)
and an attractive research topic (Flynn and Jones,
2008; Stark and Paliwal, 2011; Yang et al., 2012). A
Silent Speech Interface (SSI) can be viewed as an
alternative or complementary solution since it allows
for communication to occur in the absence of an
acoustic signal and, although they are still in an
early stage of development, latest results have
shown that this type of interface can be used to
tackle these issues. An overview about SSIs can be
found in Denby et al. (2009).
Surface Electromyography (EMG) is one of the
approaches reported in literature that is suitable for
implementing an SSI, having achieved promising
results (Schultz and Wand, 2010; Jorgensen et al.,
2003). A known challenge in SSIs, including those
based on surface EMG, is the detection of the
nasality phenomena in speech production being
unclear if information on nasality is present (Denby
et al., 2009).. Nasality is an important characteristic
of several languages, such as European Portuguese
(EP) (Teixeira, 2000), which is the selected language
for the experiments here reported. Additionally, no
SSI exists for Portuguese and as previously
discussed in Freitas et al. (2012), nasality can cause
severe accuracy degradation for this language. Given
the particular relevance of nasality for EP, we have
conducted an experiment that aims at expanding the
current state-of-the-art in this area, determining the
possibility of detecting nasality in EMG-based
speech interfaces, consequently improving this type
of interaction system. The main idea behind this
13
Freitas J., Teixeira A., Silva S., Oliveira C. and Dias M..
Velum Movement Detection based on Surface Electromyography for Speech Interface.
DOI: 10.5220/0004741100130020
In Proceedings of the International Conference on Bio-inspired Systems and Signal Processing (BIOSIGNALS-2014), pages 13-20
ISBN: 978-989-758-011-6
Copyright
c
2014 SCITEPRESS (Science and Technology Publications, Lda.)

experiment consists in crossing two types of data
containing information about the velum movement:
(1) images collected using Real Time Magnetic
Resonance Imaging (RT-MRI) and (2) the
myoelectric signal collected using Surface EMG. By
combining these two sources, ensuring compatible
scenario conditions and proper time alignment, we
are able to accurately estimate the time when the
velum moves, under a nasality phenomenon, and
establish the differences between nasal and oral
vowels using surface EMG.
2 BACKGROUND
The production of a nasal vowel involves air flow
through the oral and nasal cavities. This air passage
for the nasal cavity is essentially controlled by the
velum that, when lowered, allows for the
velopharyngeal port to be open, enabling resonance
in the nasal cavity and the sound to be perceived
nasal. The production of oral sounds occurs when
the velum is raised and the access to the nasal cavity
is closed (Teixeira, 2000). The process of moving
the velum involves several muscles (Seikel et al.,
2010; Hardcastle, 1976; Fritzell, 1969). The muscles
responsible for elevating the velum are: the Levator
veli palatini, Musculus uvulae (Kuehn et al., 1988),
Superior pharyngeal constrictor, and the Tensor veli
palatine. Along with gravity, relaxation of the
above-mentioned muscles, the Palatoglossus and the
Palatopharyngeous are responsible for the lowering
of the velum.
2.1 Nasality in European Portuguese
Nasality is present in a vast number of languages
around the world, nonetheless, only 20% have nasal
vowels (Rossato et al., 2006). In EP there are five
nasal vowels ([ĩ], [ẽ], [ɐ
̃
], [õ], and [ũ]); three nasal
consonants ([m], [n], and [ɲ]); and several nasal
diphthongs [wɐ
̃
] (e.g. quando), [wẽ] (e.g. aguentar),
[jɐ
̃
] (e.g. fiando), [wĩ] (e.g. ruim) and triphthongs
[wɐ
̃
w] (e.g. enxaguam). Nasal vowels in EP diverge
from other languages with such type of vowels, such
as French, in its wider variation in the initial
segment and stronger nasality at the end (Trigo,
1993; Lacerda and Head, 1966). Doubts still remain
regarding tongue positions and other articulators
during nasals production in EP, namely, nasal
vowels (Teixeira et al., 2003). Differences at the
pharyngeal cavity level and velum port opening
quotient were also detected by Martins et al. (2008)
when comparing EP and French nasal vowels
articulation. In EP, nasality can distinguish
consonants (e.g. the bilabial stop consonant [p]
becomes [m]), creating minimal pairs such as
[katu]/[matu] and vowels, in minimal pairs such as
[titu]/[tĩtu].
3 RELATED WORK
In previous studies, the application of EMG to
measure the level of activity of the muscles involved
in the velum movement has been performed by
means of intramuscular electrodes (Fritzell, 1969;
Bell-Berti, 1976) and surface electrodes positioned
directly on the oral surface of the soft palate
(Lubker, 1968; Kuehn et al., 1982). Our work differs
from the cited papers, in the way that none of them
uses surface electrodes placed in the face and neck
regions, a significantly less invasive approach and
quite more realistic and representative of the SSIs
case scenarios. Also, although intramuscular
electrodes may offer more reliable myoelectric
signals, they also require considerable medical
skills. For both reasons, intramuscular electrodes
were not considered for this study.
No literature exists in terms of detecting the
muscles involved in the velopharyngeal function
with surface EMG electrodes placed on the face and
neck regions. However, previous studies in the
lumbar spine region have shown that if proper
electrode positioning is considered a representation
of deeper muscles can be acquired (McGill et al.,
1996) thus raising a question that is currently
unanswered: is surface EMG able to detect activity
of the muscles related to nasal port opening/closing
and consequently detect the nasality phenomena?
Another related question that can be raised is how
we can show, with some confidence, that the signal
we are seeing is in fact the myoelectric signal
generated by the velum movement and not spurious
movements caused by neighboring muscles
unrelated to the velopharyngeal function.
3.1 EMG-based Speech Interfaces
Our method relies on Surface EMG sensors to detect
nasality. This technique has also been applied to
audible speech and silent speech recognition (e.g.
Schultz and Wand (2010)). Relevant results in this
area were first reported in 2001 by Chan et al.
(2001) where surface EMG sensors were used to
recognize ten English digits, achieving accuracy
rates as high as 93%. In 2003, Jorgensen et al.
(2003) achieved an average accuracy rate of 92% for
BIOSIGNALS2014-InternationalConferenceonBio-inspiredSystemsandSignalProcessing
14

a vocabulary with six distinct English words, using a
single pair of electrodes for non-audible speech. In
2007, Jou et al. (2007) reported an average accuracy
of 70.1% for a 101-word vocabulary in a speaker
dependent scenario. In 2010, Schultz and Wand
(2010) reported similar average accuracies using
phonetic feature bundling for modelling
coarticulation on the same vocabulary and an
accuracy of 90% for the best-recognized speaker.
Latest research in this area has been focused on the
differences between audible and silent speech and
how to decrease the impact of different speaking
modes (Wand and Schultz, 2011a); the importance
of acoustic feedback (Herff et al., 2011); EMG-
based phone classification (Wand and Schultz,
2011b); session-independent training methods
(Wand and Schultz, 2011c); adapting to new
languages (Freitas et al., 2012); and EMG recording
systems based on multi-channel electrode arrays
(Wand et al., 2013).
Our technique can, in theory, be used as a
complement to a surface EMG-based speech
interface by adding a new sensor, or be combined
with other silent speech recognition techniques such
as Ultrasonic Doppler Sensing (Freitas et al. 2012b),
Video (Galatas et al., 2012), etc. by using a
multimodal approach.
4 METHODOLOGY
To determine the possibility of detecting nasality
using surface EMG we need to know when the
velum is moving, avoiding signals from other
muscles, artifacts and noise, to be misinterpreted as
signal coming from the target muscles. To overcome
this problem we take advantage of a previous data
collection based on RT-MRI (Teixeira et al., 2012),
which provides an excellent method to interpret
EMG data and estimate when the velum is moving.
Recent advances in MRI technology allow real-time
visualization of the vocal tract with an acceptable
spatial and temporal resolution. This sensing
technology enables us to have access to real time
images with relevant articulatory information for our
study, including velum raising and lowering. In
order to make the correlation between the two
signals, audio recordings were performed in both
data collections by the same speakers. Notice that
EMG and RT-MRI data cannot be collected
together, so the best option is to collect the same
corpus for the same set of speakers, at different
times, reading the same prompts in EMG and RT-
MRI.
4.1 Corpora
The two corpora collected (RT-MRI and EMG)
share a subset of the same prompts. This set of
prompts is composed by several non-sense words
that contain five EP nasal vowels ([ɐ
̃
, ẽ, ĩ, õ, ũ])
isolated and in word-initial, word-internal and word-
final context (e.g. ampa [ɐ
̃
pɐ], pampa [pɐ
̃
pɐ], pam
[pɐ
̃
]). The nasal vowels were flanked by the bilabial
stop or the labiodental fricative. For comparison
purposes the set of prompts also includes isolated
oral vowels and in context. In the EMG data
collection a total of 90 utterances per speaker were
recorded. A detailed description of the RT-MRI
corpus can be found in Teixeira et al. (2012).
The three speakers participating in this study
were all female native speakers of EP, with the
following ages: 22, 22 and 33 years. No history of
hearing or speech disorders is known for all of them.
One of the speakers is a professor in the area of
Phonetics and the remaining speakers are students in
the area of Speech Therapy.
4.2 RT-MRI Data
The RT-MRI data collection was previously
conducted at IBILI/Coimbra for nasal production
studies. Images were acquired in the midsagittal and
coronal oblique (encompassing the oral and nasal
cavities) planes of the vocal tract at a frame rate of
14 frames/second. For additional information
concerning the image acquisition protocol the reader
is forwarded to Silva et al. (2012). The audio was
recorded simultaneously with the real-time images,
inside the scanner, at a sampling rate of 16000Hz,
using a fiber optic microphone. For synchronization
purposes a TTL pulse was generated from the RT-
MRI scanner (Teixeira et al., 2012). Currently, the
RT-MRI corpus contains only three speakers due to
costs per recording session and availability of the
technology involved.
4.2.1 Extraction of Information on Nasal
Port from RT MRI Data
For the mid-sagittal RT-MRI sequences of the vocal
tract, since the main interest was to interpret velum
position/movement from the sagittal RT-MRI
sequences, instead of measuring distances, we opted
for a method based on the area variation between the
velum and pharynx, closely related to velum
position. These images allowed deriving a signal
over time that describes the velum movement
(shown in
Figure 1 and depicted as dashed line in
VelumMovementDetectionbasedonSurfaceElectromyographyforSpeechInterface
15

Figure 3). As can be observed, minima correspond
to a closed velopharingeal port (oral sound) and
maxima to an open port (nasal sound). Additional
details concerning the segmentation of the oblique
real-time images for velum movement extraction can
be found in Silva et al. (2012) and resulted in similar
variation curves.
Figure 1: Mid-sagittal RT-MRI images of the vocal tract
for several velum positions, over time, showing evolution
from a raised velum, to a lowered velum and back to
initial conditions. The presented curve, used for analysis,
was derived from the images.
4.3 Surface EMG Data Collection
For this data collection the same speakers from the
RT-MRI recordings were used. The recordings took
place in a single session, meaning that the sensors
were never removed during the recordings for each
speaker. Before placing the sensors, the sensor
location was previously cleaned with alcohol. While
uttering the prompts no other movement, besides the
one associated with speech production, was made,
including any kind of neck movement. The
recordings took place in an isolated quiet room. An
assistant was responsible for pushing the record
button and also stopping the recording in order to
avoid unwanted muscle activity. The prompts were
presented to the speaker in a random order and were
selected based on the already existent RT-MRI
corpus (Teixeira et al., 2012). In this data collection
two signals were acquired: myoelectric and audio.
For synchronization purposes, after starting the
recording, a marker was generated in both signals.
The used acquisition system from Plux (2013)
consisted of 5 pairs of EMG surface electrodes
connected to a device that communicates with a
computer via Bluetooth. These electrodes measure
the myoelectric activity using bipolar and monopolar
surface electrode configuration, thus the result will
be the amplified difference between the pair of
electrodes, using a reference electrode located in a
place with low or negligible muscle activity. In the
monopolar configuration, instead of placing the
electrode pair along the muscle fiber, only one of the
electrodes is placed on the articulatory muscles
while the other electrode is used as a reference. The
sensors were attached to the skin using single-use
2.5cm diameter clear plastic self-adhesive surfaces
and considering an approximate 2cm spacing
between the electrodes center. One of the difficulties
found while preparing this study was that no specific
background literature in speech science exists
towards best surface EMG sensor position in order
to detect the muscles referred in section 2. Hence,
based on anatomy and physiology literature (e.g.
Hardcastle (1976)) and preliminary trials we
determined a set of positions that cover, as much as
possible, the probable best positions for detecting
the targeted muscles. As depicted on Figure 2, the 5
sensor pairs were positioned in a way that covers the
upper neck area, the area above the mandibular
notch and the area below the ear between the
mastoid process and the mandible. The reference
electrodes were placed in the mastoid portion of the
temporal bone and in the cervical vertebrae. Even
though the goal is to detect signals from the muscles
involved in the velopharyngeal function it is also
expected to acquire unwanted myoelectric signals
due to the superposition of muscles in these areas,
such as the jaw muscles. However, in spite of the
muscles of the velum being remote from this
peripheral region, we expect to be able to select a
sensor location that enables us to identify and
classify the targeted muscle signal with success.
The technical specifications of the acquisition
system (Plux, 2013) include snaps with a diameter of
14.6 mm and 6.2 mm of height, a voltage range that
goes from 0.0V to 5.0V and a voltage gain of 1000.
The recording signal was sampled at 600Hz and 12
bit samples were used.
The audio recordings were performed using a
laptop integrated dual-microphone array using a
sample rate of 8000Hz, 16 bits per sample and a
single audio channel. Since the audio quality was not
a requirement in this collection we opted for this
solution instead of a headset microphone which
could cause interference with the EMG signal.
Figure 2: EMG electrodes positioning and the respective
channels (1 to 5) plus the reference electrode (R). EMG
channels 1 and 2 use a monopolar configuration and
channels 3, 4 and 5 use bipolar configurations.
BIOSIGNALS2014-InternationalConferenceonBio-inspiredSystemsandSignalProcessing
16
4.4 Signal Synchronization
In order to address the nasality detection problem we
need to synchronize the EMG and RT-MRI signals.
We start by aligning both EMG and the information
extracted from the RT-MRI with the corresponding
audio recordings. Next, we resample the audio
recordings to 12000Hz and apply Dynamic Time
Warping (DTW) to the signals, finding the optimal
match between the two sequences. Based on the
DTW result we map the information extracted from
RT-MRI to the EMG time axis, establishing the
needed correspondence between the EMG and the
RT-MRI information, as depicted in Figure 3.
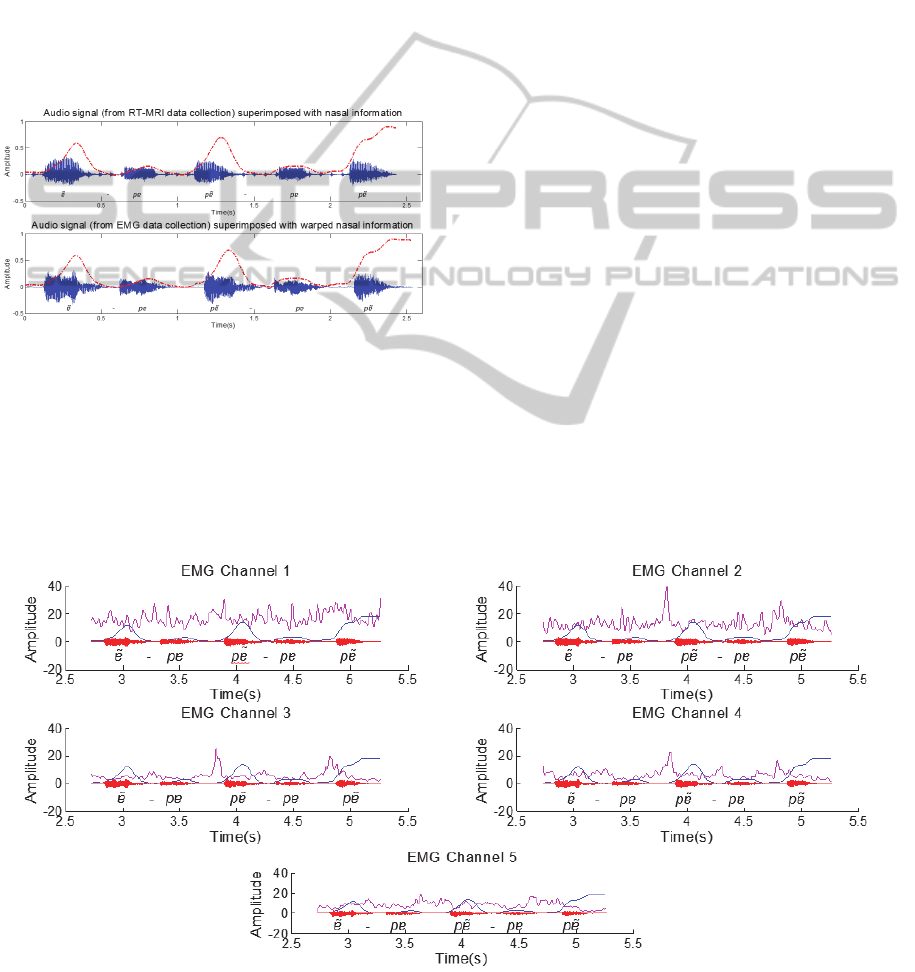
Figure 3: Exemplification of the warped signal
representing the nasal information extracted from RT-MRI
(dashed line) superimposed on the speech recorded during
the corresponding RT-MRI and EMG acquisition, for the
sentence [ɐ
̃
pɐ, pɐ
̃
pɐ, pɐ
̃
].
Based on the information extracted from the RT-
MRI signal and after signal alignment, we are able
to segment the EMG signal into nasal and non-nasal.
The transitional part of the signal (i.e. lowering and
raising of the velum) was included in the nasal
zones.
5 RESULTS
In this section the results of the analysis that
combines the EMG signal with the information
extracted from the RT-MRI signal and a
classification experiment are presented.
5.1 EMG Signal Analysis
After we have extracted the required information
from the RT-MRI images and have it aligned with
the EMG signal we started visually exploring
possible relations between the signals. To facilitate
the analysis we pre-process the EMG signal and
apply a 12-point moving average filter with zero-
phase distortion to the absolute value of the
normalized EMG signal. An example of the
resulting signal for all channels, along with the data
derived from the RT-MRI, aligned as described in
the previous section, is depicted in Figure 4. Based
on a visual analysis, it is worth noticing that several
peaks anticipate the nasal sound, especially in
channels 2, 3 and 4. These peaks are most
accentuated for the middle and final word position.
By using surface electrodes the risk of acquiring
myoelectric signal superposition is relatively high,
particularly muscles related with the movement of
the lower jaw and the tongue considering the
electrodes position. However, if we analyze
an example of a close vowel such as [ĩ], where the
Figure 4: Filtered EMG signal for the several channels (pink), the aligned RT-MRI information (blue) and the
corresponding audio signal for the sentence [ɐ
̃
pɐ, pɐ
̃
pɐ, pɐ
̃
] from speaker 1.
VelumMovementDetectionbasedonSurfaceElectromyographyforSpeechInterface
17

movement of the jaw is less prominent, the peaks
found in the signal still anticipate the RT-MRI velar
information for channels 3 and 4. Channel 5 also
exhibits a more active behavior in this case which
might be caused by its position near the tongue
muscles and the tongue movement associated with
the articulation of the [ĩ] vowel. If the same analysis
is considered for isolated nasal vowels ([ɐ
̃
, ẽ, ĩ, õ, ũ])
of the same speaker, EMG Channel 1 signal exihibts
a more clearer signal apparently with less muscle
crosstalk and peaks can be noticed before the nasal
vowels. For the remaining channels there is not a
clear relation with all the vowels, altough signal
amplitude variations can be noticed in the last three
vowels for EMG channel 3.
The fact that all seemed to point for the presence
of differences between the two classes (nasal and
non-nasal) motivated an exploratory classification
experiment based on Support Vector Machines
(SVMs), which have presented an acceptable
performance in other applications, even when
trained with small data sets.
5.2 Frame-based Nasality
Classification
In a real use situation the information about the nasal
and non-nasal zones extracted from the RT-MRI
signal is not available. As such, in order to
complement our study and because we want to have
a nasality feature detector, we have conducted an
experiment where we split the EMG signal into
frames and classify them as one of two classes: nasal
or non-nasal. For estimating classifier performance
we have applied 10-fold cross-validation technique
to the whole set of frames from the 3 speakers. A
total of 1572 frames (801 nasal and 771 non-nasal)
were considered. From each frame we extract 9 first
order temporal features similar to the ones used by
Hudgins et al. (1993). Our feature vector is then
composed by mean, absolute mean, standard
deviation, maximum, minimum, kurtosis, energy,
zero-crossing rate and mean absolute slope. We have
considered 100ms frames and a frame shift of 20ms.
Both feature set and frame sizes were determined
after several experiments. For classification we
have used SVMs with a Gaussian Radial Basis
Function.
In our classification experiments we start by
using the data from all speakers. Results of 4
relevant metrics are depicted in Figure 5. Besides the
mean value of the 10-fold, 95% confidence intervals
are also included. Results indicate a best result for
EMG Channel 3 with 32.5% mean error rate, an F-
score of 66.3%, a mean sensitivity of 65.5% and a
mean specificity of 69.4%. Channels 4 and 2
achieved second and third best error rates with mean
error rates of 32.7% and 33.2% and an F-score of
64.5% and 64.3%.
Figure 5: Classification results (mean value of the 10-fold
for error rate, F-score, sensitivity and specificity) for all
channels and all speakers. Error bars show a 95%
confidence interval.
We have also run the same experiment for each
individual speaker. EMG channel 3 obtained the best
overall result with 24.3% mean error rate and 62.3%
mean F-score. The best results for each individual
speaker were found for Speaker 3 with 23.4% and
23.6% mean error rate and F-score values of 72.1%
and 70.3% in EMG channels 4 and 3, respectively.
For Speaker 1 and 2, EMG channel 3 presents the
best results with 25.7% and 23.7% mean error rate
and F-score values of 76.1% and 51.9%. However, if
we look into the data of Speaker 2 a higher amount
Figure 6: Difference between the mean error rate of all
channels and the respective result of each channel for all
speakers. Error bars show a 95% confidence interval.
BIOSIGNALS2014-InternationalConferenceonBio-inspiredSystemsandSignalProcessing
18

of nasal frames is found, explained by common
breathings between words, which imply an open
velum.
On a different perspective, if we subtract the
global mean error rate of all channels then, as seen
in Figure 6, EMG channel 3 exhibits a mean error
rate 4.1% below this mean, followed by EMG
channel 4 with 1.0% below the global mean.
To assess if any advantage could be extracted
from using channel combination to improve
classification we have also experienced
classification with multiple EMG channels.
However, no improvements were verified when
comparing with the previously obtained results, a
fact that might indicate an overlapping of
information between channels.
6 CONCLUSIONS
The work presented uses two distinct sources of
information – Surface EMG and RT-MRI – in order
to address the challenge of nasality detection in
EMG-based silent speech interfaces. The
information extracted from the RT-MRI images
allows us to know when to expect nasal information.
Thus, by synchronizing both signals, based on
simultaneously recorded audio signals from the
same speaker, we are able to explore the existence of
useful information in the EMG signal about the
velum movement. The global results of this study,
altough preliminary in the sense that further
validation is required, point to the fact that the
selected approach can be used to reduce the error
rate caused by nasality in languages where this
characteristic is particulary relevant such as
Portuguese, also providing background for future
studies in terms of sensor positioning. The results of
this study show that, in a real use situation, error
rates as low as 23.4% can be achieved for sensors
positioned below the ear between the mastoid
process and the mandible in the upper neck region,
and that careful articulation, positioning of the
sensors or even anatomy of the speaker may
influence nasality detection results. Also, although
the methodology used in this study partially relies on
RT-MRI information for scientific substantiation, a
technology which requires a complex and expensive
setup, the proposed solution to detect nasality is
solely based on a single sensor of surface EMG.
Thus, the development of an SSI based on EMG for
EP, with language adapted sensor positioning, seems
to be now a possibility.
ACKNOWLEDGEMENTS
This work was partially funded by Marie Curie
Golem (ref.251415, FP7-PEOPLE-2009-IAPP) and
by FEDER through the Operational Program
Competitiveness factors - COMPETE under the
scope of QREN 5329 FalaGlobal, by National Funds
through FCT (Foundation for Science and
Technology) in the context of the Project HERON II
(PTDC/EEA-PLP/098298/2008) and by project
Cloud Thinking (funded by the QREN Mais Centro
program: CENTRO-07-ST24-FEDER-002031).
REFERENCES
Huang, X., Acero, A., Hon, H., 2001. Spoken Language
Processing, Prentice Hall PTR, Upper Saddle River,
NJ.
Bell-Berti, F., 1976. An Electromyographic Study of
Velopharyngeal Function, Speech Journal of Speech
and Hearing Research, Vol.19, pp. 225-240.
Chan, A. D. C., Englehart, K., Hudgins, B. and Lovely, D.
F., 2001. Hidden Markov model classification of
myoelectric signals in speech. Proceedings of the 23rd
Annual International Conference of the IEEE
Engineering in Medicine and Biology Society, vol. 2,
pp. 1727–1730.
Denby, B., Schultz, T., Honda, K., Hueber, T., Gilbert, J.
M. and Brumberg, J. S, 2009. Silent speech interfaces.
Speech Communication, Vol. 52, Issue 4, pp. 270-287.
Flynn, R. and Jones, E., 2008. Combined speech
enhancement and auditory modelling for robust
distributed speech recognition, Speech
Communication, Vol. 50, Issue 10, pp. 797-809.
Freitas, J., Teixeira, A. and Dias, M. S., 2012. Towards a
Silent Speech Interface for Portuguese: Surface
Electromyography and the nasality challenge, Int.
Conf. on Bio-inspired Systems and Signal Processing,
Vilamoura, Algarve, Portugal.
Fritzell, B., 1969. The velopharyngeal muscles in speech:
an electromyographic and cineradiographic study.
Acta Otolaryngolica. Suppl. 50.
Hardcastle, W. J., 1976. Physiology of Speech Production
- An Introduction for Speech Scientists, Academic
Press.
Herff, C., Janke, M., Wand, M. and Schultz, T., 2011.
Impact of Different Feedback Mechanisms in EMG-
based Speech Recognition. Interspeech 2011.
Florence, Italy.
Hudgins, B., Parker, P. and Scott, R., 1993. A new
strategy for multifunction myoelectric control,
Biomedical Engineering, IEEE Transactions on, Vol.
40, Issue 1, pp. 82-94.
Jorgensen, C., Lee, D. and Agabon, S., 2003. Sub auditory
speech recognition based on EMG signals. In Proc.
Internat. Joint Conf. on Neural Networks (IJCNN), pp.
3128–3133.
VelumMovementDetectionbasedonSurfaceElectromyographyforSpeechInterface
19

Jou, S., Schultz, T. and Waibel, A., 2007. Continuous
Electromyographic Speech Recognition with a Multi-
Stream Decoding Architecture. Proceedings of the
IEEE International Conference on Acoustics, Speech,
and Signal Processing, ICASSP 2007, Honolulu,
Hawaii, US.
Kuehn D. P., Folkins J.W. and Cutting C. B.,
1982. Relationships between muscle activity and velar
position, Cleft Palate Journal, Vol. 19, Issue 1, pp. 25-
35.
Kuehn D. P., Folkins J.W. and Linville R. N., 1988. An
Electromyographic Study of the Musculus Uvulae,
Cleft Palate Journal, Vol. 25, Issue 4, pp. 348-355.
Lacerda, A. and Head, B. F., 1996. Análise de sons nasais
e sons nasalizados do Português. Revista do
Laboratório de Fonética Experimental (de Coimbra),
No.6, pp. 5-70.
Lubker, J. F., 1968. An electromyographic-
cinefluorographic investigation of velar function
during normal speech production, Cleft Palate
Journal, Vol. 5, Issue 1, pp. 17.
Martins, P. Carbone, I. Pinto, A. Silva, A. and Teixeira,
A., 2008. European Portuguese MRI based speech
production studies. Speech Communication. NL:
Elsevier, Vol. 50, No.11/12, ISSN 0167-6393, pp.
925–952.
McGill, S., Juker, D. and Kropf, P., 1996. Appropriately
placed surface EMG electrodes reflect deep muscle
activity (psoas, quadratus lumborum, abdominal wall)
in the lumbar spine, Journal of Biomechanics, Vol. 29,
Issue 11, pp. 1503-7.
Plux Wireless Biosignals, Portugal, 2013. Available from:
http://www.plux.info/. (accessed on December 20.
2013).
Rossato, S. Teixeira, A. and Ferreira, L., 2006. Les
Nasales du Portugais et du Français: une étude
comparative sur les données EMMA. In XXVI
Journées d'Études de la Parole. Dinard, France.
Schultz, T. and Wand. M., 2010. Modeling coarticulation
in large vocabulary EMG-based speech recognition.
Speech Communication, Vol. 52, Issue 4, pp. 341-353.
Seikel, J. A., King, D. W., Drumright, D. G., 2010.
Anatomy and Physiology for Speech, Language, and
Hearing, Delmar Learning, 4rd Ed.
Silva, S., Martins, P., Oliveira, C., Silva, A. and Teixeira,
A., 2012. Segmentation and Analysis of the Oral and
Nasal Cavities from MR Time Sequences, Image
Analysis and Recognition. Proceedings of ICIAR
2012, LNCS, Springer.
Stark, A. and Paliwal, K., 2011. MMSE estimation of log-
filterbank energies for robust speech recognition,
Speech Communication, Vol. 53, Issue 3, pp. 403-416.
Teixeira, A., Moutinho, L. C. and Coimbra, R. L., 2003.
Production, acoustic and perceptual studies on
European Portuguese nasal vowels height. In Internat.
Congress Phonetic Sciences (ICPhS), pp. 3033–3036.
Teixeira, A., Martins, P., Oliveira, C., Ferreira, C., Silva,
A. And Shosted, R., 2012. Real-time MRI for
Portuguese: database, methods and applications,
Proceedings of PROPOR 2012, LNCS vol. 7243. pp.
306-317.
Teixeira, J. S., 2000. Síntese Articulatória das Vogais
Nasais do Português Europeu [Articulatory Synthesis
of Nasal Vowels for European Portuguese]. PhD
Thesis, Universidade de Aveiro.
Trigo, R. L., 1993. The inherent structure of nasal
segments, In Nasals, Nasalization, and the Velum,
Phonetics and Phonology, M. K. Huffman e R. A.
Krakow (eds.), Academic Press Inc., Vol. 5, pp. 369-
400.
Wand, M. and Schultz, T., 2011a. Investigations on
Speaking Mode Discrepancies in EMG-based Speech
Recognition, Interspeech 2011, Florence, Italy.
Wand, M. and Schultz, T., 2011b. Analysis of Phone
Confusion in EMG-based Speech Recognition. IEEE
International Conference on Acoustics, Speech and
Signal Processing, ICASSP 2011, Prague, Czech
Republic.
Wand, M. and Schultz, T., 2011c. Session-Independent
EMG-based Speech Recognition. International
Conference on Bio-inspired Systems and Signal
Processing 2011, Biosignals 2011, Rome, Italy.
Wand, M., Schulte, C., Janke, M. and Schultz, T., 2013.
Array-based Electromyographic Silent Speech
Interface. In 6th International Conference on Bio-
inspired Systems and Signal Processing, Biosignals
2013, Barcelona, Spain.
Yang, C.; Brown, G., Lu, L., Yamagishi, J. and King, S.,
2012. Noise-robust whispered speech recognition
using a non-audible-murmur microphone with VTS
compensation. Chinese Spoken Language Processing
(ISCSLP), 2012 8th International Symposium on, pp.
220-223.
BIOSIGNALS2014-InternationalConferenceonBio-inspiredSystemsandSignalProcessing
20
