
High Definition Visual Attention based Video Summarization
Yiming Qian and Matthew Kyan
Department of Electrical and Computer Engineering, Ryerson University, 350 Victoria St., Toronto, Canada
Keywords: Delta E 2000, Human Vision Model, Self-Organizing Map (SOM), Summarization, Visual Attention.
Abstract: A High Definition visual attention based video summarization algorithm is proposed to extract feature
frames and create a video summary. It uses colour histogram shot detection algorithm to separate the video
into shots, then applies a novel high definition visual attention algorithm to construct a saliency map for
each frame. A multivariate mutual information algorithm is applied to select a feature frame to represent
each shot. Finally, those feature frames are processed by a self-organizing map to remove the redundant
frames. The algorithm was assessed against manual key frame summaries presented with tested datasets
from www.open-video.org. Of the frames selected by the algorithm, 27.8% to 68.1% were in agreement
with the manual frame summaries depending on the category and length of the video.
1 INTRODUCTION
As the video recording becomes part of people’s
everyday activities, the question of how to access
and manage their recorded video increasingly
becomes a problem. In this work, we consider the
problem of presenting a reasonable summary of the
video in order to facilitate tasks such as
search/annotation. There are mainly two ways of
video summarization, first: video skimming which
provides a fast forwarded version of the video;
second: key frame extraction, which extracts feature
frames and presents them to the users as a
storyboard. For video management proposes, the key
frame extraction is a more suitable approach because
it will help the user to have a general view of the
video instantly. There are different key frame
extraction algorithms available. Approaches
employing visual attention (Evangelopoulos et al.,
2008; Longfei et al., 2008; Ejaz et al., 2012; Ma et
al., 2005; Peng & Xiao-Lin, 2010) are based on
human perception analysis which aims to extract
different information from a saliency map in order to
construct an attention curve, from which frames that
draw people’s attention are automatically selected.
Another popular approach is applying clustering
methods to remove redundant frames. The basic
concept of clustering methods is the same: they
extract different parameters from the raw frames,
then use those parameters as a basis of measuring
inter-frame similarity. In this similarity space,
clustering algorithms group frames that are close to
one another in terms of some distance metric. One
frame from each group will be selected to as feature
frame. The most popular clustering methods in video
summary are K-means clustering (Chasanis et al.,
2008; Calic et al., 2007; Amiri & Fathy, 2010),
Support Vector Machine (Jiang & Zhang, 2011; Li
et al., 2009; Li et al., 2011; Zawbaa et al., 2011),
Self-Organizing Maps (SOM) (Koskela et al., 2007;
Ayadi et al., 2013), Fuzzy C Mean (Cayllahua-
Cahuina et al., 2012), and Hidden Markov Models
(Bailer, & Thallinger, 2009; Liu et al, 2009).
In this paper, a high definition visual attention
based self-organizing map video summary algorithm
is proposed. It uses colour histogram shot detection
to separate the video into shots, and then applies a
novel high definition visual attention algorithm to
construct a saliency map for each frame. The
saliency map is constructed based on a hybrid
between Itti’s visual attention theory and colour
theory. The frame is first processed by Gaussian
pyramid algorithm to create an array of low feature
images, then those low feature images are compared
with the original image to construct the array of low
feature saliency maps. The comparison algorithm is
based on CIE Delta E 2000, a standard developed
from psychological studies of human vision
identifying the difference between two colours
proposed by the International Commission on
Illumination (abbreviated CIE for its French name,
Commission Internationale de l'éclairage). The
634
Qian Y. and Kyan M..
High Definition Visual Attention based Video Summarization.
DOI: 10.5220/0004742206340640
In Proceedings of the 9th International Conference on Computer Vision Theory and Applications (VISAPP-2014), pages 634-640
ISBN: 978-989-758-003-1
Copyright
c
2014 SCITEPRESS (Science and Technology Publications, Lda.)
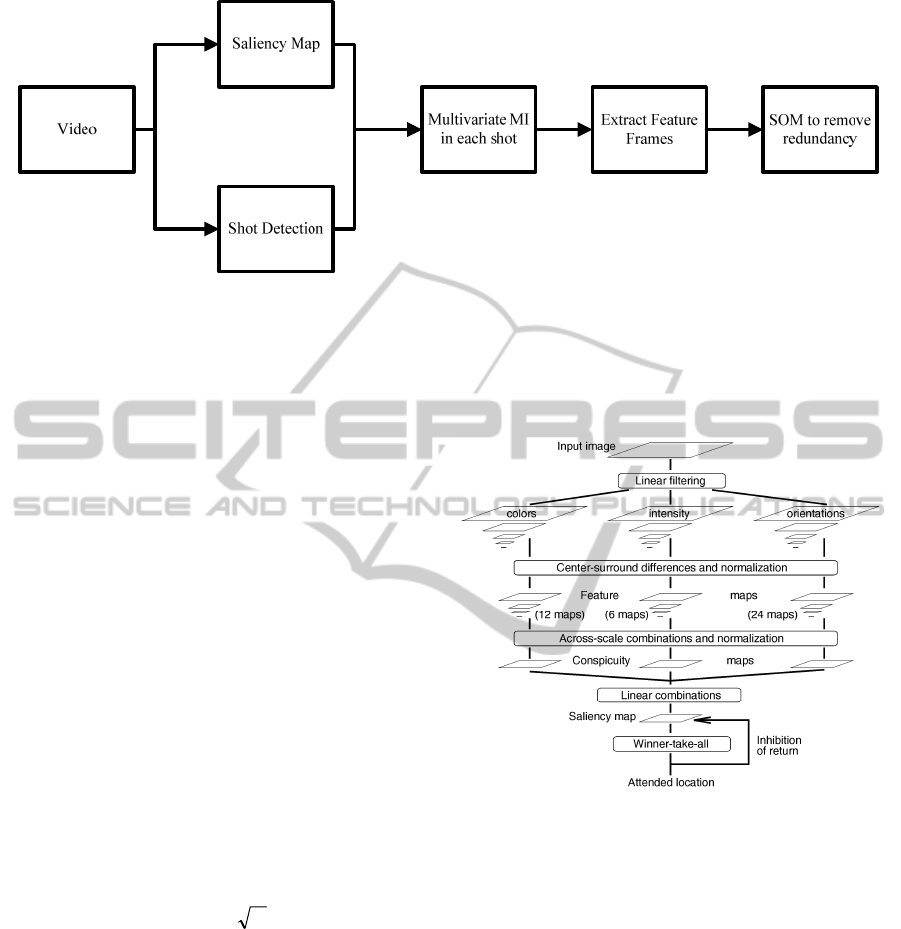
Figure 1: The proposed video summarization flowchart.
array of low feature saliency maps are fused together
to form a final Saliency map of the image. A
multivariate mutual information algorithm is then
employed to select a feature frame to represent each
shot based on the saliency information. The selected
feature frames are then processed by a self-
organizing map to remove any redundant frames.
2 HISTOGRAM SHOT
DETECTION
An HSV histogram based adaptive threshold shot
boundary detection algorithm is implemented. The
frames are first converted from RGB to HSV colour
space. Three separate 512 bin histogram are
constructed on H, S, and V channel. The Euclidean
distances between adjacent frames are calculated as
a parameter to construct a curve determining the
shot boundary. The threshold of this shot boundary
curve is adaptively determined by a sliding window
(Yusoff et al., 2000). In this experiment, the
windows size is set as 40. The threshold in the
window is calculated by following equation:
TdThreshold (1)
Where
Td is a constant, in the experiment Td is set to 5
µ is the local mean
σ is the local variance
3 HIGH DEFINITION HUMAN
ATTENTION MODEL
The High Definition Human Attention model is
inspired by anatomical studies of the human vision
system. An image is separated into colour
opponents, intensity and orientation features. Those
colour features are fed into a centre surround
algorithm to construct multiple saliency maps in
different scales (Frintrop, 2011). The final saliency
map is the fusion of all the saliency maps.
Figure 2 General architecture of the Itti Visual Attention
model.
The centre surround algorithm that proposed by Itti
(Itti et al., 1998) is used to define differences
between a small Centre region and its close
surrounding. It is based on the idea that colour
differences at different scales trigger neural
responses in the human visual system (Saber, 2011).
It is implemented by decomposing an image into
lower scale versions using Gaussian image
pyramids. The low resolution version images are
then resized by bicubic interpolation algorithm to its
original image size. In this work a series of 7 low
resolution images are constructed and resized back
to the original size. The saliency maps are
constructed by taking the only colour features in
LAB colour space from the original image and
comparing with the resized low resolution image
features.
HighDefinitionVisualAttentionbasedVideoSummarization
635
)),(),,((),(
00,
yxIyxIEyxI
scsc
(2)
Where
I
c
is the original image features
I
s
is the resized low resolution image features
∆E
00
is the colour difference calculation
The colour difference calculation that based on
vision theory is implemented. When humans observe
a colour, they will react to hue difference first,
Chroma difference second and lightness differences
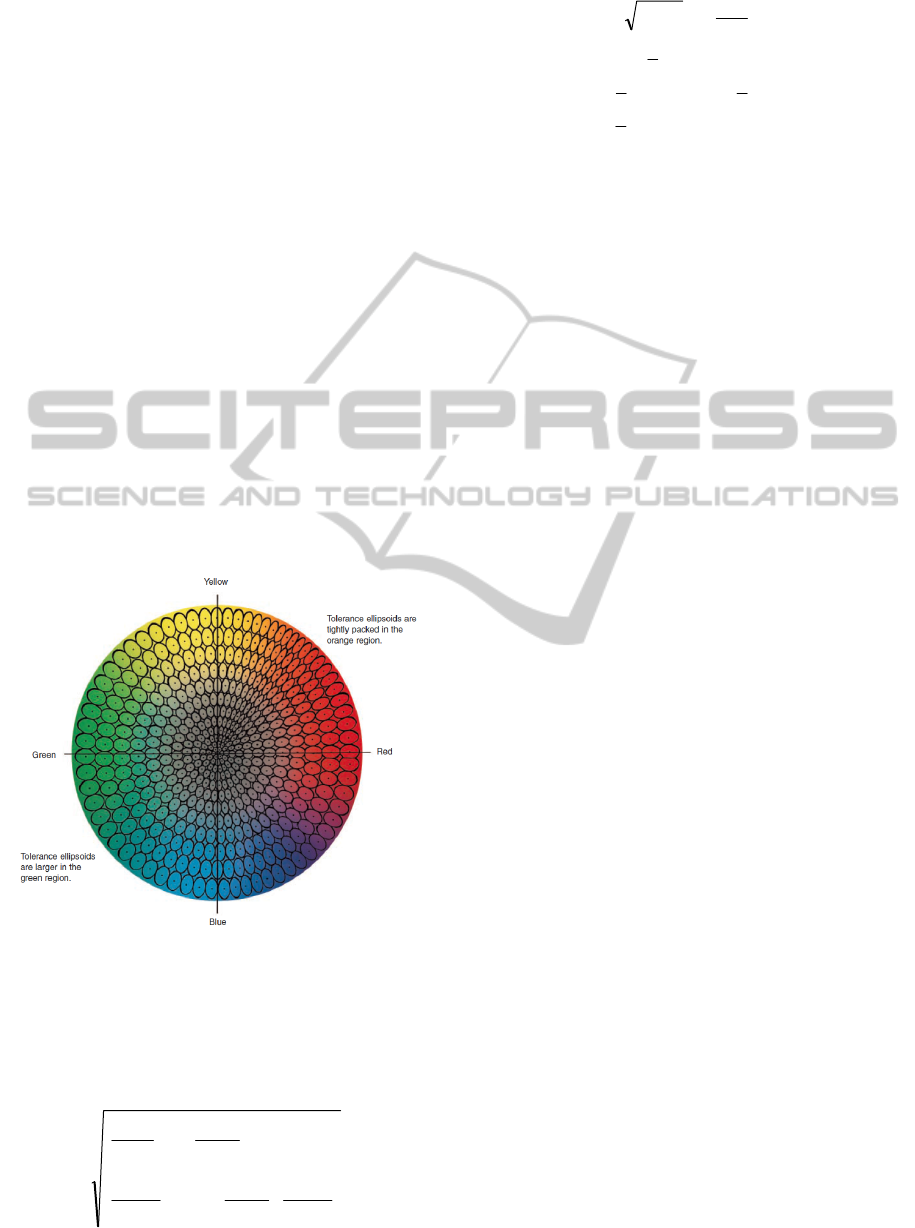
last. Visual acceptability is best represented by an
ellipsoid (X-Rite, 2007). This phenomenon was
observed by International Commission on
Illumination (CIE) and it is been used to measure the
visual difference between two colours which is
known as the Delta E standard. The Delta E 2000
standard is used in the proposed algorithm. The
Delta E 2000 colour space is an ellipsoid space
which is more accurate than Delta 1976.
Furthermore Delta E 2000 corrected the assumption
that made in Delta E 1994 which made the lightness
weighting varied. Those improvements help Delta E
2000 quantify small perceived colour difference
more accurately than other methods (Sharma et al.,
2004).
Figure 3 Tolerance ellipsoids in colour space.
The Delta E 2000 standard calculation in Lab colour
space is following (Luo el al, 2001; Millward,
2009):
12
00
*
2
*
2
*
2
*
1
*
1
*
100
),,;,,( EbaLbaLE
(3)
))(()(
)()(
'"
2
'
2
"
2
'
12
00
HHCC
T
HH
CCLL
Sk
H
Sk
C
R
Sk
H
Sk
C
Sk
L
E
(4)
)
2
sin(2
'
"
2
"
1
'
h
CCH
(5)
)634cos(20.0
)63cos(32.0)2cos(24.0
)30cos(17.01
'
''
'
o
o
o
h
hh
hT
(6)
TCS
H
"
015.01
(7)
Where
L
1
, L
2
, a
1
, a
2
, b
1
, b
2
are the two colours value in
LAB colour space
The proposed algorithm creates a series of 7
saliency maps. Those saliency maps are normalized
and fused together to form a final saliency map. The
normalization equation is defined as following (Sun
& Kwak, 2006)
}/{}),({),(
minmaxmin
dddyxDyxN
ii
(8)
Where
N
i
is the normalized saliency map
D
i
is the saliency map before normalization
d
max
is the maximum value of the saliency map
d
min
is the minimum value of the saliency map
The fusion algorithm to construct the final
saliency map (N
0
) is as follows:
7
1
0
i
i
NN
(9)
4 EXTRACT ATTENTION CURVE
The saliency map obtained by the proposed method
indicates a high resolution map of attention areas.
An attention curve is constructed from it based on an
assumption that people tend to choose frames that
contain more information with respect to adjacent
frames. This assumption was modelled by
calculating the multivariate mutual information
within a shot. The multivariate mutual information
calculates the similarity of a frame against all the
frames in a shot. When a frame has the highest
multivariate mutual information value, it means that
frame contains higher information (relatively) in that
shot. The high definition saliency map is used as a
special greyscale version of image. The advantage of
using high definition saliency map against regular
greyscale image is the saliency map emphasized the
human attention region and filtered out unimportant
information.
The mutual information is a measure of the
VISAPP2014-InternationalConferenceonComputerVisionTheoryandApplications
636

amount of information one random variable contains
about another which also could be seen as a measure
of the distance between two probability distributions
(Cover&Thomas, 2012; Tabrizi et al., 2009). Let χ
be a finite set and X be a random variable taking
values x in χ with distribution p(x) =Pr[X=x].
Similarly, Y is a random variable taking values y in
ϒ
. The Shannon entropy H(X) of a random variable
X is defined by
x
xpxpXH )(log)()(
(10)
The joint entropy of X, Y is defined as
xY
yxpyxpYXH ),(log),(),(
(11)
The mutual information of the X and Y is
),()()(),( YXHYHXHYXI
(12)
xY
yp
xyp
xypxp
YXI
)(
)|(
log)|(log)(
),(
(13)
Instead of only calculating the mutual information
between two frames, the multivariate mutual
information is calculated within a single shot.
S
v
vkIkM
1
),()(
(14)
Where
M is the multivariate mutual information for the
k
th
frame
S
is the number of frames in the shot
5 FEATURE FRAME
EXTRACTION
One frame from each shot is selected to represent the
whole shot. The selection algorithm is based on
select the frame with highest the multivariate mutual
information value with in that shot.
)(MMaxVAI
(15)
Where
M is the multivariate mutual information value
VAI is the frame index that selected as a feature
frame
6 SELF-ORGANIZING MAP
CLUSTERING
A self-Organizing Map (SOM) is an abstract
mathematical model of topographic mapping from
the visual sensors to the cerebral cortex. When
presented with a stimulus, neurons compete among
themselves for possession or ownership of this input.
The winners then strengthen their weights or their
relationships with this input (Yin, 2008). The self-
organizing map learning process is following:
1. Initialize each node’s weights
2. Choose vector from training data and input into
SOM
3. Find the best Matching Unit (BMU) by
calculating the distance between the input vector
and the weight of each node
k
kk
WVDist
2
(16)
4. The radius of the neighbourhood around the
BMU is calculated. The size of the
neighbourhood decreases with each iteration.
)exp()(
0
t
t
(17)
Where
t is the number count of iteration loops
σ(t) is the neighbourhood size at t
th
loop
σ
0
is the initial radius
λ is the time constant
5. Each node in the BMU’s neighbourhood has its
weights adjusted to become more like the BMU.
Nodes closest to the BMU are altered more than
nodes furthest away in the neighbourhood.
]
)(2
exp[)(
2
2
t
Dist
t
(18)
]exp[)(
0
t
LtL
(19)
))()()(()()()1( tWtVtLttWtW
(20)
6. Repeat from step 2 to 5 till reached the stopping
iterations number
7. The frames with the median weight in its group
will be selected as feature frames
The self-organizing maps algorithm processes the
colour histogram information for each feature
frames and categorized them into different groups.
One frame with median weight was selected from
each group to form the final feature frame summary.
HighDefinitionVisualAttentionbasedVideoSummarization
637
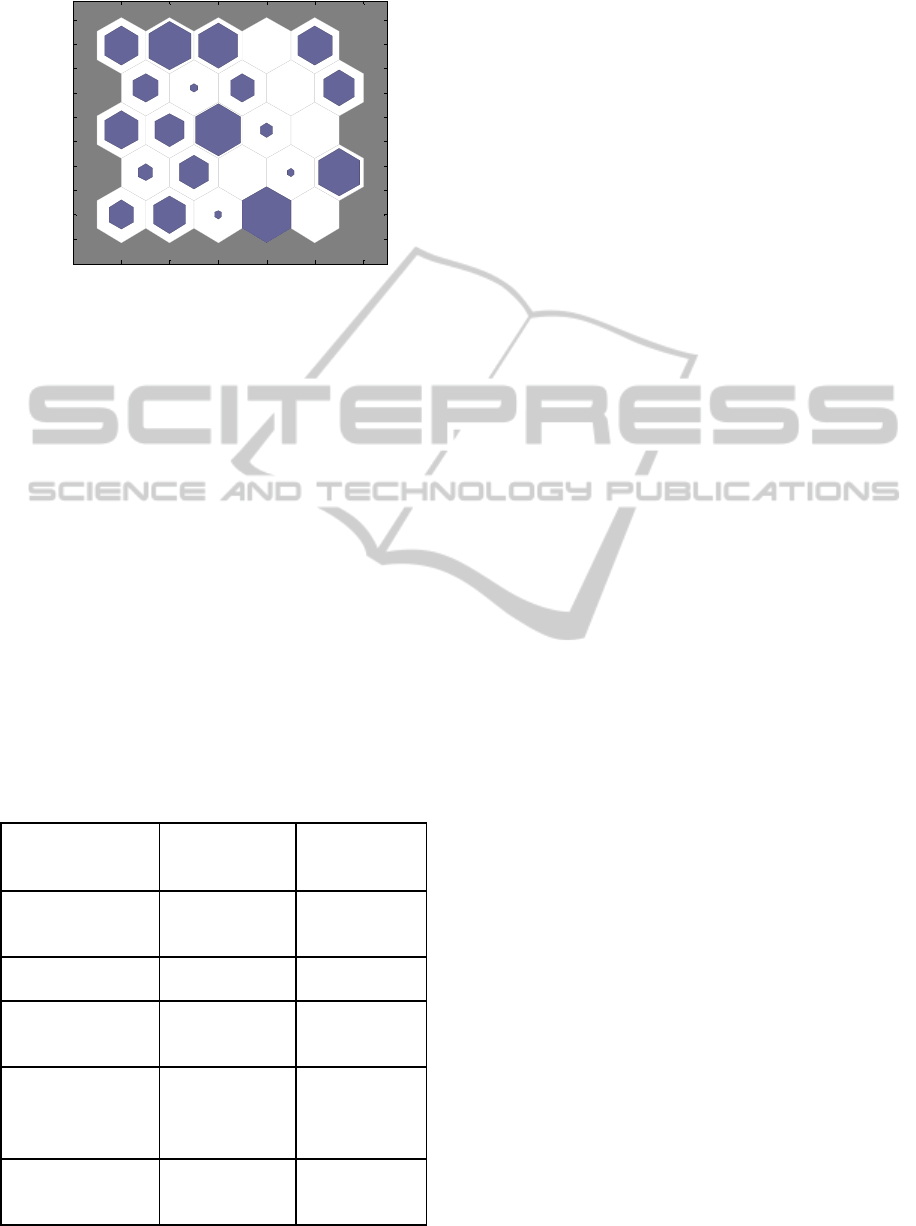
Figure 4: An example of Self-Organizing Map results.
7 RESULT AND DISUSSION
The test videos for this project are from
http://www.open-video.org. In the website, it
provides both the original video files and a ground
truth summary. The ground truth summary is created
by a hybrid machine-human process which a colour
histogram based frame selection algorithm generates
hundreds of ‘candidate’ key frames then human
viewer selects the key frames from those candidates
(Marchionini, Wildemuth& Geisler, 2006). The
proposed method was tested to 5 videos with
different length and types. Moreover one of the
video was a black and white video. The self-
organizing map size for this experiment was set to
5x5 solely because of the ground truth frames were
around 20 frames. The videos were first processed
Table 1:Video Summary results.
Video Type
Proposed
Method
Calvin
Workshop(6:35)
Comedy
10/18
(55.6%)
Hurricanes(3:54) Documentary 17/27(62.9%)
Seamless Media
Design (5:57)
Educational 5/18(27.8%)
Senses and
Sensitivity,
Lecture (27:14)
Lecture 15/22(68.1%)
Lucky
Strike(1:00)
Commercial
(black/white)
3/6(50%)
by the proposed algorithm to generate a storyboard.
Due to the size of the Self-organizing map, the
maximum number of feature frames that the
proposed algorithm selected from a video was 25
frames. The storyboard is then manually compared
with the ground truth from the open video library.
The agreement rate was recorded in the following
table.
As shown in the experimental result above, the
proposed method shows reasonable agreement with
frames chosen in the ground truth in all those 5
videos. Depends on the length and type of the video,
the result is range from 27.8% to 68.1% agreement.
It is important to note that this does not represent
“accuracy” percentage, but rather a tendency for the
algorithm to automatically select summary frames
that correspond to human choices. The SOM itself
is known to allocate some clusters to regions of low
density in the data – for instance, in Figure 3, 8
clusters have very little data.
8 CONCLUSIONS
The proposed method applies a novel high definition
visual attention algorithm and a multivariate mutual
information algorithm to select a series of feature
frames from a video. Then a self-organizing map is
applied to those feature frames to remove redundant
frames. The advantage of the proposed method is it
simulates the human system by using the colour
theory to extract a detailed attention region from the
background. The algorithm works on both colour
videos and black-white films. The result was
compared with the manually picked storyboard from
open video library. The SOM clustering result could
be improved by implementing a parallel structure
that processes multiple SOM maps targeting
different image features independently and then
linking images together in terms of feature
relationships in a network structure. This network
structure could enable more interactive experience
as user could use a video summary as a starting
point and browse through the feature frame
collection by defining different bias weight toward
to different features. Although a video summary
varies from person to person and may not satisfy all
users’ informational need, it does offer a rapid non-
linear entry point into the resource for tasks such as
search and annotation.
-1 0 1 2 3 4 5
-1
-0.5
0
0.5
1
1.5
2
2.5
3
3.5
4
12 20 1 45 0
4160 132
21 16 39 3 0
12111018
22 34 29 0 22
Hits
VISAPP2014-InternationalConferenceonComputerVisionTheoryandApplications
638

REFERENCES
Amiri, A., & Fathy, M. (2010). Hierarchical keyframe-
based video summarization using QR-decomposition
and modified k-means clustering. EURASIP Journal
on Advances in Signal Processing, 2010, 102.
Ayadi, T., Ellouze, M., Hamdani, T. M., & Alimi, A. M.
(2013). Movie scenes detection with MIGSOM based
on shots semi-supervised clustering. Neural
Computing and Applications, 1-10.
Bailer, W., & Thallinger, G. (2009, May). Summarizing
raw video material using Hidden Markov Models. In
Image Analysis for Multimedia Interactive Services,
2009. WIAMIS'09. 10th Workshop on (pp. 53-56).
IEEE.
Calic, J., Gibson, D. P., & Campbell, N. W. (2007).
Efficient layout of comic-like video summaries.
Circuits and Systems for Video Technology, IEEE
Transactions on, 17(7), 931-936.
Cayllahua-Cahuina, E. J. Y., Cámara-Chávez, G., &
Menotti, D. A (2012) Static Video Summarization
Approach With Automatic Shot Detection Using Color
Histograms.
Chasanis, V., Likas, A., & Galatsanos, N. (2008, October).
Video rushes summarization using spectral clustering
and sequence alignment. In Proceedings of the 2nd
ACM TRECVid Video Summarization Workshop (pp.
75-79). ACM.
Cover, T. M., & Thomas, J. A. (2012). Elements of
information theory. John Wiley & Sons.
Ejaz, N., Mehmood, I., Ejaz, W., & Baik, S. W. (2012,
September). Multi-scale Information Maximization
Based Visual Attention Modeling for Video
Summarization. In Next Generation Mobile
Applications, Services and Technologies (NGMAST),
2012 6th International Conference on (pp. 48-52).
IEEE.
Evangelopoulos, G., Rapantzikos, K., Potamianos, A.,
Maragos, P., Zlatintsi, A., & Avrithis, Y. (2008,
October). Movie summarization based on audiovisual
saliency detection. In Image Processing, 2008. ICIP
2008. 15th IEEE International Conference on (pp.
2528-2531). IEEE.
Frintrop, S. (2011). Computational visual attention. In
Computer Analysis of Human Behavior (pp. 69-101).
Springer London.
Itti, L., Koch, C., & Niebur, E. (1998). A model of
saliency-based visual attention for rapid scene
analysis. Pattern Analysis and Machine Intelligence,
IEEE Transactions on, 20(11), 1254-1259.
Jiang, H., & Zhang, M. (2011, June). Tennis video shot
classification based on support vector machine. In
Computer Science and Automation Engineering
(CSAE), 2011 IEEE International Conference on (Vol.
2, pp. 757-761). IEEE.
Koskela, M., Sjöberg, M., Laaksonen, J., Viitaniemi, V.,
& Muurinen, H. (2007, September). Rushes
summarization with self-organizing maps. In
Proceedings of the international workshop on
TRECVID video summarization (pp. 45-49). ACM.
Li, L., Zhang, X., Hu, W., Li, W., & Zhu, P. (2009).
Soccer video shot classification based on color
characterization using dominant sets clustering. In
Advances in Multimedia Information Processing-PCM
2009 (pp. 923-929). Springer Berlin Heidelberg.
Li, L., Zhou, K., Xue, G. R., Zha, H., & Yu, Y. (2011,
March). Video summarization via transferrable
structured learning. In Proceedings of the 20th
international conference on World Wide Web (pp.
287-296). ACM.
Liu, C., Huang, Q., Jiang, S., Xing, L., Ye, Q., & Gao, W.
(2009). A framework for flexible summarization of
racquet sports video using multiple modalities.
Computer Vision and Image Understanding, 113(3),
415-424.
Luo, M. R., Cui, G., & Rigg, B. (2001). The development
of the CIE 2000 colour difference formula:
CIEDE2000. Color Research & Application, 26(5),
340-350.
Longfei, Z., Yuanda, C., Gangyi, D., & Yong, W. (2008,
December). A computable visual attention model for
video skimming. In Multimedia, 2008. ISM 2008.
Tenth IEEE International Symposium on (pp. 667-
672).
Ma, Y. F., Hua, X. S., Lu, L., & Zhang, H. J. (2005). A
generic framework of user attention model and its
application in video summarization. Multimedia, IEEE
Transactions on, 7(5), 907-919.
Marchionini, G., Wildemuth, B. M., & Geisler, G. (2006).
The open video digital library: A möbius strip of
research and practice. Journal of the American Society
for Information Science and Technology, 57(12),
1629-1643.
Millward, S. (2009). Color Difference Equations and
Their Assessment. Test Targets, 19.
Peng, J., & Xiao-Lin, Q. (2010). Keyframe-based video
summary using visual attention clues. IEEE
MultiMedia, 64-73.
Saber, Y. (2011). High-definition human visual attention
mapping using wavelets.
Sharma, G., Wu, W., Dalal, E. N., & Celik, M. U. (2004).
Mathematical discontinuities in CIEDE2000 color
difference computations. In Color and Imaging
Conference (Vol. 2004, No. 1, pp. 334-339). Society
for Imaging Science and Technology.
Sun, S. G., & Kwak, D. M. (2006). Automatic detection of
targets using center-surround difference and local
thresholding. Journal of Multimedia, 1(1), 16-23.
Tabrizi, Z. Z., Bidgoli, B. M., & Fathi, M. (2009,
October). Video summarization using genetic
algorithm and information theory. In Computer
Conference, 2009. CSICC 2009. 14th International
CSI (pp. 158-163). IEEE.
X-Rite, Incorporated (2007). A Guide to Understanding
Color Communication.
Yin, H. (2008). The self-organizing maps: Background,
theories, extensions and applications. In
Computational intelligence: a compendium (pp. 715-
762). Springer Berlin Heidelberg.
Yusoff, Y., Christmas, W. J., & Kittler, J. (2000,
HighDefinitionVisualAttentionbasedVideoSummarization
639

September). Video Shot Cut Detection using Adaptive
Thresholding. In BMVC (pp. 1-10).
Zawbaa, H. M., El-Bendary, N., Hassanien, A. E., &
Abraham, A. (2011, October). SVM-based soccer
video summarization system. In Nature and
Biologically Inspired Computing (NaBIC), 2011 Third
World Congress on (pp. 7-11). IEEE.
VISAPP2014-InternationalConferenceonComputerVisionTheoryandApplications
640
