Hardware-Accelerated Attribute Mapping for Interactive Visualization
of Complex 3D Trajectories
Stefan Buschmann, Matthias Trapp, Patrick L
¨
uhne and J
¨
urgen D
¨
ollner
Hasso-Plattner-Institut, University of Potsdam, Germany
Keywords:
3D Attributed Trajectories, Real-time Rendering, Attribute Mapping.
Abstract:
The visualization of 3D trajectories of moving objects and related attributes in 3D virtual environments repre-
sents a fundamental functionality in various visualization domains. Interactive rendering and visual analytics
of such attributed trajectories involves both conceptual questions as well as technical challenges. Specifically,
the mapping of trajectory attributes to rendering primitives and appearance represents a challenging task in the
case of large data sets of high geometric complexity. There are various visualization approaches and rendering
techniques considering specific aspects of these mappings to facilitate visualization and analysis of this kind
of data. To solve the underlying general mapping problem efficiently, we developed an approach that uses and
combines diverse types of visualizations, rather than being tailored to a specific use case. This paper describes
an interactive rendering system for the visualization of 3D trajectories that enables the combinations of differ-
ent mappings as well as their dynamic configuration at runtime. A fully hardware-accelerated implementation
enables the processing of large sets of attributed 3D trajectories in real-time.
1 INTRODUCTION
Various application and research domains deal with
large complex spatio-temporal data sets, which can
be interpreted as connected, attributed lines or graphs.
This includes infrastructural data such as telecom-
munication or power grids, bio-information such as
molecules or DNA strings (Krone et al., 2008), as well
as attributed trajectories of moving objects (Hurter
et al., 2009). Visualization of such data is a demand-
ing task, because it includes the rendering of complex
data (many data attributes that have to be conveyed to
the user), as well as structural information (connec-
tion between data items). This leads to a number of
conceptual, perceptual, and technical challenges.
The main conceptual challenge is the mapping
of data attributes to visual properties (Kraak and
MacEachren, 1994). In complex data sets, each data
item comprises a number of attributes, that are sup-
posed to be conveyed to the user. To visualize such
data sets, data items are usually represented by geo-
metric primitives, such as lines, glyphs, or meshes.
Visual properties of these geometric representations,
such as position, shape, and color can be used to vi-
sually express data attribute values. This process in-
volves the creation of geometric representations and
mapping of data attributes to their visual properties.
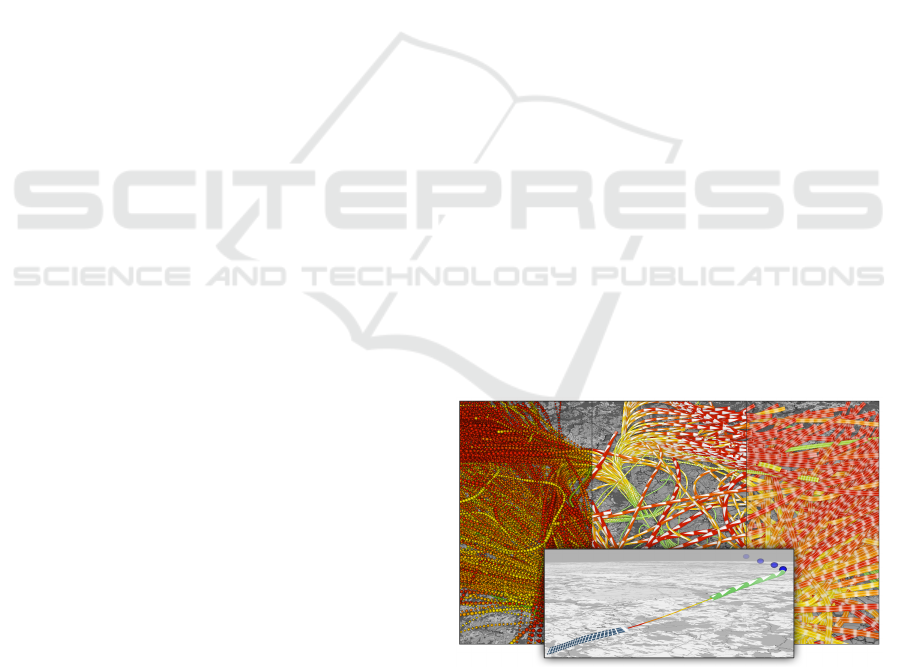
Figure 1: Exemplary rendering results of our system for
visualization of aircraft trajectories showing different style
and mapping configurations.
Another type of challenge lies in the limitations of hu-
man perception. For example, only a limited number
of color tones can effectively be distinguished by the
human visual system. Further, properties such as po-
sition and height can easily be misinterpreted in per-
spective projections (Azuma et al., 2000). The simul-
taneous depiction of many data items can lead to vi-
sual clutter that makes perception difficult and error-
prone. Occlusion and perspective distortion further
decreases the effectiveness of visualizations, espe-
cially in virtual 3D environments (Lange et al., 2003).
The size of spatio-temporal data sets also leads to
356
Buschmann S., Trapp M., Lühne P. and Döllner J..
Hardware-Accelerated Attribute Mapping for Interactive Visualization of Complex 3D Trajectories.
DOI: 10.5220/0004744203560363
In Proceedings of the 5th International Conference on Information Visualization Theory and Applications (IVAPP-2014), pages 356-363
ISBN: 978-989-758-005-5
Copyright
c
2014 SCITEPRESS (Science and Technology Publications, Lda.)

technical challenges (Berberich et al., 2009): the
amount of memory required for a data set depends
on the number of data items and their associated at-
tributes, as well as the geometry required for render-
ing. To enable rendering of large data sets, memory
consumption has to be reduced. The demand for vi-
sual analytics applications, which require highly in-
teractive systems, additionally increase the require-
ments for rendering techniques, as they need to obtain
interactive frame rates even for large data sets.
Density based visualization techniques (Willems
et al., 2009) can be applied to reduce the problem of
visual clutter: by aggregating individual items into a
unified density field, common spatial features can be
extracted. However, due to the aggregation, individ-
ual data items are not preserved during the process.
Also, these techniques are mostly not concerned with
the visualization of additional data attributes. There-
fore, use cases that involve the analysis of individual
spatio-temporal data items, e.g., visual outlier detec-
tion with respect to spatial features and data attributes,
require the rendering of individual items in addition to
aggregated views.
Because of the aforementioned challenges, visu-
alization methods for this kind of data tend to be (1)
specialized and strongly tied to a specific application
domain, and (2) often not flexible in terms of adap-
tation and reconfigurability. However, interactive vi-
sual analytics systems require a high degree of flexi-
bility of visualization methods, as well as high per-
formance. To enable users to interactively explore
and analyze data sets, both, data-filtering and attribute
mapping (Ware, 2000), have to be configurable in
real-time. To summarize, this results in the follow-
ing requirements:
• Flexibility: For an effective analysis, the pipeline
must be highly configurable as to visualize, com-
bine, and correlate different aspects of the data.
• Memory Consumption: To enable the visual-
ization of large data sets, memory consumption
should be reduced.
• Update Performance: The modification of map-
ping or visualization parameters can require the
recreation of geometries. To maintain interactive
frame rates, update costs must also be reduced.
• Rendering Performance: Rendering time must
be low enough to support the visualization of large
data sets. In addition, methods such as batching
(Wloka, 2003) and level-of-detail (Luebke, 2003)
should be applied.
With respect to the requirements above, this paper
presents a rendering system for the visualization of
complex data that provides flexible mapping between
input data and rendering primitives by moving the
attribute mapping step to the GPU. It is designed
as a fully hardware-accelerated pipeline, in which
geometry creation and mapping are performed
entirely on the GPU. This enables the processing of
large complex data sets in real-time and allows for
visual representation and mapping to be configured
dynamically, including the combination of different
rendering techniques. Thus, filtering, mapping,
and geometry creation can be updated interactively,
reducing costly updates between CPU and GPU
memory. Since geometry is created on the GPU, only
the input data, not their geometric representation,
needs to be represented in memory. This facilitates
the design of interactive visualization systems for
large complex data sets.
2 VISUALIZATION OF
ATTRIBUTED AIRCRAFT
TRAJECTORIES
As an exemplary use case for complex 3D trajectories,
we focus on the visualization of aircraft movement
trajectories (Bourgois et al., 2005; Prevot et al., 2006).
The data set of attributed aircraft trajectories has been
acquired by radar tracking in the vicinity of an airport.
It includes the positions of aircrafts together with sev-
eral data attributes that are either global (i.e., static)
for a trajectory (e.g., meta-information about the re-
spective flight), or varying for each sample-point. For
example, global attributes include a unique flight ID,
the type of flight (arrival or departure), time of ar-
rival or departure, aircraft type, as well as assigned
route and runway. Varying attributes include the cur-
rent time, position, and velocity of the aircraft. These
trajectories are represented as poly-lines consisting of
consecutive node positions that are attributed with the
described properties.
For a visualization of such a data set, input at-
tributes have to be mapped to visual properties. Ba-
sically, there are four categories of visual properties
(Bertin, 1967): geometry, texture, color, and ani-
mation. Geometry describes the general shape (e.g.,
spheres, tubes, or ribbons that are parameterized by
width or radius) as well as the respective geometric
representation (e.g., parameterized by a tessellation
level) of visual entities. Further, texture mapping pro-
vides several degrees of freedom for a visualization:
(1) the texture map itself can convey information such
as the direction of trajectories; (2) regular patterns
and stippling can be used to communicate density; (3)
Hardware-AcceleratedAttributeMappingforInteractiveVisualizationofComplex3DTrajectories
357

texture transformations and wrapping can be applied
to encode speed (e.g., by stretching a texture along
the direction of the trajectory). Additionally, textures
can be combined with color values that are obtained
by mapping data values to color gradients or discrete
color maps. Also, a color map itself can be altered
to distinguish between different classes of data items.
Finally and in general, principles of animation are ap-
plied to all before-mentioned properties, e.g., to con-
vey direction and movement, or continuous functions
over time. A combination of these properties is fur-
ther denoted as a style.
To summarize, for the effective visualization of
complex 3D aircraft trajectories, two exemplary ren-
dering techniques are presented that visualize trajec-
tory attributes using (1) individual spheres and (2)
connected 3D tubes or flat ribbons. For example, the
inset in Fig. 1 shows a combination of different ap-
pearances applied to a single trajectory to distinguish
four phases during take-off of an airplane: (1) the be-
ginning is visualized using ribbons, encoding speed in
texture stretch and animation; (2) movement is visual-
ized by line features, encoding acceleration in color;
(3) the end of the take-off phase is depicted by 3D
tubes, encoding speed using color and animation. Fi-
nally, when the airplane has almost reached its height
and course (4), subsequent position updates are vi-
sualized as spheres, encoding time after take-off by
varying their transparency.
3 RELATED WORK
Attribute mapping is essential to data visualization
in general and has been explored in a wide range
of areas. In the context of cartography, Bertin first
introduced the concept of visual variables (Bertin,
1967). In the context of moving objects, a num-
ber of visualization approaches used the space-time
cube (H
¨
agerstrand, 1970) to visualize movements in
interactive environments (Andrienko and Andrienko,
2006; Kraak and Koussoulakou, 2005). With re-
spect to the specific use case of this paper, Hurter
et. al. have explored an interactive approach for the
visualization of large numbers of aircraft trajectories
(Hurter et al., 2009).
Research on attribute mapping for line-based in-
formation mainly focuses on three different aspects.
Given data unique to a certain use case, one common
question is how to find a suitable visual representa-
tion for this specific data, e.g., molecule structures.
Zamborsky et al. present a method to visualize such
proteins by combining basic shapes like tubes, spi-
rals, and stripes (Zamborsk
´
y et al., 2009). Krone et
al. take a similar approach, making use of geometry
shaders to generate the primitives (Krone et al., 2008).
As both solutions are specific to molecule rendering,
they are not capable of serving as a general-purpose
line or network visualization system.
Further research deals with enhancing the visual
quality of the renderings. For instance, Eichelbaum et
al. try to increase the visibility of dense line structures
by applying an ambient occlusion shader, thus giv-
ing cues about the depth order of lines (Eichelbaum
et al., 2013). Everts et al. target the same problem by
applying depth-dependent halos around lines (Everts
et al., 2009), while Stoll et al. improve depth percep-
tion with a shadow algorithm (Stoll et al., 2005).
Furthermore, there has been work on illustrative
effects making use of line renderings. Joshi and
Rheingans use line renderings to enforce the percep-
tion of motion in animated scenes (Joshi and Rhein-
gans, 2005). Nienhaus and D
¨
ollner explore fur-
ther techniques to visualize movement, as for exam-
ple pattern-based repetitions (Nienhaus and D
¨
ollner,
2005). Again, these papers don’t aim at finding a
general approach or framework for visualizing line
data, but highlight particular useful effects instead.
Weiskopf et al. come closer to a more general ap-
proach, as their rendering technique is applicable to
different kinds of flow-based data (Weiskopf et al.,
2005). However in our case, the given data is assumed
to be based on line structures and not on vector fields.
4 HARDWARE-ACCELERATED
ATTRIBUTE MAPPING
In the visualization process, input data is transformed
to visual representations that depict the respective
structure and attribute values. This requires the cre-
ation of geometry and a mapping of data attributes
to visual properties. Often, this step is performed in
the application stage (CPU) and the results are up-
loaded to the graphics board (GPU) for efficient ren-
dering. In contrast to that, the presented approach di-
rectly transfers preprocessed input data to the GPU
that subsequently performs geometry creation and at-
tribute mapping. Fig. 2 illustrates the differences be-
tween these approaches.
While the first approach offers high flexibility in
creating geometric representations, it also increases
memory consumption because the generated geome-
try has to be stored in CPU and GPU memory simul-
taneous. It also requires re-creation and re-transfer
of mapping results every time the visualization pa-
rameters change. This drawback is counterbalanced
by the second approach: it enables efficient render-
IVAPP2014-InternationalConferenceonInformationVisualizationTheoryandApplications
358
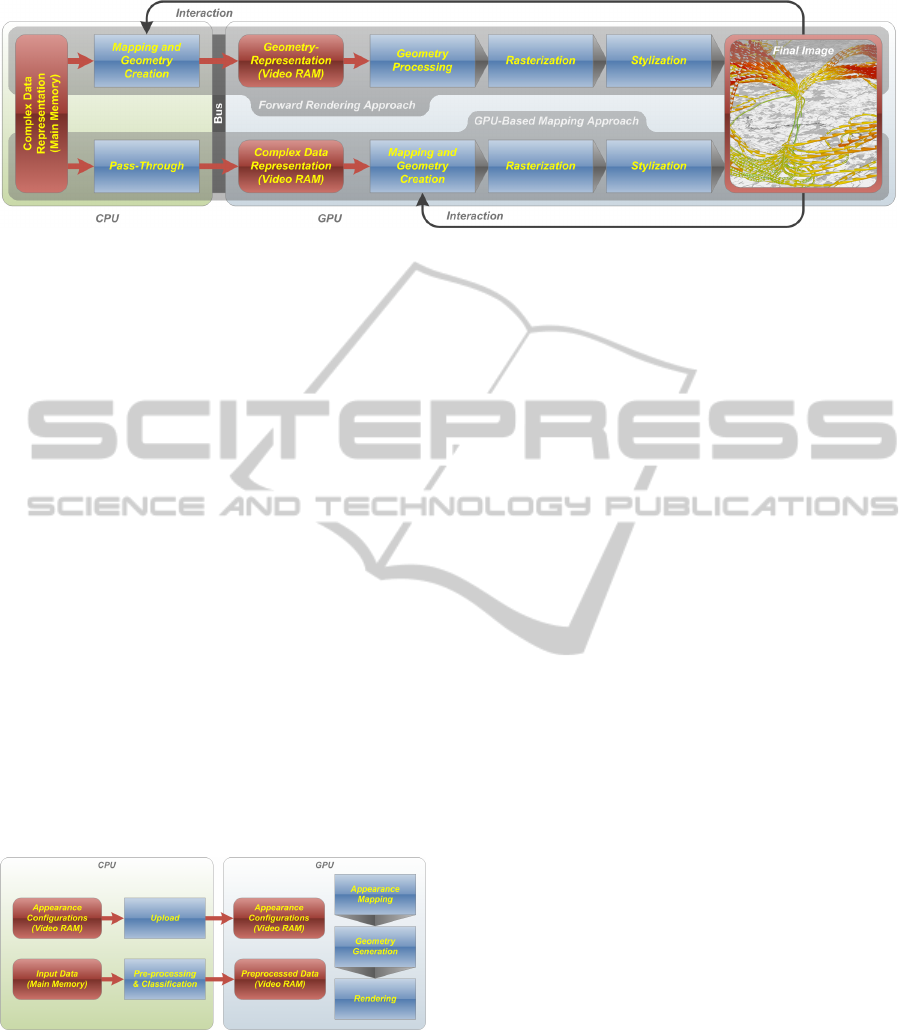
Figure 2: Comparison of two rendering pipelines for the visualization of complex data: a CPU based approach for geometry
creation (top), and our GPU based approach (bottom).
ing, since the input data is uploaded to the GPU only
once and thus does not need to be modified after-
wards. Rendering styles and attribute mapping can be
updated in real-time, without requiring costly updates
of GPU memory. It also reduces the overall memory
consumption, since the geometric representations are
generated on-the-fly. Finally, by creating geometry
only for items that are currently visible, the render-
ing of massive data sets can be enabled. However,
specific GPU implementations of the desired visual-
ization methods are required.
Conceptual Overview. In the following, a concept
for hardware-accelerated attribute mapping is pro-
posed that enables efficient rendering of large com-
plex data sets for interactive visualization systems.
The deferred approach enables a dynamic mapping
of input attributes to visual properties by facilitating
flexible configuration and combination of different
rendering techniques on the GPU: filtering, mapping,
and rendering options can be controlled interactively
and updated in real-time. Fig. 3 shows a schematic
overview of the visualization system.
Figure 3: Architecture of our visualization system.
In a preprocessing step, input data is transformed
into a representation suitable for rendering and sub-
sequently uploaded to the GPU. This comprises the
selection of input attributes that are required for map-
ping, normalization of input values, and the creation
of derived attributes, such as interpolation or aggre-
gation of values. Additionally, a primary attribute is
provided that is used to select a style configuration on
a per-vertex basis. For example, this attribute can be
a classification of nodes or a predefined selection.
In addition to that, a set of so-called appearance
configurations have to be defined and uploaded to the
GPU. A configuration defines the mapping of input
values to visual properties and additional rendering
options (e.g., textures, color maps, or geometric con-
straints). During the first step of the rendering pro-
cess, the actual attribute mapping is performed. For
this purpose, an appearance configuration for the cur-
rent vertex is determined by fetching the primary at-
tribute. It defines the current class and level-of-detail
(LOD) that is used for mapping (cf. next section).
Subsequently, the selected configuration is applied,
by connecting the respective input attribute streams
to the visual properties and rendering options of the
visualization method. After the geometry creation
step, the resulting rendering primitives are rasterized.
Additional post-processing passes can be used to en-
hance the visualization.
Interactive Attribute Mapping. An attribute map-
ping is controlled by a configuration that defines the
transformation of input values to visual properties as
well as additional rendering options. Mapping be-
tween input data and visual representations needs to
be as flexible as possible and must be configurable on
a per-item basis. In general, each individual item may
be visualized using a unique configuration, e.g., to
convey clusters of items or highlight specific features.
Therefore, a primary attribute (class) must be defined,
which selects the configuration for each item. A clas-
sification can depend on attributes of the input data
(e.g., global or varying attributes), or be defined arbi-
trarily. For example, arriving and departing airplanes
can be used as a predefined classification, or the ac-
celeration value can be used to distinguish between
phases of high and low acceleration. Classifications
are created during preprocessing and uploaded to the
graphics board for the visualization process.
In rendering systems, LOD concepts are often used to
Hardware-AcceleratedAttributeMappingforInteractiveVisualizationofComplex3DTrajectories
359
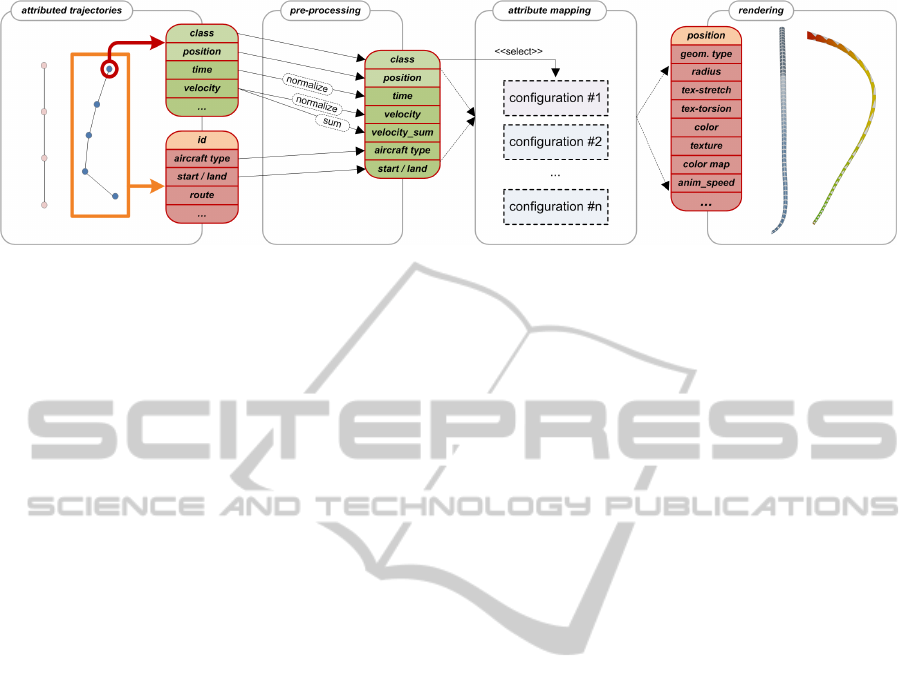
Figure 4: Schematic overview. Attributed trajectories constitute the input data, from which, after preprocessing, a number of
attributes are selected as input to the mapping step. The primary attribute class selects the actual appearance configuration
that is applied. During attribute mapping, input attributes are mapped to visual properties of the visualization technique.
improve rendering performance and to enhance visual
quality. Based on a LOD, which is determined by the
distance between an item and the virtual camera, our
approach enables the control of geometry tessellation
levels as well as choosing completely different geo-
metric representations. Therefore, a specific config-
uration for attribute mapping can be defined for each
LOD of a respective vertex class.
In addition to changing the configuration of spe-
cific classes, analysis tasks may also require to mod-
ify the classification of items interactively. To sup-
port this, multiple classifications can be provided in
the data. At runtime, the classification that shall be
used can be chosen interactively by a user.
5 INTERACTIVE RENDERING
This section briefly describes a prototypical imple-
mentation of the presented concept. It uses the pro-
grammable rendering pipeline to implement attribute
mapping entirely on the GPU (Fig. 4). In particu-
lar, it relies on vertex, geometry, and fragment shader
functionality. The vertex shader performs the attribute
mapping, while geometry and fragment shader imple-
ment the specific visualization method. Specifically,
the vertex shader is responsible for selecting the ap-
pearance configuration that is used for the particu-
lar vertex, and for passing the mapping configuration
and rendering options to the geometry shader. The
geometry shader creates the rendering primitive and
passed the appearance configuration to the fragment
shader. The resulting rasterized and stylized frag-
ments are subsequently stored using a G-Buffer (Saito
and Takahashi, 1990), which comprises the fragment
color and additional fragment values such as depth or
object IDs.
Data Layout. The preprocessed input data is stored
using vertex attribute arrays. The first attribute chan-
nel contains the 3D position of the verticies. Fur-
ther, an arbitrary number of data attributes can be
added. These either represent input values that are
to be mapped to visual properties, or describe class-
attributes used for selecting respective appearance
configurations. Therefore, at least one such class at-
tribute must exist. If more classes are defined, uni-
form shader-parameters can be used to select the cur-
rently active primary attribute. For our use case, the
input data represents a set of attributed trajectories.
Data Mapping. The attribute mapping is controlled
by configuration structures that define how vertex at-
tribute arrays are mapped to the visual properties of a
rendering technique. They also specify rendering pa-
rameters such as the textures, color maps, and global
rendering options. All available textures and color
maps are stored using 2D texture arrays, which can
be addressed dynamically using an index provided by
the configuration structure. The list of configuration
structures is represented using uniform buffers.
In the rendering pipeline, the vertex shader com-
putes the configuration and performs the actual at-
tribute mapping by determining the class of the cur-
rent vertex as well as the current LOD. Together, both
define the index to the applied configuration structure.
The resulting configuration is then fetched, and the
selected vertex attributes are mapped to the respec-
tive visual properties. Therefore, the vertex attribute
arrays must be accessed dynamically using indexing.
Batching & Culling. To optimize rendering perfor-
mance, the input data is batched and rendered in only
a few or even a single draw call. This is easily possi-
ble, since the actual geometry creation is deferred to
the GPU. Therefore, culling has to be implemented
in the shader pipeline itself (i.e., using the vertex
shader), to improve performance by preventing prim-
itives from being created for elements that are outside
the current view frustum.
IVAPP2014-InternationalConferenceonInformationVisualizationTheoryandApplications
360
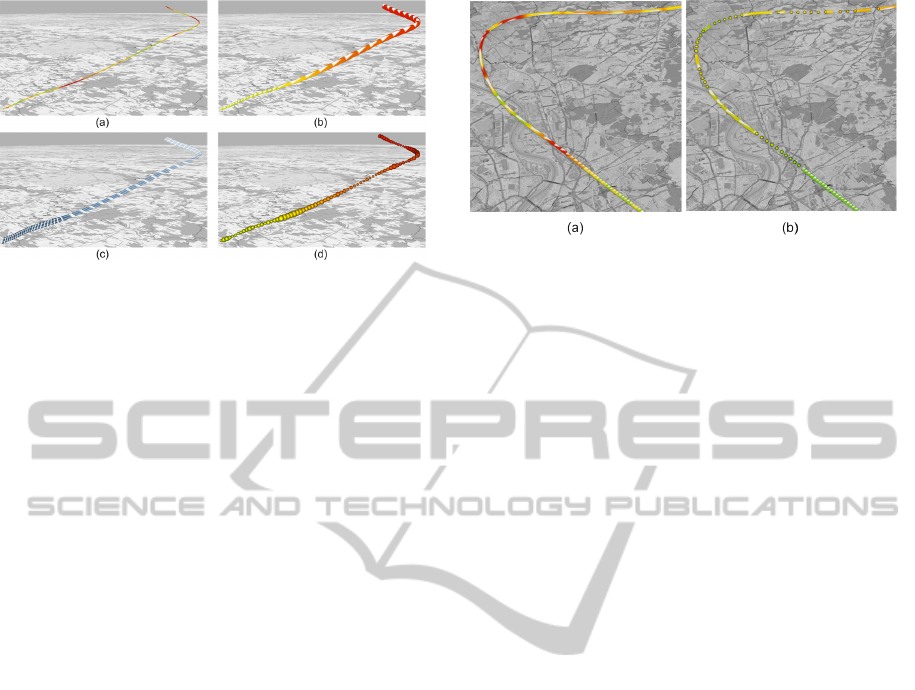
Figure 5: Basic geometry types. (a) Lines, mapping ac-
celeration to color. (b) Tubes, mapping speed to color and
radius. (c) Ribbons, mapping speed to color. (d) Spheres,
mapping speed to color and acceleration to radius.
6 RESULTS & DISCUSSION
This section provides application examples of our vi-
sualization technique applied to attributed airplane
trajectories and presents a performance evaluation.
Application Examples. Fig. 5 shows the basic ge-
ometry types provided by our visualization methods.
An often used geometry type are lines (a), providing
color as a visual property. Further, 3D tubes (b) sup-
port radius, color, a texture map, and texture anima-
tion. The same properties are supported by ribbons
(c), with the exception of having a width parameters
instead of a radius. Last, spheres (d) can be used to vi-
sualize individual nodes rather than segments by pro-
viding color and radius as visual properties.
Classifications can be used to combine different
styles in a single visualization. For example, Fig. 6
shows a classification of nodes by their current ac-
celeration. In Fig. 6(a), the acceleration is visualized
directly by color encoding. In Fig. 6(b), the same data
is used to categorize phases of high and low acceler-
ation. These are rendered using two different appear-
ance configurations: high acceleration is visualized
using spheres, while tubes are used for the remain-
der of a trajectory. In addition to this, speed values
are encoded using color and direction is mapped to
a texture. Therefore, this classification adds an addi-
tional information to the visualization by enabling the
differentiation between phases of high and low accel-
eration, while consistently mapping speed to color.
The level-of-detail functionality of the pipeline is ap-
plied to improve rendering performance. For exam-
ple, tessellation levels can be reduced depending on
the distance to the virtual camera: close trajectories
are rendered in higher detail, while those far away are
displayed using smaller tessellation levels. Because
Figure 6: Classification example. (a) Visualization of ac-
celeration, encoded in color. (b) Classification of high
(spheres) and low (tubes) acceleration phases. In addition,
speed is encoded in color.
of the distance to the camera, a lower detail can hardly
be recognized, thus improves rendering speed.
Fig. 7 shows two exemplary use cases. In the
first example (a), the goal is to identify different air-
craft types by their weight class, which can be de-
termined from the aircraft type designator. There-
fore, the weight class is chosen as primary attribute
for the attribute mapping. The four weight classes
”small”, ”medium”, ”large” and ”heavy” are visual-
ized using the colors green, yellow, red, and blue re-
spectively. At the same time, direction is depicted
by using arrows represented by a texture map, while
the texture stretching represents the current velocity
of an aircraft. The second example (b) shows depart-
ing and landing aircrafts. In this use case, the flight
type is chosen for the primary attribute. Two differ-
ent color gradients (red-to-white and blue-to-white)
are applied for departing and landing aircrafts respec-
tively. Similar to the previous example, direction and
velocity values are visualized using a texture map and
the stretch factor. Additionally, the velocity is also
encoded in color, using the respective color map.
In our use cases, color is often used for depict-
ing speed values of a trajectory. We observed that
the tube radius can also be used to represent attribute
values, but is harder to perceive, especially when vi-
sualizing many trajectories simultaneously. Instead,
a stretch factor for arrow textures can be utilized to
convey the speed of aircrafts, by stretching the texture
along the direction of movement, resulting in long ar-
rows for faster airplanes and small arrows for slower
motions. In addition to that, speed can also be mapped
to the timing of a texture animation: by animating
the texture along a trajectory, perception of direction
and speed can be strongly increased. In summary, the
combination of these properties facilitates the visual-
ization of movement speed. To incorporate additional
information (e.g., clusters or significant values), color
maps, textures, and geometry types can also be varied
with respect to different classes of trajectories.
Hardware-AcceleratedAttributeMappingforInteractiveVisualizationofComplex3DTrajectories
361
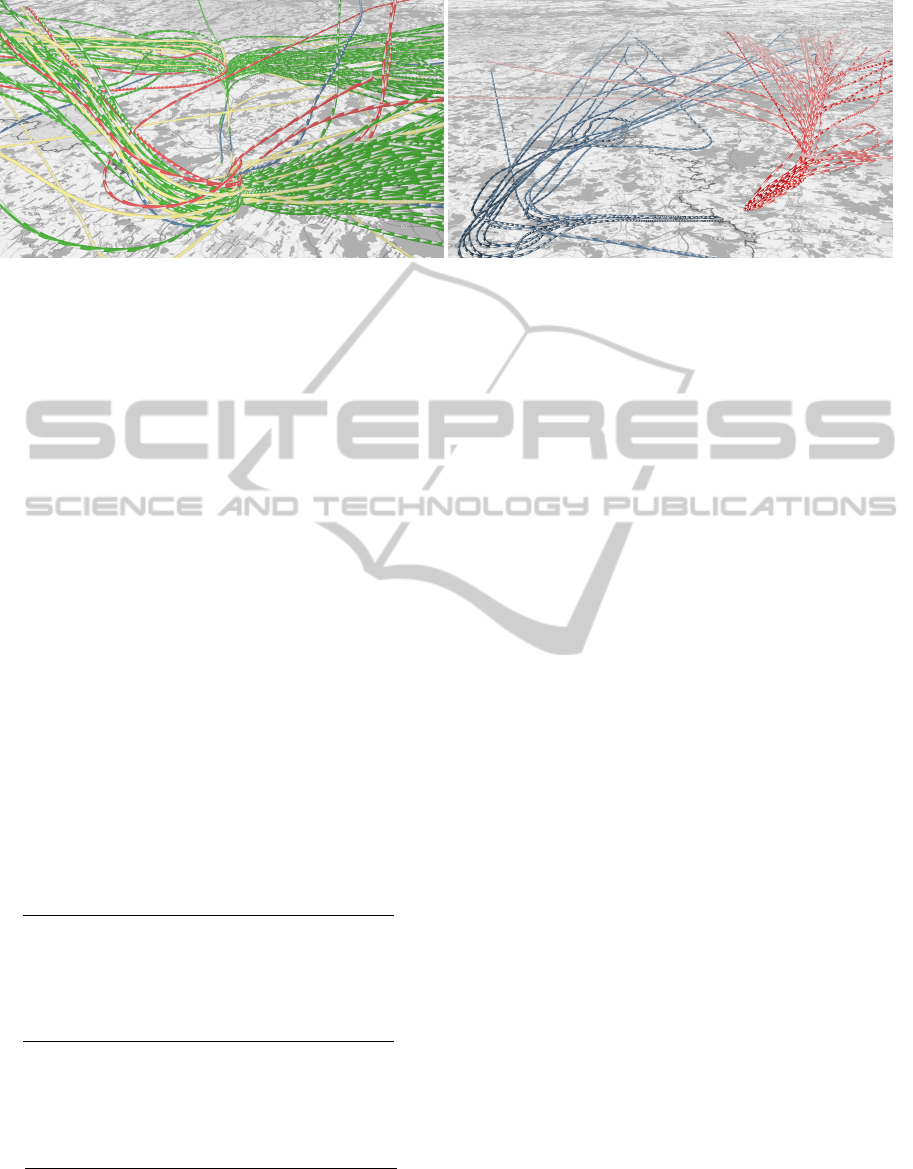
Figure 7: Exemplary use cases. (a) Visualization of weight classes ”small”, ”medium”, ”large” and ”heavy” as green, yellow,
red, and blue, respectively. (b) Visualization of landing (blue) and departing (red) aircrafts, with velocity mapped to saturation.
Performance Evaluation. To evaluate the perfor-
mance of our visualization technique, we used a data
set of aircraft trajectories at the vicinity of a city air-
port. The data set comprises more than 50,000 trajec-
tories, from which we visualized an arbitrary subset
of 10,000 trajectories. The performance test was con-
ducted on a GeForce GTX 285 graphics board. To
determine the performance and complexity of the vi-
sualization technique, three variables were used for
performance testing: (1) number of trajectories (100,
1,000, and 10,000), (2) tessellation level, i.e., the
number of polygons rendered for each tube segment
(4, 16, 32), and (3) screen size (800×600, 1280×960,
and 1920×1080 pixels). Each of these variables were
tested in combination, resulting in 27 individual per-
formance tests.
The results shown in Table 1 indicate geometry
generation as the main bottleneck of the implemen-
Table 1: Performance evaluation of our shader pipeline in
seconds. Screen-resolution is displayed on the vertical axis,
tube tessellation (polygons per segment) on the horizontal
axis.
100 Trajectories:
800×600 1280×960 1920×1080
4 0.0166 0.0333 0.0333
16 0.0166 0.0332 0.0332
32 0.0333 0.0335 0.0499
1,000 trajectories:
800×600 1280×960 1920×1080
4 0.0333 0.0499 0.0666
16 0.0833 0.0999 0.0999
32 0.1333 0.1499 0.1666
10,000 trajectories:
800×600 1280×960 1920×1080
4 0.2497 0.2499 0.2666
16 0.6666 0.6833 0.6999
32 1.2333 1.2499 1.2664
tation. Rendering time increases approximately lin-
early with the number of trajectories and tessellation
level. For a small number of trajectories, higher tes-
sellation levels have almost no impact to the rendering
time. A higher viewport resolution has only a small
performance impact, indicating that the technique is
not fillrate-limited.
7 CONCLUSIONS
This paper presents a novel concept and interactive
rendering system that enables dynamic attribute map-
ping for complex 3D trajectories. The concept is
entirely implemented on graphics hardware and en-
ables the use of batching in the visualization process
to improve rendering performance. It is based on
dynamically routing attribute arrays to serve as in-
put for geometry generation, tessellation and post-
processing steps, which are implemented using the
programmable graphics pipeline.
The technique is capable of visualizing large data
sets in real-time, enabling visual representations to be
configured interactively. Thus, it is applicable to in-
teractive visualization systems aimed at exploration
and analysis of large complex data sets. Directions
of future work include the application of out-of-core
and streaming methods, to support visualization and
exploration of larger data sets. Also, dynamic update
or exchange of input data, e.g., to support dynamic
classifications and filtering, should be explored.
ACKNOWLEDGMENTS
This work was funded by the German Federal Min-
istry of Education and Research (BMBF) in the Pots-
dam Research Cluster for Georisk Analysis, Environ-
mental Change, and Sustainability (PROGRESS), and
IVAPP2014-InternationalConferenceonInformationVisualizationTheoryandApplications
362

the InnoProfile Transfer research group ”4DnDVis”’.
We also wish to thank Deutsche Flugsicherung GmbH
for providing the data used in this work.
REFERENCES
Andrienko, N. and Andrienko, G. (2006). Exploratory anal-
ysis of spatial and temporal data: a systematic ap-
proach. Springer Verlag.
Azuma, R., Neely, H., Daily, M., and Geiss, R. (2000).
Visualization tools for free flight air-traffic manage-
ment. IEEE Computer Graphics and Applications,
20(5):32–36.
Berberich, M., Amburn, P., Moorhead, R., Dyer, J., and
Brill, M. (2009). Geospatial visualization using hard-
ware accelerated real-time volume rendering. In
OCEANS 2009, MTS/IEEE Biloxi-Marine Technology
for Our Future: Global and Local Challenges.
Bertin, J. (1967). S
´
emiologie graphique. Mouton, Paris.
Bourgois, M., Cooper, M., Duong, V., Hjalmarsson, J.,
Lange, M., and Ynnerman, A. (2005). Interactive and
immersive 3d visualization for atc. In Proceedings of
the 6th USA-Europe ATM R&D Seminar, Baltimore.
Eichelbaum, S., Hlawitschka, M., and Scheuermann, G.
(2013). Lineao - improved three-dimensional line ren-
dering. Visualization and Computer Graphics, IEEE
Transactions on, 19(3):433–445.
Everts, M. H., Bekker, H., Roerdink, J. B., and Isenberg,
T. (2009). Depth-dependent halos: Illustrative render-
ing of dense line data. Visualization and Computer
Graphics, IEEE Transactions on, 15(6):1299–1306.
H
¨
agerstrand, T. (1970). What about people in regional sci-
ence? Papers of the Regional Science Association,
pages 7–21.
Hurter, C., Tissoires, B., and Conversy, S. (2009). From-
dady: Spreading aircraft trajectories across views to
support iterative queries. Visualization and Computer
Graphics, IEEE Transactions on, 15(6):1017–1024.
Joshi, A. and Rheingans, P. (2005). Illustration-inspired
techniques for visualizing time-varying data. In IEEE
Visualization, pages 679–686.
Kraak, M.-J. and Koussoulakou, A. (2005). A visualiza-
tion environment for the space-time-cube. In Devel-
opments in Spatial Data Handling: 11th International
Symposium on Spatial Data Handling, pages 189–
200. Springer Verlag Berlin Heidelberg.
Kraak, M.-J. and MacEachren, A. M. (1994). Visualization
of spatial data’s temporal component. Spatial Data
Handling, Advances in GIS Research, pages 391–409.
Krone, M., Bidmon, K., and Ertl, T. (2008). Gpu-
based visualisation of protein secondary structure. In
TPCG’08, pages 115–122.
Lange, M., Hjalmarsson, J., Cooper, M., Ynnerman, A.,
and Duong, V. (2003). 3d visualization and 3d and
voice interaction in air traffic management. In Pro-
ceedings of the Annual SIGRAD Conference, special
theme Real Time Simulations, pages 17–22.
Luebke, D. P. (2003). Level of Detail for 3d Graphics. Mor-
gan Kaufmann.
Nienhaus, M. and D
¨
ollner, J. (2005). Depicting dynamics
using principles of visual art and narrations. IEEE
Comput. Graph. Appl., 25(3):40–51.
Prevot, T., Lee, P., Martin, L., Mercer, J., Palmer, E., and
Smith, N. (2006). Tools for Trajectory-Based Air
Traffic Control and Multi Sector Planning. HCI-Aero.
Saito, T. and Takahashi, T. (1990). Comprehensible ren-
dering of 3-d shapes. In ACM SIGGRAPH Computer
Graphics, volume 24, pages 197–206.
Stoll, C., Gumhold, S., and Seidel, H.-P. (2005). Visualiza-
tion with stylized line primitives. In IEEE Visualiza-
tion’05, pages 695–702.
Ware, C. (2000). Information visualization, volume 2. Mor-
gan Kaufmann.
Weiskopf, D., Schramm, F., Erlebacher, G., and Ertl, T.
(2005). Particle and texture based spatiotemporal vi-
sualization of time-dependent vector fields. In IEEE
Visualization, pages 639–646.
Willems, N., van de Wetering, H., and van Wijk, J. (2009).
Visualization of vessel movements. Computer Graph-
ics Forum, 28(3):959–966.
Wloka, M. (2003). Batch, batch, batch: What does it really
mean? In Game developers conference.
Zamborsk
´
y, M., Tibor, S., and Kozl
´
ıkov
´
a, B. (2009). Dy-
namic visualization of protein secondary structures. In
Proceedings of the 13th Central European Seminar on
Computer Graphics (CESCG 2009), pages 147–152.
Hardware-AcceleratedAttributeMappingforInteractiveVisualizationofComplex3DTrajectories
363
