
Monte-Carlo Image Retargeting
Roberto Gallea, Edoardo Ardizzone and Roberto Pirrone
DICGIM - Universita’ degli Studi di Palermo, Viale delle Scienze, Ed.6, III Piano, 90128, Palermo, Italy
Keywords:
Image Resizing, Image Retargeting, Monte-Carlo, Visual Saliency.
Abstract:
In this paper an efficient method for image retargeting is proposed. It relies on a monte-carlo model that
makes use of image saliency. Each random sample is extracted from deformation probability mass function
defined properly, and shrinks or enlarges the image by a fixed size. The shape of the function, determining
which regions of the image are affected by the deformations, depends on the image saliency. High informative
regions are less likely to be chosen, while low saliency regions are more probable. Such a model does not
require any optimization, since its solution is obtained by extracting repeatedly random samples, and allows
real-time application even for large images. Computation time can be additionally improved using a parallel
implementation.
The approach is fully automatic, though it can be improved by providing interactively cues such as geometric
constraints and/or automatic or manual labeling of relevant objects.
The results prove that the presented method achieves results comparable or superior to reference methods,
while improving efficiency.
1 INTRODUCTION
The diffusion of display devices coming with dif-
ferent aspect ratios and resolutions, entails using
content-aware resizing techniques. Simple cropping
is not sufficient due to severe information loss. On
the other hand, homogeneousscaling with aspect ratio
variation, introduces unwanted distortions in the im-
ages. A proper non-homogeneous resizing operator is
required in order to preserve image content, introduc-
ing deformations just in the low-importance regions
of the image.
In this paper, we present a novel image retarget-
ing technique, which is both efficient and effective.
Differently from many literature approaches, such a
method does not require neither energy minimization
nor functional optimization, and relies just on Monte
Carlo sampling. Our model estimates the deforma-
tion likelihood of each image region, according to the
image saliency. Then, by extracting random samples
over this probability distribution, less important re-
gions get more deformed, while high-saliency ones
are preserved. Another advantage of using a sample-
based approach is that it can be implemented easily
using a parallel scheme, thus improving efficiency.
Salient regions can be extracted using several
content relevance estimators, such as visual saliency
maps (Itti et al., 1998; Hou et al., 2012), corner detec-
tors (Harris and Stephens, 1988), eye-gaze measure-
ment (Santella et al., 2006), etc. Additionally, both
automatic or interactive cues can be given to improve
the results: people detectors (Dalal and Triggs, 2005)
or face detectors (Viola and Jones, 2001) can help in
preserving people and faces in the images. Finally,
other geometric constraints can be provided by the
user to preserve structures explicitly.
2 RELATED WORK
In general, the resizing operators used by image pro-
cessing applications work by resizing images to a tar-
get size by means of homogeneous shrinking or en-
larging operators. After early works based on crop-
ping, like (Suh et al., 2003), more recent approaches
use adaptive image resizing. The idea is to preserve
important image features by applying a non-linear
content driven resize operator. Remarkable works
were done using seam carving, (Avidan and Shamir,
2007; Rubinstein et al., 2008) where 1D seams are re-
moved/added to reduce/increase the image size. Such
seams are chosen from low energy regions of the
image. However, due to the discrete nature of this
method, notches in the objects may appear. In ad-
402
Gallea R., Ardizzone E. and Pirrone R..
Monte-Carlo Image Retargeting.
DOI: 10.5220/0004744404020408
In Proceedings of the 9th International Conference on Computer Vision Theory and Applications (VISAPP-2014), pages 402-408
ISBN: 978-989-758-003-1
Copyright
c
2014 SCITEPRESS (Science and Technology Publications, Lda.)

Input Image
(I)
Saliency
detection
S(i,j)
pmf extraction
pd(i)
pmf sam pling lines m ovem ent
Im age
reconstruction
Output Im age
(R)
Figure 1: Block diagram of the retargeting system. The input image I is the input of the system. The saliency estimator
generates a saliency map, which is then used to build a deformation probability mass function dpmf; in turn the dpmf is
sampled to move the lines of the image non-homogeneously. Finally, the image is reconstructed, and the final retargeted
image is produced as output.
dition, when no more discardable information exists,
important details get removed and severe distortions
may appear. Warping methods (Wolf et al., 2007)
overcome this limitation by squeezing or stretching
homogeneous regions, while minimizing the distor-
tion in relevant regions. In (Yu-Shuen Wang and Lee,
2008) regions are scaled by different factors in or-
der to preserve aspect ratio too. Multi-operator ap-
proach (Rubinstein et al., 2009), uses a combination
of seam carving, scaling and cropping. Seam carv-
ing is very efficient but limited in its use, warping
methods are more effective but computationally ex-
pensive, almost prohibiting their use in real-time ap-
plications with high resolution images or embedded
devices with low power profiles. A comprehensive
evaluation of several reference literature methods is
provided in (Rubinstein et al., 2010).
3 IMAGE RESIZING APPROACH
In our model an input image I is considered as a set of
n lines (the columns or the rows) I = {l
0
,l
1
,...,l
s−1
},
where l
i
are the initial lines positions and s is the
initial image size along the considered dimension.
Thus, l
i
= i ∀ i ∈ {0, s− 1}. To resize the im-
age to the new dimension s
′
we look for the new
set I
′
=
l
′
0
,l
′
1
,...,l
′
s−1
where distances between two
consequent lines should be preserved in most infor-
mative image regions in order not to introduce distor-
tions as in Equation (1),
(l
i
− l
i−1
) =
l
′
i
− l
′
i−1
. (1)
Obviously, some distances have to be necessarily
changed due to resizing, and some deformation must
be introduced. The model is built in order to spread
the required deformations across the whole image in
a non uniform way that obeys to a probability distri-
bution. This is done applying multiple atomic resize
operators that are sampled from a proper probability
mass function. Such a function is built according to
lines significance. The idea is to apply less atomic de-
formations in salient regions of the image, while the
most deformation affects the unimportant zones.
The whole system is realized by means of a chain,
which is schematized in the block diagram in Figure
1. The input image I is given as input to the sys-
tem. The saliency estimator generates a saliency map,
which is used in turn to build a deformation probabil-
ity mass function dpmf. Such a function is sampled
to move the lines of the image non-homogeneously.
Finally, the image is reconstructed and the final retar-
geted image is produced as output.
3.1 Model Formulation
The proposed method is based on two concepts:
• a resizing operator
• a deformation strategy
Resizing operator. The resizing operator we in-
troduce is considered as the multiple application of
atomic resizing operations. Each atomic resizing op-
erates on a single line l
i
, moving it by a given quantity
k
lod
, which is expressed in (fractions of) pixels, and
defines the level of detail of the transformation. Rela-
tive movement between two consequent lines has the
effect of deforming the underlying image. Changing
the quantity k
lod
affects:
• the size of each atomic resizing, which is equal to
k
lod
, and defines the movement of the the single
line l
i
• the number of atomic resizing n
r
(see Equation 2)
to produce the required image final size.
These two quantities define the resolution of the
global resizing operator. Of course, as the level of
detail gets finer, the computational burden gets heav-
ier, due to an increasing number of atomic resizing
operations. In the following paragraphs, the selection
of the k
lod
parameter will be discussed in detail.
n
r
= s
′
/k
lod
. (2)
Deformation strategy. In order to apply the de-
scribed resizing operator, a line selection strategy
needs to be designed to determine which line should
be moved at each resizing step. The required proce-
dure has to exhibit a dual behavior: firstly, it should
select less important lines from a visual content im-
portance perspective, as the candidates for resizing
since distortions should be preferentially introduced
in low-importance or homogeneous regions. On the
other hand, deformations should be distributed across
Monte-CarloImageRetargeting
403
the whole image in order not to remove whole image
regions, thus introducing severe artifacts. In order to
attain such behaviors, we define a deformation prob-
ability mass function - dpmf p
d
(x) over the image I.
Such a dpm f indicates the likelihood that a single re-
sizing operation would affect the image line l
x
.
Intuitively, such a probability should be related to
the image visual content importance. In particular,
line relevance R(i) is extracted from the dual form
of visual saliency, i.e. visual inconspicuousness. Vi-
sual saliency S(i, j) of each pixel is extracted using
either Itti’s saliency detector (Itti et al., 1998) or sig-
nature saliency (Hou et al., 2012). Such values are
then projected along the considered resizing axis us-
ing the maximum operator, and are complemented as
in Equation (3).
R(i) = 1− max
j
S(i, j). (3)
Finally, the values are normalized w.r.t. their summa-
tion, as in Equation (4) to recover p
d
(i); an example
is reported in Figure 2.
p
d
(i) = R(i)/
s−1
∑
j=0
R( j). (4)
Here high-value points correspond to image regions
with high-probability of being deformed, while low-
value points correspond to image regions that should
be preferentially preserved. Note that visual saliency
can also be improved either interactively by adding
constraints, or automatically using people (Dalal and
Triggs, 2005) or face detectors (Viola and Jones,
2001), and modifying R(i) to have low values in pres-
ence of constraints or people/faces. Note that this op-
eration must be performed prior to normalization re-
ported in Equation (4) to preserve the p
d
(i) integral to
sum to 1, thus being a valid dpmf.
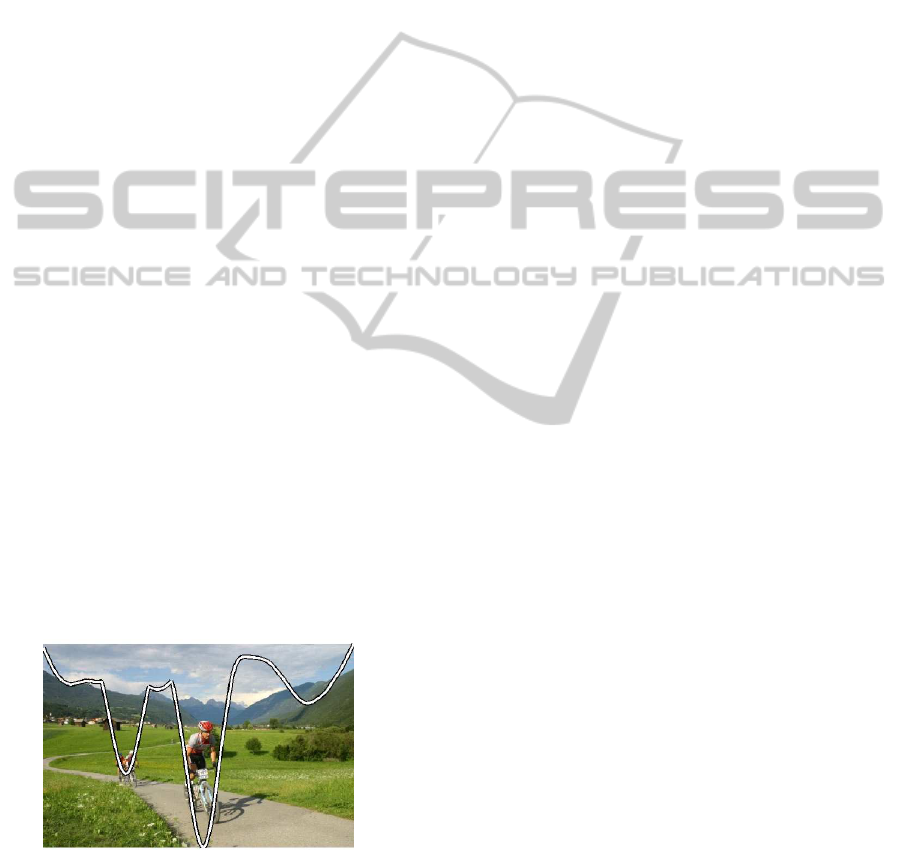
Figure 2: Plot of the deformation probability mass function
p
d
(i) related to the example image. The function repre-
sents the probability that a given line l
i
will be subject to an
atomic resizing step during the retargeting operation.
In order to obtain the actual retargeting, we run
a Monte Carlo process. As defined in Equation (2),
n
r
samples are drawn from the p
d
(x) distribution and
each extracted correspondingline is movedby a quan-
tity k
lod
. The result is that a line position l
i
i the image
gets a chance to be moved, proportionally to its in-
cospicuousness value. Statistically, the deformations
are spread across the whole image, limiting the pres-
ence of artifacts, while still preserving important re-
gions.
After recovering new lines position l
′
i
, the result-
ing image needs to be reconstructed. This process re-
quires an interpolation procedure, since l
′
i
values are
generally real values. Any interpolation scheme could
be used for this purpose. Choosing the best interpo-
lating function is out of the scope of this paper, so
no further investigations were done in this direction.
However simple linear interpolation gives satisfying
results, so it has been used for generating all of the
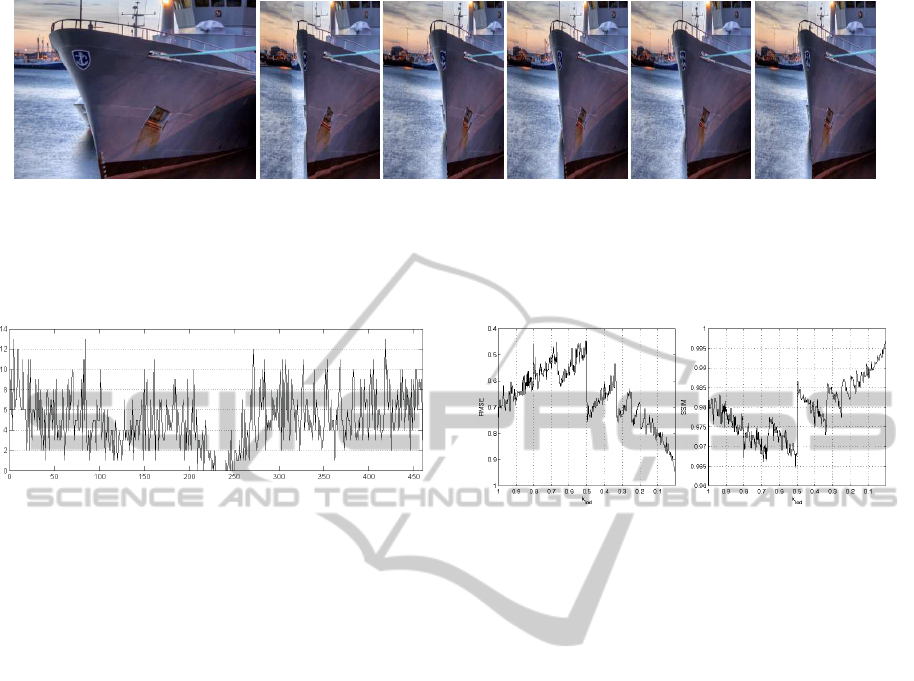
results in this work. For illustrating the whole pro-
cess, Figure 4 reports the sampling of p
d
(i) for the
image of Figure 2 for a width scaling ratio s
w
= 0.5
and k
lod
= 0.1. In the picture y values correspond to
how many times the line l
i
was drawn from the dpmf.
In the plot is evident how lines belonging to salient re-
gions are drawn rarely or not drawn at all, leaving the
underlying content undeformed.
3.2 k
lod
Parameter Selection
The whole procedure is automatic, just the parame-
ter k
lod
requires to be tuned. Since it influences the
quality of the result, it should be as smaller as pos-
sible. However, the computation time is in inverse
proportion to the parameter value, so it should be de-
termined as the best trade-off between quality and ef-
ficiency. For a visual evaluation purpose, we report
the results using different values for k
lod
(1, 0.5, 0.1,
0.05 and 0.01), see Figure 3. The results show that us-
ing a coarse level of detail causes artifacts. However,
using too fine level of detail is not useful, since the
resulting image quality does not get remarkable im-
provements. However, visual inspection is not suffi-
cient to determine how to choose k
lod
. More objective
cues are derived by measuring the variations of two
image difference indexes: Root Mean Squared Error -
RMSE and Structural Similarity - SSIM (Wang et al.,
2004). Measures have been computed between the
image produced using the highest level of detail (ap-
proximated using a very low value of k
lod
= 0.001)
and the one resulting using a k
lod
value varying in
the interval [0.001,1]. The results of this experimen-
tation are shown in Figure 5. In Figure 5(a) the re-
sults are better for lower values of RMSE. In Figure
5(b) the results are better for higher values of SSIM.
The plots exhibit jumps which are due to interpola-
tion artifacts that arise during image reconstruction.
VISAPP2014-InternationalConferenceonComputerVisionTheoryandApplications
404
(a) (a) original (b) (b) k
lod
= 1 (c) (c) k
lod
= 0.5 (d) (d) k
lod
= 0.1 (e) (e) k
lod
= 0.05 (f) (f) k
lod
= 0.01
Figure 3: Detail of an output image using different values for k
lod
and scaling ratio s
w
= 0.5. From left to right: (a) original
image, (b) k
lod
= 1, (c) k
lod
= 0.5, (d) k
lod
= 0.1, (e) k
lod
= 0.05, (f) k
lod
= 0.01. Even though the effect is more noticeable
when the images are larger, as it can be seen in this image portion, the finest results are provided using a high level of detail.
However, values of k
lod
smaller than 0.1 do not provide remarkable improvements.
Figure 4: Plot of the sampling of the dpmf for the picture
shown in Figure 2. Each column corresponds to the number
of times each column was drawn from the dpmf.
Such artifacts get smaller as k
lod
decreases. When k
lod
approaches values around 0.1, jumps disappear, the
trend becomes asymptotic and the quality of the result
has very low variations. As a consequence k
lod
= 0.1
is assumed to be used for the referred results in the
next sections.
4 EXPERIMENTAL RESULTS
AND DISCUSSION
The described method was implemented on a PC with
Quad CPU 2.30 GHz. The system can benefit from
parallel computation by leveraging gpGPU capabili-
ties being implemented using Nvidia CUDA API ex-
tensions (CUD, 2007).
Comparison. To evaluate the results of our system,
we compared it with other literature retargeting sys-
tems. For space reasons, this paper references four
methods: Multi-operator (Rubinstein et al., 2009),
non-homogeneous warping (Wolf et al., 2007), seam
carving (Rubinstein et al., 2008)and scale-and-stretch
(Yu-Shuen Wang and Lee, 2008). However, several
other methods were compared and the reader is re-
ferred to the supplemental material provided with this
paper. The evaluation was assessed using the datasets
and measures provided by the RetargetMe compara-
tive study (Rubinstein et al., 2010). Examples of com-
(a) (b)
Figure 5: Plot of RMSE (a) and SSIM (b) against k
lod
value
with scaling ratio s
w
= 0.5. In (a) the results are better
for lower values of RMSE. In (b) the results are better for
higher values of SSIM. Image quality plots exhibit jumps
due to interpolation artifacts that arise during image recon-
struction. However, such artifacts get smaller as k
lod
de-
creases. When k
lod
approaches values around 0.1, jumps
disappear, the trend becomes asymptotic and the quality of
the result has very low variations.
parisons are shown in Figure 6.
Additionally to qualitative images inspection, an
objective evaluation was also taken. Two comparative
measures were used for this purpose: Earth Mover’s
Distance (EMD) (Pele and Werman, 2009) and SIFT-
flow (Liu et al., 2008). These are two commonly
used similarity metrics, which do not require the two
datasets to be the same size, a binding property for
image retargeting. Both measures use a dense SIFT
descriptor (Lowe, 2004), which captures structural
properties of the image robustly, while EMD also uses
a state of the art color descriptor (ciede2000). The
two measures both endorse their solutions to small
and smooth local displacements, reflecting the way
human vision system tolerates deformations and the
operations applied by retargeting operators.
Results, summarized in Table 1, show that the
images produced with the proposed method provide
measures comparable to literature methods, or even
better. Most of the existing literature methods, tend
to warp the whole image and make them fit it into the
new frame size. However, often the periphery of the
Monte-CarloImageRetargeting
405
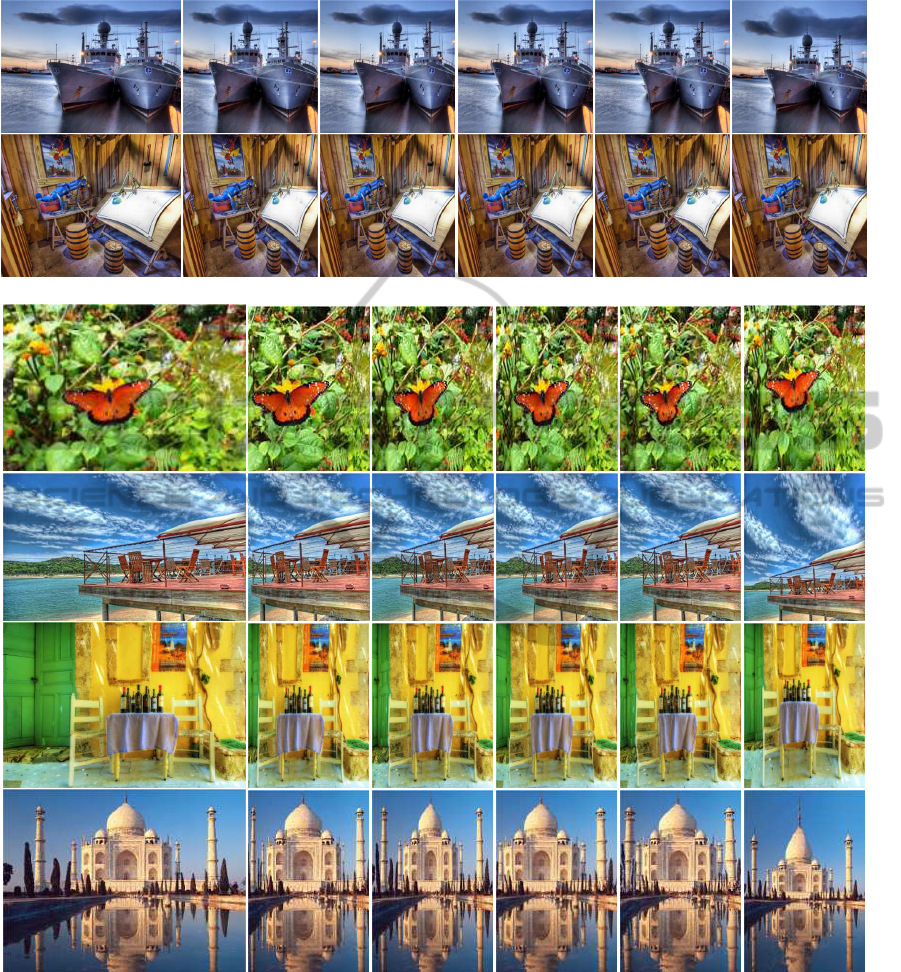
(a) original (b) monte-carlo (c) multi-op (d) nonhom.warp (e) seam-carving (f) sns
(a) original (b) monte-carlo (c) multi-op (d) nonhom.warp (e) seam-carving (f) sns
Figure 6: Comparison results for some (a) test images: methods reported are (b) our Monte Carlo method, (c) Multi-operator
(Rubinstein et al., 2009), (d) non-homogeneous warping (Wolf et al., 2007), (e) seam-carving (Rubinstein et al., 2008) and
(f) scale-and-stretch (Yu-Shuen Wang and Lee, 2008). The first two rows are compressed using s
w
= 0.75, while the last
four rows are compressed with s
w
= 0.5. Note how in the butterfly and deck images, low-saliency periphery content has been
cropped by extreme line compression, allowing more space for important image data.
image is not required to be kept. Our method allows
intrinsically to discard the whole periphery data, if it
is not salient, by strongly compressing it, thus achiev-
ing a certain extent of cropping. This allows to keep
more space for important image regions, which can
be better preserved without introducing heavy defor-
mations.
VISAPP2014-InternationalConferenceonComputerVisionTheoryandApplications
406

Table 1: EMD and SIFTflow measures for images of Retar-
getMe framework.
Measure EMD SIFTflow
Monte-carlo 8.01± 3.23· 10
3
3.98± 2.02· 10
5
Multi-operator 8.30± 3.58· 10
3
3.94± 1.99· 10
5
Non-homogeneous 8.68±3.73· 10
3
4.12± 2.15· 10
5
Seam carving 8.69± 3.60· 10
3
4.09± 2.38· 10
5
Scale and stretch 8.95± 3.82· 10
3
5.37± 2.69· 10
5
4.1 Complexity Considerations
Looking at the proposed retargeting operator from a
complexity perspective, is possible to take both mem-
ory and computational considerations.
The memory amount required to store all the data
needed to retarget an image composed of s into one
composed of s
′
lines is the following:
• s real values to store the positions of the lines l
i
,
• s real values to store the dpmf,
• s
′
· k
lod
real values to store the samples extracted
from the dpm f,
As a consequence, the proposed method needs a total
of 2s · s
′
· k
lod
real values, keeping the memory com-
plexity polynomial.
From a computational point of view, the main bur-
den is related to the saliency extraction which is com-
mon in all of the retargeting methods, so it is not con-
sidered. For the same reason, image reconstruction
is not taken into account. The rest of the process is
accomplished by the following operations:
• Design of the dpmf. Each value p
d
(i) is designed
starting from the saliency S(i, j) using the max(·)
operator → polynomial,
• Sampling p
d
(i). This operation is repeated s
′
·k
lod
times → polynomial,
• Updating of the lines position l
i
according to the
extracted samples → polynomial.
Being all of the subprocess polynomial, the whole
procedure is polynomial too. In addition, all of the
previous operations can be easily implemented in par-
allel, since little or no dependencies exists both be-
tween data and processes. This allow very fast one-
shot retargeting of images, opposed to many of the
reference literature methods relying onto iterative op-
timization.
5 CONCLUSIONS AND FUTURE
WORKS
A novel efficient method for image retargeting was
presented. It is based on Monte Carlo sampling of the
deformation probability mass function of the image,
which is defined using the image saliency map. This
allows its use for real-time applications. Experimen-
tal results show that its performance are comparable
or even superior tested against more complex existing
systems. The method keeps its complexity very low
both from a memory and computational perspective,
also leveraging the parallelization of its processes.
Further work will involve overall system improve-
ments and its extension to video resizing. This issue
requires the introduction of a time-coherent saliency
map and further constraints. Additionally, the model
will be embedded in systems making use of retarget-
ing for real-time applications, such as personalized
media content distribution on mobile devices or the
web.
REFERENCES
(2007). NVIDIA CUDA Compute Unified Device Architec-
ture - Programming Guide.
Avidan, S. and Shamir, A. (2007). Seam carving for
content-aware image resizing. ACM Trans. Graph.,
26(3):10.
Dalal, N. and Triggs, B. (2005). Histograms of oriented gra-
dients for human detection. In Computer Vision and
Pattern Recognition, 2005. CVPR 2005. IEEE Com-
puter Society Conference on, volume 1, pages 886 –
893 vol. 1.
Harris, C. and Stephens, M. (1988). A combined corner and
edge detection. In Proceedings of The Fourth Alvey
Vision Conference, pages 147–151.
Hou, X., Harel, J., and Koch, C. (2012). Image signature:
Highlighting sparse salient regions. IEEE Trans. Pat-
tern Anal. Mach. Intell., 34(1):194–201.
Itti, L., Koch, C., and Niebur, E. (1998). A model of
saliency-based visual attention for rapid scene anal-
ysis. IEEE Transactions on Pattern Analysis and Ma-
chine Intelligence, 20:1254–1259.
Liu, C., Yuen, J., Torralba, A., Sivic, J., and Freeman, W. T.
(2008). SIFT Flow: dense correspondence across dif-
ferent scenes. In ECCV.
Lowe, D. G. (2004). Distinctive image features from scale-
invariant keypoints. Int. J. Comput. Vision, 60(2):91–
110.
Pele, O. and Werman, M. (2009). Fast and robust earth
mover’s distances. In ICCV.
Rubinstein, M., Gutierrez, D., Sorkine, O., and Shamir, A.
(2010). A comparative study of image retargeting.
ACM Transactions on Graphics (Proc. SIGGRAPH
Asia), 29(5).
Rubinstein, M., Shamir, A., and Avidan, S. (2008). Im-
proved seam carving for video retargeting. ACM
Trans. Graph., 27(3):1–9.
Rubinstein, M., Shamir, A., and Avidan, S. (2009). Multi-
operator media retargeting. ACM Transactions on
Monte-CarloImageRetargeting
407

Graphics (Proceedings SIGGRAPH 2009), 28(3):1–
11.
Santella, A., Agrawala, M., Decarlo, D., Salesin, D., and
Cohen, M. (2006). Gaze-based interaction for semi-
automatic photo cropping. In In CHI 2006, pages
771–780.
Suh, B., Ling, H., Bederson, B. B., and Jacobs, D. W.
(2003). Automatic thumbnail cropping and its effec-
tiveness. In UIST ’03: Proceedings of the 16th annual
ACM symposium on User interface software and tech-
nology, pages 95–104, New York, NY, USA. ACM.
Viola, P. and Jones, M. (2001). Robust real-time object de-
tection. In International Journal of Computer Vision.
Wang, Z., Bovik, A. C., Sheikh, H. R., Member, S., and
Simoncelli, E. P. (2004). Image quality assessment:
From error measurement to structural similarity. IEEE
Trans. Image Processing, 13:600–612.
Wolf, L., Guttmann, M., and Cohen-Or, D. (2007). Non-
homogeneous content-driven video-retargeting. In
Proceedings of the Eleventh IEEE International Con-
ference on Computer Vision (ICCV-07).
Yu-Shuen Wang, Chiew-Lan Tai, O. S. and Lee, T.-Y.
(2008). Optimized scale-and-stretch for image resiz-
ing. ACM Trans. Graph. (Proceedings of ACM SIG-
GRAPH ASIA, 27(5).
VISAPP2014-InternationalConferenceonComputerVisionTheoryandApplications
408
