
Region-constrained Feature Matching with Hierachical
Agglomerative Clustering
Jung-Whan Jang, Mostafiz Mehebuba Hossain and Hyuk-Jae Lee
Inter-university Semiconductor Research Center, Department of Electrical Engineering,
Seoul National University, Seoul, Korea
Keywords: SIFT, Feature Detector, Feature Correspondence, Clustering, Segmentation.
Abstract: Local feature matching is one of the most fundamental issues in computer vision. Hierarchical
agglomerative clustering (HAC) has been effectively used to distinguish inliers from outliers. The drawback
of HAC is its large computational complexity which increases rapidly as the number of feature
correspondences increases. To overcome this drawback, this paper proposes a region-constrained feature
matching in which an image is segmented into small regions and feature correspondences are clustered
inside each region. Adjacent segmented regions are merged to form larger regions if the correspondences
inside regions are similar. The merge may increase the accuracy of clustering, and consequently, it improves
the accuracy of matching operations as well. The proposed region-constrained clustering dramatically
reduces the execution time by as much as 500 times compared to the previous clustering while it achieves a
similar matching accuracy.
1 INTRODUCTION
Due to a popular use of high-resolution image
sensors, high-definition (HD) images are widely
available in high-resolution CCTV cameras and
broadcasting cameras as well as mobile devices such
as mobile phones. A large amount of data in an HD
image requires a large computing power to process
image search, classification and recognition. Local
feature matching has been one of the widely used
techniques for object recognition. Hierarchical
agglomerative clustering (HAC) has been effectively
used to distinguish inliers from outliers but it suffers
from its large computational complexity which
increases rapidly as the number of feature
correspondences increases. To reduce the
computational complexity of HAC, this paper
proposes a region-constrained feature matching in
which an image is segmented into small regions and
feature correspondences are clustered inside each
region.
Local invariant features have been widely used
for image recognition because they are robust in
noise, light variation, and viewpoint change (Lowe,
2004; Bay et al., 2008; Rosten et al., 2010). Image
recognition based on local feature matching is
performed by finding the correspondences between
local features in different images. The local feature
matching has been used in a number of applications,
such as image stitching, 3D reconstruction, and
object identification. To find similarities between
features, Euclidean distance is calculated between
the feature vectors and the nearest neighbour
descriptor is selected or the distance ratio between
the nearest neighbour descriptor and second nearest
descriptor is used. The correspondence using only
similarity of feature vector may not always result in
the correct correspondence because comparison of
local patch may find partial similarity between
descriptors. Therefore, differentiation between
correct correspondences (inliers) and incorrect
correspondences (outliers) is needed. Hence,
effective methods to distinguish the inliers from the
outliers have been extensively investigated.
In (Lowe, 2004), an image is assumed to be a
rigid scene, and RANSAC (RANdom SAmple
Consensus) is used to fit a model to experimental
data and to reject inconsistent matches. However,
this method is not effective in the case of non-rigid
image deformation or complicated scene which
cannot be represented by an affine transform. A
number of image feature matching studies for non-
rigid image deformation have been conducted. One
promising approach for non-rigid image matching is
15
Whan Jang J., Mehebuba Hossain M. and Lee H..
Region-constrained Feature Matching with Hierachical Agglomerative Clustering.
DOI: 10.5220/0004744800150022
In Proceedings of the 9th International Conference on Computer Vision Theory and Applications (VISAPP-2014), pages 15-22
ISBN: 978-989-758-003-1
Copyright
c
2014 SCITEPRESS (Science and Technology Publications, Lda.)
a use of the geometric information among local
features. These approaches find corresponding pairs
or triplets of points in the graph consisting of
features with properties of the distance and angle
between feature points in the image which generally
remains unchanged. This matching is performed by
considering the spatial layout between keypoints. If
there are many correspondences in an image, the
property of the invariant distance and angle can be
generated by a combination of mismatched points.
Therefore incorrect matching results can be
generated. In addition, this graph matching method
requires its computational complexity increasing
exponentially as the number of feature points
increases (Gomila and Meyer, 2003; Duchenne et
al., 2011;
Torresani et al., 2008).
Another approach for improved non-rigid image
matching uses clustering to get reliable feature set
(Cho et al., 2009). This approach repeatedly
performs clustering with all the feature
correspondence in an image until all inter-cluster
similarity is larger than the intra-cluster similarity.
Although this method successfully improves the
accuracy of matching results, it also suffers from a
rapid increase of the computational complexity with
the increase of the number of correspondences. As a
result, a fast algorithm to reduce the complexity is
necessary for a practical use.
This paper proposes a novel feature matching
algorithm that reduces the computational complexity
of the clustering-based outlier exclusion. The
proposed algorithm segments an image into small
regions and performs clustering only inside the
candidate region. Adjacent segmented regions are
merged to form larger regions if the correspondences
inside regions are similar. The merge may increase
the accuracy of clustering, and consequently, it
improves the accuracy of matching operations as
well. As the proposed algorithm uses only candidate
regions for clustering while the previous clustering
algorithm uses the whole image, the increase of the
complexity of the proposed algorithm is much less
than that of the previous algorithm.
This paper is organized as follows. Related
works are introduced in Section II and the proposed
feature matching algorithm is proposed in Section III.
Section IV presents experimental results and Section
V concludes this paper.
2 RELATED WORKS
This section describes HAC (Hierarchical
Agglomerative Clustering) algorithm which is used
as the base clustering algorithm in this paper
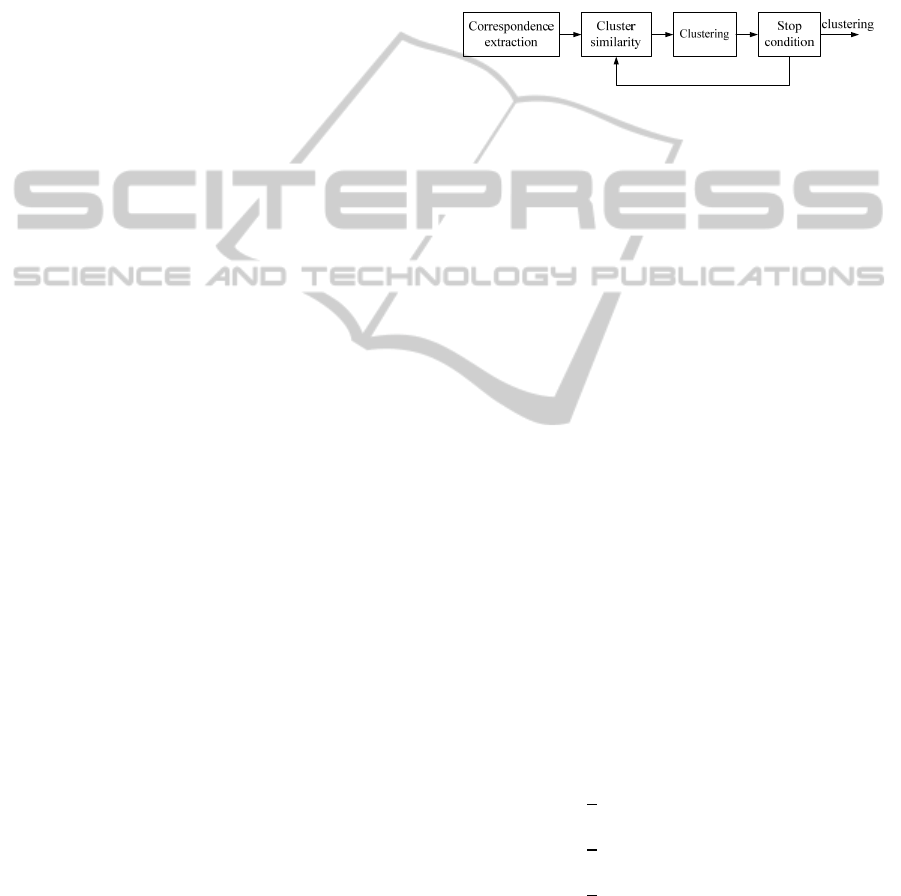
(Friedman et al., 2009). Figure 1 depicts the flow of
a general clustering algorithm. The first step
(Correspondence extraction) generates the features
that characterize the object to recognize. In the
second step (Cluster similarity), similarities between
features are measured. These similarities are used
for clustering in the next step, and then these two
steps are performed repeatedly until all inter-cluster
similarity is larger than intra-cluster similarity.
Figure 1: A general flow of a clustering algorithm.
HAC is one of the clustering algorithms that
adopts the same flow as Figure 1. A brief description
of HAC is given as follows (Xu et al., 2005).
HAC Algorithm
Step 1: Determine all inter-
correspondence similarities
Step 2: Select two closest
correspondences or clusters and
form a cluster
Step 3: Redefine similarities between
the new cluster generated in
Step 2 and the other
correspondences or clusters
Step 4: Return to Step 2 until inter-
cluster similarity is larger
than intra-cluster similarity
For a formal definition of geometric similarity,
the distance between two matches
and
is
defined next. Let and be two keypoints in
different images matched by homography
. Let
and
denote the respective positions of keypoints
and. Let the match between and be denoted
by
,
,
. Between two feature
correspondences
,
,
and
,
,
,
the distance is defined as follows (Cho et al., 2009):
,
1
2
|
|
|
1
2
|
1
2
1
where |∙| denotes Euclidean distance.
Let and represent two clusters of matches.
Then, the dissimilarity between the two clusters is
defined as the distance between closest matches of
VISAPP2014-InternationalConferenceonComputerVisionTheoryandApplications
16

the two clusters.
,
∀
∈,∀
∈
,
(2)
3 THE PROPOSED ALGORITHM
This section proposes a HAC-based clustering
algorithm that attempts to reduce the computational
complexity without a significant decrease of
matching accuracy. The algorithm is developed
under the assumption that SIFT is used as the local
feature. To reduce the computational complexity of
HAC, an image is segmented into small regions and
feature correspondences are clustered inside each
region. Adjacent segmented regions are merged to
form larger regions if the correspondences in the
adjacent regions are similar. The merge may
increase the accuracy of clustering, and
consequently, it may improve the accuracy of
matching operations as well.
3.1 Region-Constrained Clustering
This paper proposes a region-constrained clustering
that sets the candidate regions with similar attributes
and perform clustering with feature points inside the
candidate regions.
(a) (b)
Figure 2: (a) HAC. (b) Region-constrained clustering.
Figure 2 shows the difference between the
original HAC and region-constrained clustering. The
dashed-ellipse in Figure 2(b) indicates the candidate
regions. Both methods use the same feature points,
however region-constrained clustering perform
clustering only for feature points within the
candidate regions.
3.2 Geometric Relationship in
Correspondences
Let P and Q denote a set of local features obtained
from two images, respectively. Feature vectors
,
from two feature set P, Q are respectively
represented by
,
,
,
,
(3)
,
,
,
,
(4)
where
,
indicate coordinates of the
corresponding keypoint position,
and
is the
scale and orientation information.
is a feature
vector, called descriptor.
Initially, correspondences are evaluated by
comparing the distance of the closest neighbour to
that of the second-closest neighbour (Lowe, 2004).
From these initial correspondences, the geometric
similarity homography for each correspondence is
used to perform HAC inside each region. The
similarity is estimated from a pair of SIFT
descriptors for a given correspondence. Each SIFT
descriptor carries information about the scale and
orientation. Thus, the homograph matrix for a
correspondence can be expressed as the product of
matrices with the scale, rotation and translation
information.
h
S
∆σ
R
∆
θ
T
∆x,∆y
∆ 0 0
0∆0
001
∆∆0
∆ ∆ 0
001
10∆
01∆
001
(5)
where ∆σ
/
, ∆θ
and ∆, ∆ are
given as follows.
∆
∆σcos∆
θ
∆σsin∆
θ
(6)
∆
∆σsin∆
θ
∆σcos∆
θ
(7)
3.3 Constrained Region
The area of the region may affect the accuracy and
complexity of the proposed algorithm. It is often the
case that object segmentation results in an image
with over-segmented regions. In this case, the
clustering constrained by the over-segmented
regions may not reflect the nature of the
correspondence. Therefore, this subsection proposes
an algorithm that merges the over-segmented
regions into large regions if they are turned out to be
similar regions. The merge of regions may improve
the accuracy of feature matching operations.
3.3.1 Region Homography Matrix
The segmented regions generated by a segmentation
algorithm such as watershed transform needs to be
merged and then used as candidate regions for
clustering. This paper defines the homography
matrix of each region and by using the similarity of
homography matrix, it merges a set of regions which
are likely to be used to constrain the boundary of a
clustering operation inside the region.
Region-constrainedFeatureMatchingwithHierachicalAgglomerativeClustering
17
From the homography of a feature correspondence
given by (5), the homography of a region
correspondence is defined as the regional average
homography of feature correspondence. The formal
definition is given as (8). If there exist feature
correspondences in the area
the area homography
of
is formulated as the product of the average
ratios of the scale, the differences of rotation and
translation.
S∆
R∆
T∆
,∆
(8)
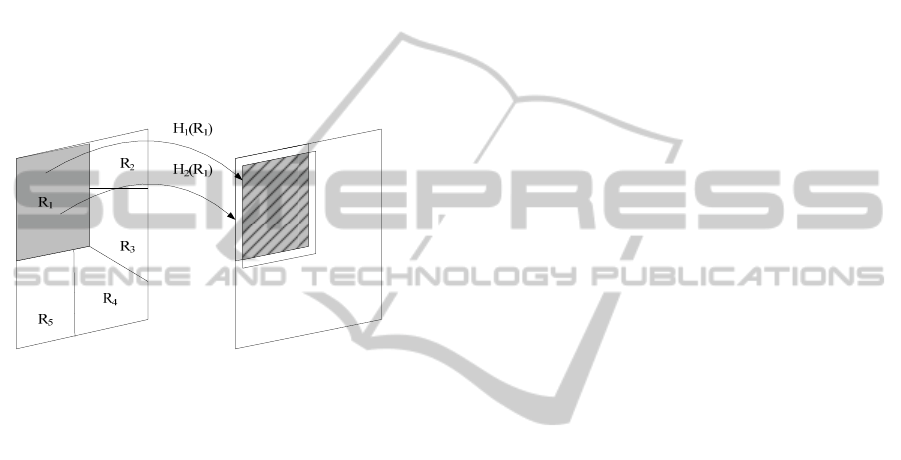
3.3.2 Region Similarity
Figure 3: Region homography projection.
This subsection discusses a method to measure the
similarity of the region homography matrices.
Suppose that the two adjacent regions
and
in
Figure 3 have region homographies
and
,
respectively. If there is a similarity between
and
, the regions projected by
and
must be
similar, that is, the two projected regions must be
largely overlapped. Based on the above observation,
the similarity measure between two homographies is
derived from the overlapped region.
The overlapped region may be affected by the
area and shape of the region. To avoid this affect,
this paper defines an overlapping criterion that is
insensitive to the area and shape of a region. To this
end, a circle with the fixed size (corresponding to
radius 30), is used for the similarity measure. This
circle is called the unit circle (
) hereafter in this
paper. Note that a similar idea has been used in
(Mikolajczyk et al., 2005) to measure the matching
score in affine region detectors.
Region
projected by
is expressed by the
product of two matrices. Matrix
is defined to
represent all the pixels in region
.
,
,1
where for all (
,
∈
(9)
The region projected by
is defined as follows:
(10)
For two adjacent regions
,
having
homography
,
, respectively, the region
similarity between the regions are formulated as
follows:
Regionsimilarity
,
1,
∩
∅
0,
∩
∅
(11)
where
represents the matrix representing all
points in
, that is
,
,1
where for all
(
,
∈.
In the above definition, similarity is “1” when the
two projected regions are overlapped. It is “0”,
otherwise. When the region similarity is “1”, then
the corresponding two regions are combined to make
a new region
∪
for the independent
clustering operation.
The clustering accuracy is large when the
number of the inliers is larger than that of the
outliers in each region. The proposed algorithm
increase the accuracy by merging regions for the
case when the number of correspondences in over-
segment region is too small. Furthermore, the results
of the clustering operation inside a single region
becomes reliable when the regions are composed of
a set of similar homographies because the clustering
operations use the homography similarity between
correspondences.
For a reduction of computational complexity,
region merge is performed only among adjacent
regions. To this end, the segmented regions are
expressed by a graph which is commonly used data
structure for representing partitions (Kim et al.,
2010). Using this graph, the detection of adjacent
regions is easy to perform.
3.3.3 Complexity Analysis
Figure 4 shows the flow of the proposed algorithm
which segments an input image into small regions to
constrain the clustering operation. Using the result
of the initial correspondence, regions are merged to
form large regions. Then, HAC is performed for
correspondences in each region. The final clustering
result is obtained by collecting all the HAC results in
every region.
With a pair of N correspondences, conventional
HAC requires the construction of at most 1
clusters, and so
1 iterations (Step 2, 3, and 4) are
required. In addition, O
operations are required
in order to compute the similarity between clusters.
Therefore, the complexity is
O
. On the other
VISAPP2014-InternationalConferenceonComputerVisionTheoryandApplications
18
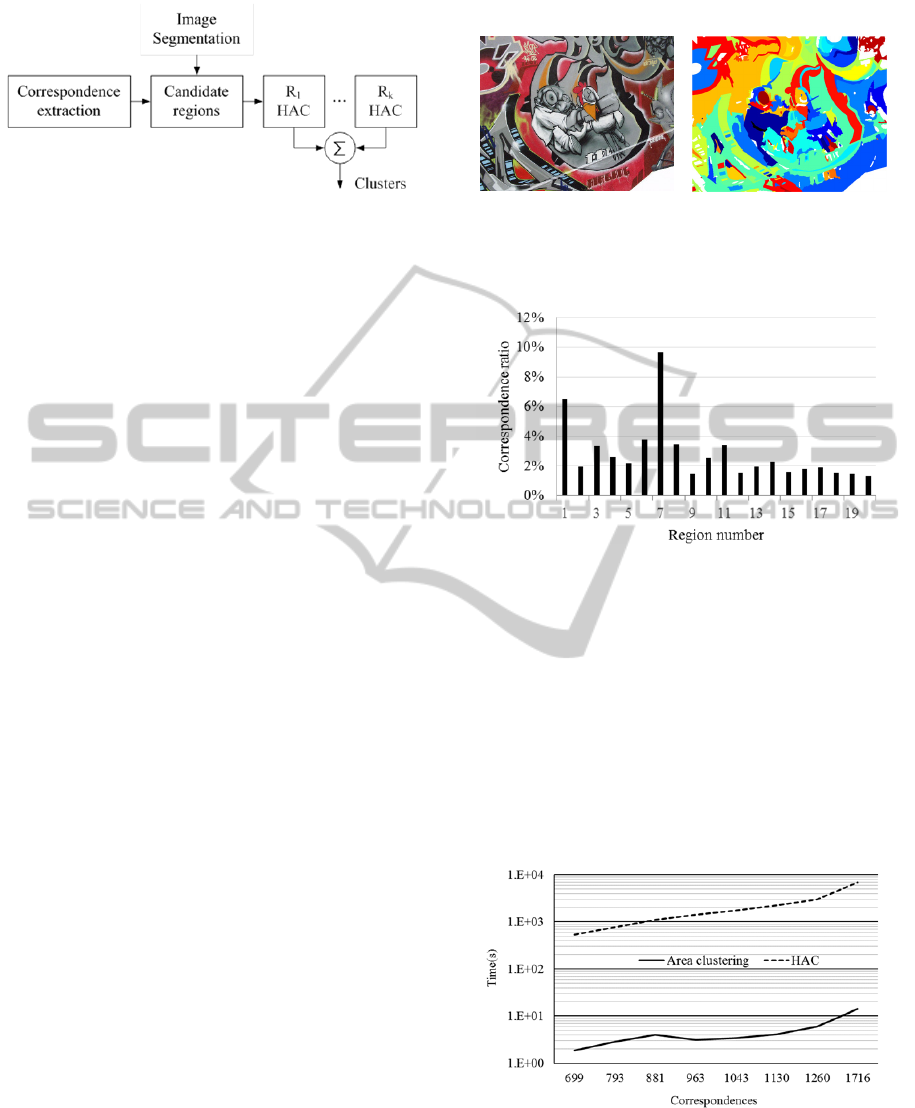
Figure 4: The flow of the proposed clustering algorithm.
hand, the complexity of the proposed algorithm
depends on the number of regions. Suppose that an
image is segmented into k regions. Let
,
,⋯
,
denote the number of correspondences in the k
regions.
Then, equations (12) and (13) are true. Note
that the computational complexity of the i
th
region is
O
. Equation (13) proves that the proposed
algorithm requires much less complexity than that
the conventional HAC does.
,
∩
∅
(12)
⋯
≪
(13)
4 EXPERIMENTAL RESULTS
Experiments are conducted with two dataset with
shared contents. One is the eccv dataset used in
(Ferrari et al, 2006) that consists of 9 model objects
and 23 test images with a relatively small number of
correspondences. The other is Oxford dataset that
has been used for performance evaluation of affine
area detectors and local descriptors. The data sets
consist of images which are distorted by various
degradation (viewpoint change, image blur, JPEG
compression artifacts and illumination change).
Oxford dataset includes homography mapping
between the reference and distorted target images
that give the ground truth correspondences. These
dataset images are large and complex, composed of
a large number of correspondences.
The initial correspondences are generated using
the method of NNDR in (Lowe, 2004). Initial
correspondece and segemtation results are used to
derive candidate areas. Figure 5 shows the candidate
areas obtained by the proposed algorithm with
Graffiti image of Oxford dataset. As shown in
Figure 5(b), different candidate areas are represented
by different colors. The white colored areas includes
one or no correspondence, and therefore, they are
excluded from the clustering operations because
clustering needs at least two correspondences to
calculate similarity between correspondences.
(a) (b)
Figure 5: Candidate areas for clustering over Graffiti
image. (a) Original image. (b) Candidate areas with colors
representing segmentation results.
Figure 6: The ratio of each candidate area correspondences
against the total correspondences over Graffiti image.
Figure 6 shows the ratio of the number of
correspondences in the candidate area and the
number of correspondences in the whole image. This
figure shows only the 20 candidate areas with the
most correspondences. The result shows that the
ratio is less than 10% for all candidate areas. Recall
that the complexity is reduced when the number of
correspondences in each area is small (see (13)).
Therefore, the calculation time can be significantly
reduced.
Figure 7: Comparison of execution time between area
clustering and HAC.
Figure 7 shows the execution time according
tothe number of correspondences using Oxford
Graffiti dataset. The horizontal axis represents the
Region-constrainedFeatureMatchingwithHierachicalAgglomerativeClustering
19
number of correspondences, which is generated by
NNDR. The vertical axis represents the execution
time in the logarithmic scale. The execution time is
measured using a single-core Intel i5-750 processor
running at 2.67Ghz. With an increasing number of
correspondences, the difference between area
clustering and the HAC increases dramatically. Note
that the execution time of the area clustering
includes segmentation algorithm that generates
candidate regions.
Table 1: Recognition results over Oxford dataset.
Bikes Graffiti Boat Leuven
Propose
cluster size
733 1055 2131 1096
Proposed
Matching
score
72.7% 67.7% 78% 78.8%
HAC
cluster size
886 1056 2133 1189
HAC
Matching
score
65.4% 67.8% 76.3% 74.9%
Table 1 shows the accuracy of the proposed
clustering and the HAC. In order to evaluate the
accuracy, the value of the matching score is used,
which is often used as the metric in feature matching
algorithms (Mikolajczyk et al., 2005). For this
experiment, Oxford dataset is used with several
hundred initial feature correspondences in each
image pair. In all dataset images, the values of the
affine transform are presented. The proposed
algorithm gives a matching score higher than the
original HAC. The cluster size of the proposed
algorithm is the sum of each candidate region’s
clustering results. Although the cluster size is
reduced when compared to HAC, the proposed
algorithm achieves the higher matching score. This
indicates that the proposed algorithm effectively
removes outliers.
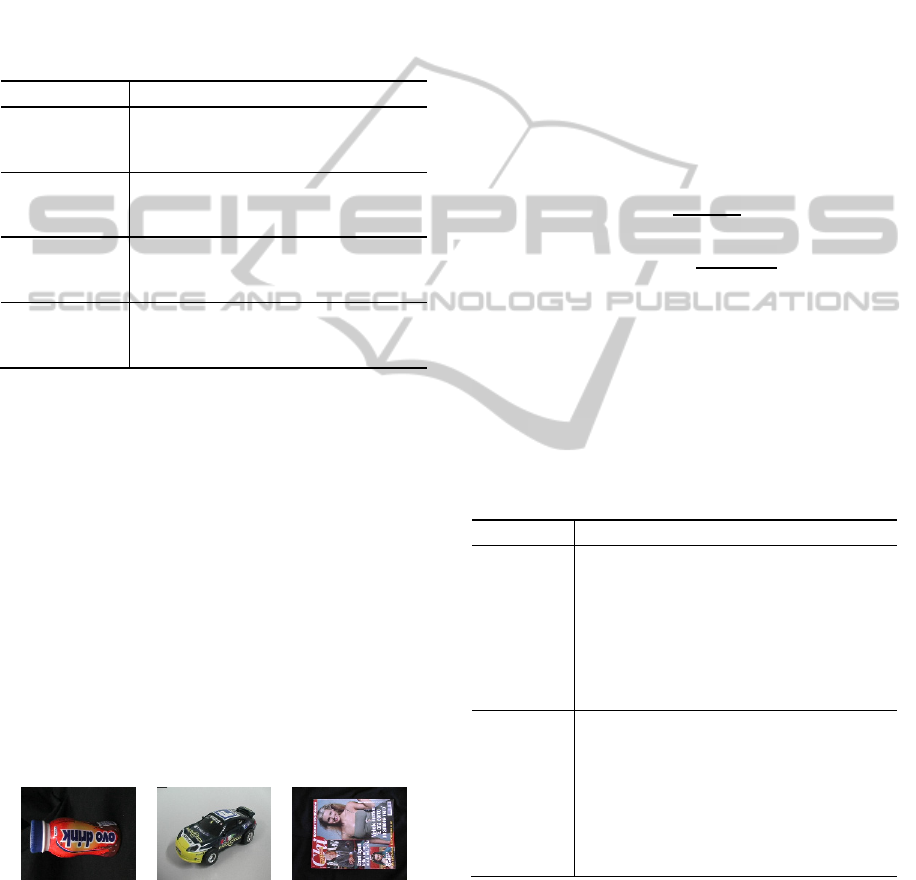
Figure 8: Models used in Figure 9.
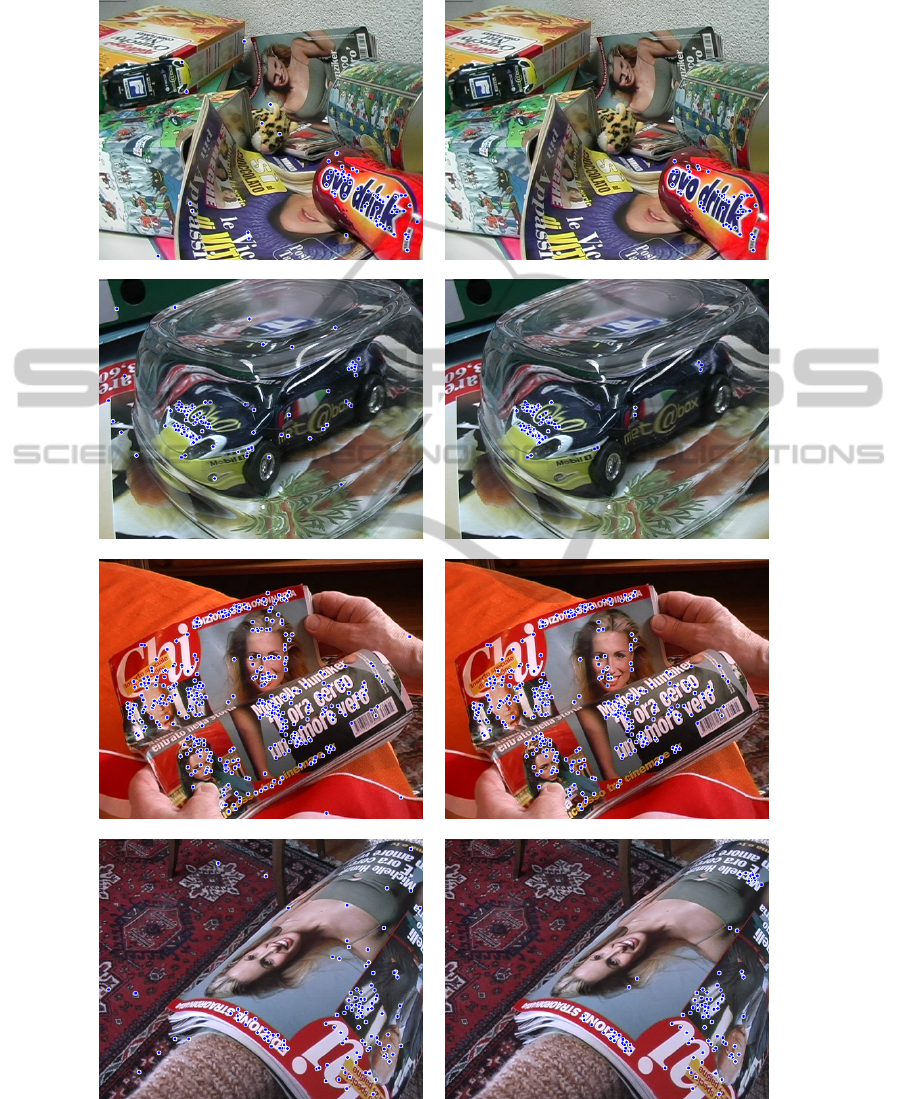
Figure 8 shows the models in the test images
shown in Figure 9 which shows the correspondences
obtained from the experiments with the dataset that
has been used in (Ferrari et al, 2004). Figure 9 (a),
(c), (e), and (g) show the experimental results of
HAC whereas Figure (b), (d), (f) and (h) show the
results obtained by the proposed algorithm. The blue
circles show the correspondences which have been
determined to be inliers by clustering. The number
of clusters in the proposed algorithm is small but
inliers are only on the object. The candidate area
clustering is not affected by the correspondences in
the other area, and therefore, the possibility of
forming a cluster by outlier is reduced.
For the evaluation of the recognition accuracy,
the recall and precision rates are evaluated. Recall
and precision are based on the number of correct and
false matches between two images. Among positive
and negative matches, there are four possibilities, TP
(True Positive), FP (False Positive), TN (True
Negative), and FN (False Negative). Recall and
Precision are defined as follows:
(14)
1
(15)
Table 2 shows the precision and recall of figure 9.
Generally, the precision of the proposed algorithm is
high. However, the recall is less than the original
HAC because the proposed algorithm performs
clustering with only feature points in the candidate
region.
Table 2: Recall and precision of the pairwise object
matching on eccv dataset in Figure 9.
(a)(b) (c)(d) (e)(f) (e)(h)
Proposed
cluster size
51 79 340 100
Proposed
recall
0.71 0.71 0.85 0.67
Proposed
precision
0.96 0.95 0.99 0.95
HAC
cluster size
78 124 408 120
HAC
recall
0.81 0.92 0.97 0.70
HAC
precision
0.72 0.78 0.95 0.83
5 CONCLUSIONS
This paper proposes a region-constrained clustering
algorithm for outlier identification. An image is
segmented into small regions with similar geometric
VISAPP2014-InternationalConferenceonComputerVisionTheoryandApplications
20

properties and then HAC is performed with
correspondences only inside every region. The
possibility of incorrect clustering by the
correspondence outside the region is reduced. The
proposed algorithm is faster when compared to the
conventional HAC, as in the conventional HAC, the
complexity exponentially increases with the increase
of the input data size. Therefore, the proposed
algorithm is effective in an image with dense
correspondences.
The proposed algorithm uses region similarity to
merge regions to increase the region of clustering
operation and the accuracy of the clustering result.
Future research may investigate an effective merge
algorithm.
ACKNOWLEDGEMENTS
This work was supported by the Technology
Innovation Program (10039188, Development of
multimedia convergence programmable platform for
mart vehicles) funded by the Ministry of Trade,
Industry and Energy (MOTIE, Korea).
REFERENCES
Lowe, D. G. (2004). Distinctive image features from
scale-invariant keypoints. International journal of
computer vision, 60(2), 91-110.
Bay, H., Ess, A., Tuytelaars, T., & Van Gool, L. (2008).
Speeded-up robust features (SURF). Computer vision
and image understanding, 110(3), 346-359.
Rosten, E., Porter, R., & Drummond, T. (2010). Faster and
better: A machine learning approach to corner
detection. Pattern Analysis and Machine Intelligence,
IEEE Transactions on, 32(1), 105-119.
Gomila, C., & Meyer, F. (2003). Graph-based object
tracking. In Image Processing, 2003. ICIP 2003.
Proceedings. 2003 International Conference on (Vol.
2, pp. II-41). IEEE.
Duchenne, O., Bach, F., Kweon, I. S., & Ponce, J. (2011).
A tensor-based algorithm for high-order graph
matching. Pattern Analysis and Machine Intelligence,
IEEE Transactions on, 33(12), 2383-2395.
Cho, M., Lee, J., & Lee, K. M. (2009). Feature
correspondence and deformable object matching via
agglomerative correspondence clustering. InComputer
Vision, 2009 IEEE 12th International Conference
on (pp. 1280-1287). IEEE.
Friedman, J., Hastie, T., & Tibshirani, R. (2009). The
Elements of Statistical Learning: Data Mining,
Inference, and Prediction. Springer Series in Statistics.
Xu, Rui, and Donald Wunsch. "Survey of clustering
algorithms." Neural Networks, IEEE Transactions
on 16.3 (2005): 645-678.
Mikolajczyk, K., & Schmid, C. (2005). A performance
evaluation of local descriptors. Pattern Analysis and
Machine Intelligence, IEEE Transactions on, 27(10),
1615-1630.
Ferrari, V., Tuytelaars, T., & Van Gool, L. (2006).
Simultaneous object recognition and segmentation
from single or multiple model views. International
Journal of Computer Vision, 67(2), 159-188.
Ferrari, V., Tuytelaars, T., & Van Gool, L. (2004).
Simultaneous object recognition and segmentation by
image exploration. In Computer Vision-ECCV
2004 (pp. 40-54). Springer Berlin Heidelberg.
Kim, T. H., Lee, K. M., & Lee, S. U. (2010). A unified
probabilistic approach to feature matching and object
segmentation. In Pattern Recognition (ICPR), 2010
20th International Conference on (pp. 464-467). IEEE.
Mikolajczyk, K., Tuytelaars, T., Schmid, C., Zisserman,
A., Matas, J., Schaffalitzky, F., Kadir, T., and Gool, L.
V. (2005). A comparison of affine region detectors.
International Journal of Computer Vision, 65(1/2):43–
72.
Torresani, L., Kolmogorov, V., & Rother, C. (2008).
Feature correspondence via graph matching: Models
and global optimization. In Computer Vision–ECCV
2008 (pp. 596-609).
Region-constrainedFeatureMatchingwithHierachicalAgglomerativeClustering
21
APPENDIX
(a) (b)
(c) (d)
(e) (f)
(g) (h)
Figure 9: HAC versus area clustering (a),(c),(e),(g) show the results by HAC (b),(d),(f),(h) show the results by the proposed
area clustering.
VISAPP2014-InternationalConferenceonComputerVisionTheoryandApplications
22
