
Empirical Validation of Product-line Architecture Extensibility Metrics
Edson Oliveira Jr. and Itana M. S. Gimenes
Informatics Department, State University of Maring
´
a, Av. Colombo, 5790, Maring
´
a PR, Brazil
Keywords:
Empirical Validation, Extensibility, Metrics, Software Product Line Architecture, Variability Management.
Abstract:
The software product line (PL) approach has been applied as a successful software reuse technique for specific
domains. The SPL architecture (PLA) is one of the most important SPL core assets as it is the abstraction of
the products that can be generated, and it represents similarities and variabilities of a PL. Its quality attributes
analysis and evaluation can serve as a basis for analyzing the managerial and economical values of a PL. This
analysis can be quantitatively supported by metrics. Thus, we proposed metrics for the PLA extensibility
quality attribute. This paper is concerned with the empirical validation of such metrics. As a result of the ex-
perimental work we can provide evidence that the proposed metrics serve as relevant indicators of extensibility
of PLA by presenting a correlation analysis.
1 INTRODUCTION
The software product line (PL) engineering approach
has gained increasing attention over the last years due
to competitiveness in the software development seg-
ment. The economic considerations of software com-
panies, such as cost and time to market, motivate the
transition from single-product development to the PL
approach, in which products are developed in a large-
scale reuse perspective (Linden et al., 2007; Capilla
et al., 2013).
One of the most important assets of a PL is its ar-
chitecture (PLA). The PLA plays a central role at the
development of products from a PL as it is the abstrac-
tion of the products that can be generated, and it repre-
sents similarities and variabilities of a PL. PLAs pro-
vide a general notion of potential PL specific products
by means of the reuse of the PL core assets. In order
to derive specific products according to the company’s
main goals, PLAs must be evaluated. Such an evalu-
ation may occur by taking into consideration metrics
(Pohl et al., 2005; Capilla et al., 2013), which may
both evidence the quality of a PL and serve as a basis
to analyze the managerial and economical value of a
PL (Bckle et al., 2004). As a PLA must be encom-
pass similarities and variabilities, metrics are applied
to a set of assets from which variants can be generated
rather than one specific product. Therefore, specific
PLA quality attributes metrics must be defined and
validated to provide effective indicators with regard
to the overall PL development and evolution.
In this paper it is proposed PLA metrics for the ex-
tensibility quality attribute. Extensibility is measured
based on the relation between abstract classes and
methods over concrete classes and methods (Sane and
Birchenough, 1999; Smith, 2012). Both theoretical
and empirical validations (Briand et al., 1995; Bertoa
et al., 2006; Garc
´
ıa et al., 2009) are necessary to vali-
date a set of metrics. Theoretical validation of the ex-
tensibility metrics have been done in (Oliveira Junior
et al., 2008). Thus, this paper is concerned with the
empirical validation of the proposed metrics for PLA
extensibility quality attribute. Such a validation aims
at correlating the metrics with subject’s extensibility
rating, respectively, when generating PLA configura-
tions. A PLA configuration represents a specific PL
product with variabilities resolved.
This remainder of this paper is organized as fol-
lows: Section 2 presents the extensibility metrics to
be validated; Section 3 presents how the experimental
study was planned and carried out to validate the met-
rics; Section 4 discusses the results obtained in this
study; and Section 5 provides the conclusions and di-
rections for future work.
2 EXTENSIBILITY METRICS
FOR SOFTWARE PRODUCT
LINE ARCHITECTURES
Understand extensibility is essential from the PL
111
Oliveira Jr. E. and M. S. Gimenes I..
Empirical Validation of Product-line Architecture Extensibility Metrics.
DOI: 10.5220/0004745201110118
In Proceedings of the 16th International Conference on Enterprise Information Systems (ICEIS-2014), pages 111-118
ISBN: 978-989-758-028-4
Copyright
c
2014 SCITEPRESS (Science and Technology Publications, Lda.)

adoption point as a PL manager is able to analyze
the extensibility of the potential PL specific products
to be produced.
Organizations which have a developed PL core as-
set for a certain domain can analyze the extensibility
of the distinct configurations and the PL evolution.
Therefore, a PL manager may choose from a set of
feasible configurations which are the most interesting
to be produced.
The extensibility metrics for PLA were composed
based on the following extensibility principles (Sane
and Birchenough, 1999; Woolf, 1997; Smith, 2012):
the number of abstract methods divided by the total
number of methods (concrete plus abstract) of a class.
Each metric measures the extensibility of class, inter-
face and component based on one of the following PL
variability concepts:
• Variability, according to Capilla et al. (Capilla
et al., 2013), is “the ability of a software or arti-
fact to be changed, customized or configured for
use in a particular context.” Although a variabil-
ity can take place at different levels of abstraction
and artifacts, the extensibility metrics in this pa-
per address only class and component UML arti-
facts that result from PL activities (Oliveira Junior
et al., 2013; Oliveira Junior et al., 2010) and rep-
resents the PLA;
• Variation Point is the resolution of variabilities in
generic artifacts of a PL. According to Capilla et
al., (Capilla et al., 2013), “a variation point iden-
tifies one or more locations at which the variation
will occur.” Thus, a variation point may take place
at generic artifacts and at different levels of ab-
straction. Basically, a variation point answers the
question: What varies in a PL? (Pohl et al., 2005;
Capilla et al., 2013; Linden et al., 2007); and
• Variant represents the possible elements through
which a variation point may be resolved. It may
also represent a way to directly resolve a vari-
ability. Basically, a variant answers the question:
How does a variability or a variation point vary in
a PL? (Pohl et al., 2005; Capilla et al., 2013).
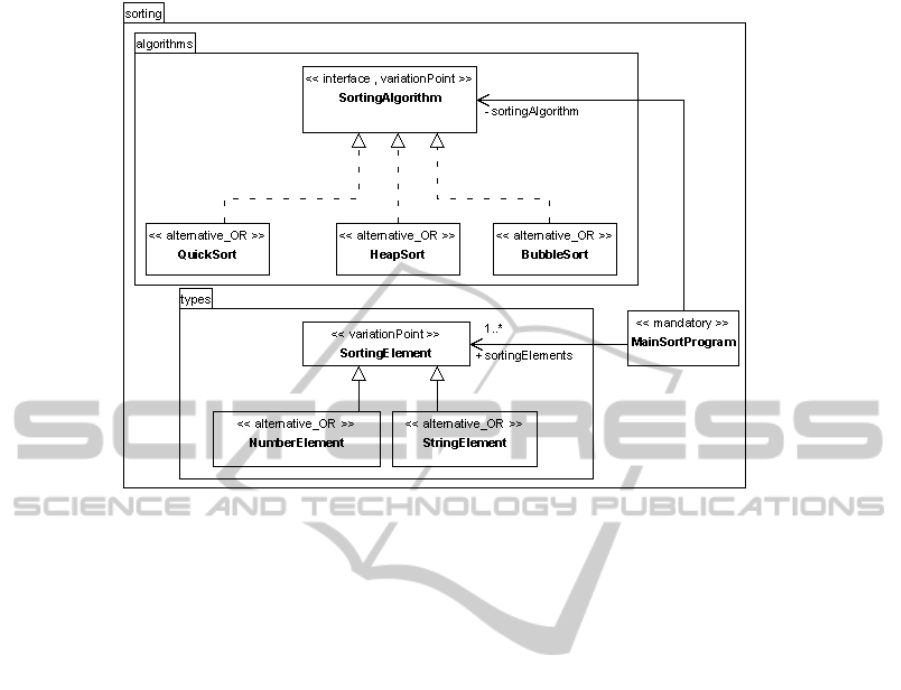
Figure 1 is an excerpt of a sorting fea-
ture, which has a variability aimed at sort-
ing elements by selecting a proper algorithm.
The variation points (SortingElement and
SortingAlgorithm) are annotated with the
stereotype variationPoint. The variants are
annotated with the stereotypes alternative OR
(NumberElement, StringElement, QuickSort,
HeapSort and BubbleSort) and mandatory
(MainSortProgram). Detailed information with
regard to the stereotypes used to annotate variability
concepts can be found in (Oliveira Junior et al.,
2010; Oliveira Junior et al., 2013). All classes and
interfaces from the algorithms package form the
component sorting.
The extensibility metrics taken into consideration
in this paper are as follows:
ExtensInterface: measures the extensibility of an
interface. It always has value 1.0 as an interface has
only abstract methods. It means that interfaces are
100% extensible by means of their abstract methods.
This metric is represented by the following formula
(1):
ExtensInterface(Itf) = nAbs/(nConc + nAbs) =
nAbs/(0 + nAbs) = nAbs/nAbs = 1.0
where:
• nAbs = # of abstract methods of an interface (Itf)
• nConc = # of concrete methods of an interface (Itf)
(1)
ExtensClass: measures the extensibility of a
class. This metric is represented by the following for-
mula:
ExtensClass(Cls) = nAbs/(nConc + nAbs)
where:
• nAbs = # of abstract methods of a class (Cls)
• nConc = # of concrete methods of a class (Cls)
(2)
ExtensVP: measures the extensibility of a varia-
tion point. It is the value of the metric ExtensClass
(Equation 2) for a class which is a variation point or
the value of the metric ExtensInterface (Equation 1)
for an interface which is a variation point, plus the
sum of the ExtensClass (Equation 2) value for each
associated variant class. This metric is represented by
the following formula:
ExtensVP(X) =
ExtensClass(X ) +
n
∑
i=1
ExtensClass(Ass
i
) if
X is a class
ExtensInter f ace(X) +
n
∑
i=1
ExtensClass(Ass
i
) if
X is an interface
where:
• n = # of (inclusive + exclusive + optional + mandatory) vari-
ant classes and interfaces associated (Ass)
(3)
ExtensVariability: measures the extensibility of
a variability. It is the sum of the metric ExtensVP
(Equation 3), for each variation point. This metric
is represented by the following formula:
ICEIS2014-16thInternationalConferenceonEnterpriseInformationSystems
112
6 Oliveira Junior, Gimenes and Maldonado
nVariants = ClassNumVariantsAltOR + ClassNumVariantsAltXOR + Class-
NumVariantsOptional + ClassNumVariantsMandatory (metrics from section 3).
CompVariability is the sum of the measure CompVP of each variation point
of a given variability, defined as:
CompV ariability =
nV P
X
i=1
CompV P
i
, where:
nVP = number of variation points of a given variability
CompPL is the sum of the measure CompVariability of each variability for
a given PL, defined as:
CompPL =
P LT otalV ariability
X
i=1
CompV ariability
i
To illustrate the collection of the metrics defined above, suppose that we have
a PL and it has a set of features, like the “Sorting of Elements”. This feature
may have a variability associated. This variability may have in turn two variation
points, which are: the kind of the sorting algorithm, and the kind of element to
be sorted. Figure 1 presents the class diagram for the variability “Sorting of
Elements”.
Fig. 1. Class Diagram for the Variability “Sorting of Elements”.
The variation points (SortingElement and SortingAlgorithm) are annotated
with the stereotype << variationP oint >>. The variants are annotated with
Figure 1: Excerpt of a Sorting Feature.
ExtensVariability(Vbt) =
nVP
∑
i=1
ExtensV P(Cls
i
)
where:
• nVP = # of class and interface (Cls) variation points
(4)
ExtensComponent: measures the extensibility of
a variable PLA component. It is the sum of the metric
ExtensVariability (Equation 4), for each variability in
a component. This metric is represented by the fol-
lowing formula:
ExtensComponent(Cpt) =
nVar
∑
i=1
ExtensVariability(Var
i
)
where:
• nVar = # of variabilities (Var) in a component (Cpt)
(5)
ExtensPLA: measures the extensibility of a PLA.
It is the sum of the ExtensComponent (Equation 5) for
each component of a PLA. This metric is represented
by the following formula:
ExtensPLA(PLA) =
nCpt
∑
i=1
ExtensComponent(C pt
i
)
where:
• nCpt = # of PLA variable components
• Cpt
i
is the i
th
component of a PLA
(6)
3 EXPERIMENTAL STUDY
In this section we describe the experiment carried out
to empirically validate the proposed metrics as indi-
cators of PLA extensibility (Basili et al., 2007).
3.1 Definition
The goal of the experiment is presented as follows:
Analyze collected metrics from UML models
For the purpose of validating
With respect to the capability to be used as PLA
extensibility indicators
From the point of view of software product line
architects
In the context of graduate students of the Soft-
ware Engineering area at the University of Waterloo
(UWaterloo), University of So Paulo (ICMC-USP),
and State University of Maring (UEM).
3.2 Planning
3.2.1 Context Selection
The experiment was carried out in an academic envi-
ronment.
EmpiricalValidationofProduct-lineArchitectureExtensibilityMetrics
113

3.2.2 Selection of Subjects
A group of Software Engineering graduate students
from ICMC-USP, UEM, and UWaterloo. They have
experience in the design of product lines and variabil-
ities using UML.
3.2.3 Variable Selection
The independent variables were:
• extensibility, which is a factor with two treat-
ments
– the extensibility metrics; and
– the extensibility subject’s rating.
• PLA, which is a pre-fixed variable with value “Ar-
cade Game Maker (AGM)”.
The dependent variable was the extensibility cor-
relation between the extensibility metrics and the
subject’s extensibility rating provided by each sub-
ject.
3.2.4 Instrumentation
The following objects compose the instrumentation:
• a document describing the Arcade Game Maker
(AGM) PL (SEI, 2010);
• the AGM UML class and component models;
• an AGM traceability model from classes to com-
ponents; and
• a resolution model containing the AGM variabili-
ties to be resolved at class level.
3.2.5 Hypotheses Formulation
The following hypotheses were defined to be tested in
this study:
• Null Hypothesis (H
0
): There is no significant
correlation between the PLA extensibility metric
(ExtensPLA) and the subject’s extensibility rating
(ExtensSubjectRate) for some PLA configuration:
H
0
: µ
(ExtensPLA)
6= µ
(ExtensSub jectRate)
• Alternative Hypothesis (H
1
): There is a signif-
icant correlation between the PLA extensibility
metric (ExtensPLA) and the subject’s extensi-
bility rating (ExtensSubjectRate) for some PLA
configuration:
H
1
: µ
(ExtensPLA)
= µ
(ExtensSub jectRate)
3.2.6 Experiment Design
This experiment design defined was: one factor with
two treatments by performing a correlation analysis
between such treatments (Wohlin et al., 2010).
3.3 Operation
3.3.1 Preparation
When the experiment was carried out, all of the sub-
jects had graduated in the Software Engineering area,
in which they have learned how to design at least
object-oriented (OO) class diagrams using UML. In
addition, all of the subjects had experience in apply-
ing PL and variability concepts to OO systems de-
signed using UML.
The material prepared to the subjects consisted of:
• the class diagram representing the core asset of
the AGM PL;
• the AGM component diagram, representing its
logical architecture;
• an AGM traceability model from classes to com-
ponents;
• the description of the AGM PL;
• the SMartyProfile (Oliveira Junior et al., 2010),
which is a UML metamodel, thus the subjects can
understand how the variabilities are represented in
class and component diagrams;
• a variability resolution model, which the sub-
jects could resolve the variabilities to generate one
AGM configuration; and
• a test (questionnaire) describing extensibility con-
cepts, which the subjects had to rate the associated
extensibility of each generated AGM configura-
tion based on linguistic labels (Table 1).
Table 1: Linguistic Labels for Subject’s Extensibility Rat-
ing.
Extremely
Low
Low
Neither Low
nor High
High
Extremely
High
We selected five linguistic labels, based on Bonis-
sone (Bonissone, 1980), as we considered they are
significant to cover the extensibility category of our
variables and bring out balance to obtain better re-
sults.
3.3.2 Execution
The subjects were given the material described in
Preparation (Section 3.3.1). It was required to each
ICEIS2014-16thInternationalConferenceonEnterpriseInformationSystems
114
subject to generate one AGM configuration. It was
done by following instructions on how to resolve the
AGM variability resolution model, and how to rate
the extensibility associated to the configurations gen-
erated from the subjects view point. All the tasks were
performed by each subject alone, with no time limit
to solve them and neither sequentially nor simultane-
ously.
As the metric ExtensPLA is a composition of the
remaining extensibility metrics of this paper, we only
take ExtensPLA into consideration for the validation
purpose. In addition, the ExtensPLA value of each
configuration was divided by the ExtensPLA value of
the overall AGM PLA, thus resulting in a value rang-
ing from 0.0 to 1.0.
3.3.3 Data Validation
The tasks performed by the subjects were collected.
We consider the subjects subjective evaluation re-
liable based on their characterization.
3.4 Analysis and Interpretation
We summarized the collected data by calculating the
metrics ExtensPLA for the thirty AGM configurations
generated by the subjects, as well as verifying the
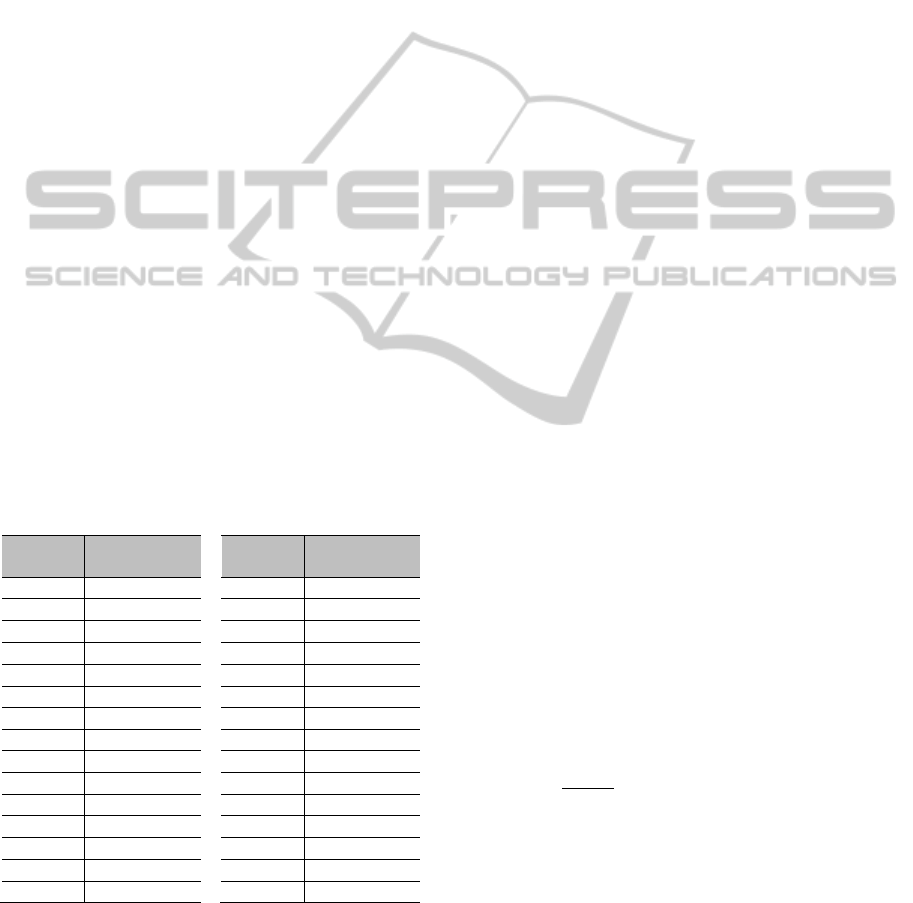
extensibility rating of such configurations. Table 2
presents the observed values for the ExtensPLA met-
ric from the generated AGM configurations.
Table 2: Observed Values for the ExtensPLA Metric from
the Generated Configurations.
Config.
#
ExtensPLA
Config.
#
ExtensPLA
1
0.81
16
1.00
2
0.61
17
0.80
3
1.00
18
0.61
4
0.80
19
0.61
5
0.80
20
0.61
6
0.61
21
0.80
7
0.80
22
0.80
8
0.61
23
0.61
9
1.00
24
0.80
10
1.00
25
1.00
11
0.81
26
0.61
12
1.00
27
0.61
13
0.61
28
0.61
14
0.61
29
0.80
15
1.00
30
0.61
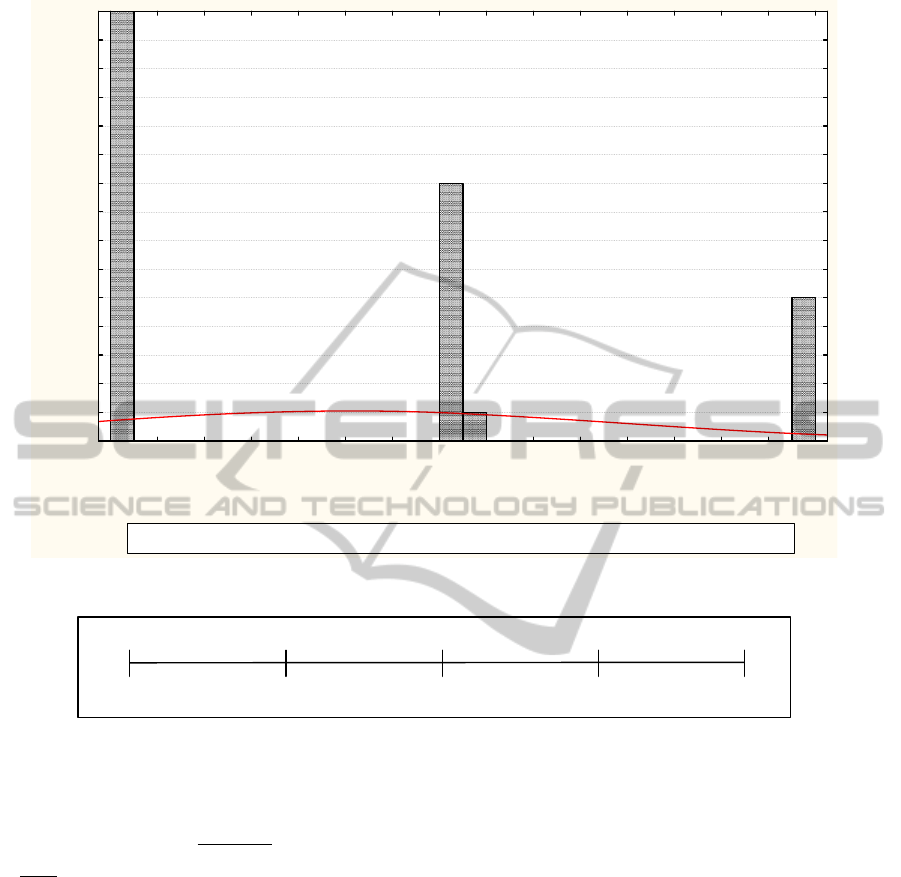
3.4.1 Descriptive Statistics
Figure 2 presents the ExtensPLA descriptive statistics
for the observed values of Table 2.
3.4.2 Normality Tests
We can clearly observe that the ExtensPLA values
distribution (Figure 2) is non-normal. In spite of
it, Shapiro-Wilk and Kolmogorov-Smirnov normality
tests were conducted to make sure of it.
The following hypotheses were proposed for both
normality tests with regard to the ExtensPLA metric:
• Null Hypothesis (H
0
): the ExtensPLA observed
values distribution is normal, i.e., the significance
value (p) is greater than 0.05 (p > 0.05); and
• Alternative Hypothesis (H
1
): the ExtensPLA
observed values distribution is non-normal, i.e.,
the significance value (p) is less or equal to 0.05
(p ≤ 0.05).
Taking into account a sample size (N) of 30, with
mean (µ) 0.7390, standard deviation (σ) 0.1487, and
median (
˜
x) 0.7060, the ExtensPLA metric obtained a
significance value:
• p = 0.009 (0.009 < 0.05) for the Kolmogorov-
Smirnov test;
• p = 0.000011 (0.000011 < 0.05) for the Shapiro-
Wilk test.
Thus, there is evidence, for both normality tests,
that the null hypothesis (H
0
) must be rejected at a sig-
nificance level of 5%. Then, we cannot consider the
ExtensPLA observed values distribution normal and,
consequently, a non-parametric statistic method must
be used to analyze the data.
3.4.3 Spearman’s Rank Correlation
As ExtensPLA distribution is non-normal, we ap-
plied the non-parametric Spearman’s Correlation (ρ)
(Spearman, 1904) to support the interpretation of the
data. This method allows establishing whether there
is a correlation between two sets of data, in our case,
for the ExtensPLA and the Subject’s Extensibility
Rating. Equation (7) presents the Spearman’s ρ for-
mula:
ρ = 1 −
6
n(n
2
−1)
n
∑
i=1
d
2
i
, where n is the sam-
ple size (N)
(7)
In this study, it was performed the following corre-
lation (Corr.1): ExtensPLA and the subjects exten-
sibility rating, which shows that the understanding
of extensibility by the subjects corroborates the Ex-
tensPLA metric, aiming at providing evidence of an
indicator for PLA extensibility.
Table 3 presents the Spearman’s ranking correla-
tion for Corr.1. The Spearman ρ coefficient (Equation
EmpiricalValidationofProduct-lineArchitectureExtensibilityMetrics
115
Frequency Distribution - ExtensPLA Metric (Extensibility)
0.61 0.65 0.69 0.73 0.76 0.80 0.84 0.88 0.92 0.96 1.00
ExtensPLA Observed Values
0
1
2
3
4
5
6
7
8
9
10
11
12
13
14
15
Number of Observations
N = 30, Mean = 0.7390, Standard Deviation = 0.1487, Median = 0.7060
Figure 2: Descriptive Statistics for the ExtensPLA Observed Values.
no correlation
strong negative
correlation
perfect negative
correlation
weak positive
correlation
strong positive
correlation
0-0.5- 1.0 0.5 1.0
weak negative
correlation
perfect positive
correlation
Figure 3: Spearman’s Rank Correlation Scale.
7) for Corr.1 is calculated as follows:
ρ(
Corr.1
) = 1 −
6
30(30
2
−30)
× 711.23 =
1 −
6
26970
× 711.23 = 1 − 0.1582 = 0.8413
Thus, according to Figure 3, there is a strong pos-
itive correlation (ρ(
Corr.1
) = 0.84) between the metric
ExtensPLA and the Subject’s Extensibility Rating.
Based on the proposed correlation, we have evi-
dence to reject the null hypothesis H
0
of the study,
and accept the alternative hypothesis H
1
(Section
3.2.5), which states that extensibility metrics are sig-
nificantly correlated to the subject’s extensibility rat-
ing.
3.5 Validity Evaluation
In this section we discuss the empirical study’s threats
to validity and how we tried to minimize them.
3.5.1 Threats to Conclusion Validity
The only issue that we take into account as a risk to
affect the statistical validity is the sample size (N=30),
which can be increased during prospective replica-
tions of this study in order to reach normality of the
observed values and generalize results.
3.5.2 Threats to Construct Validity
We proposed subjective metrics for measuring the
subject’s extensibility rating, as linguistic labels. As
the subjects have experience in modeling OO systems
using at least class diagrams, we take their ratings as
significant. The construct validity of the extensibility
metrics used as independent variables is guaranteed
by some insights carried out on a previous study of
metrics for PLA (Oliveira Junior et al., 2008).
ICEIS2014-16thInternationalConferenceonEnterpriseInformationSystems
116
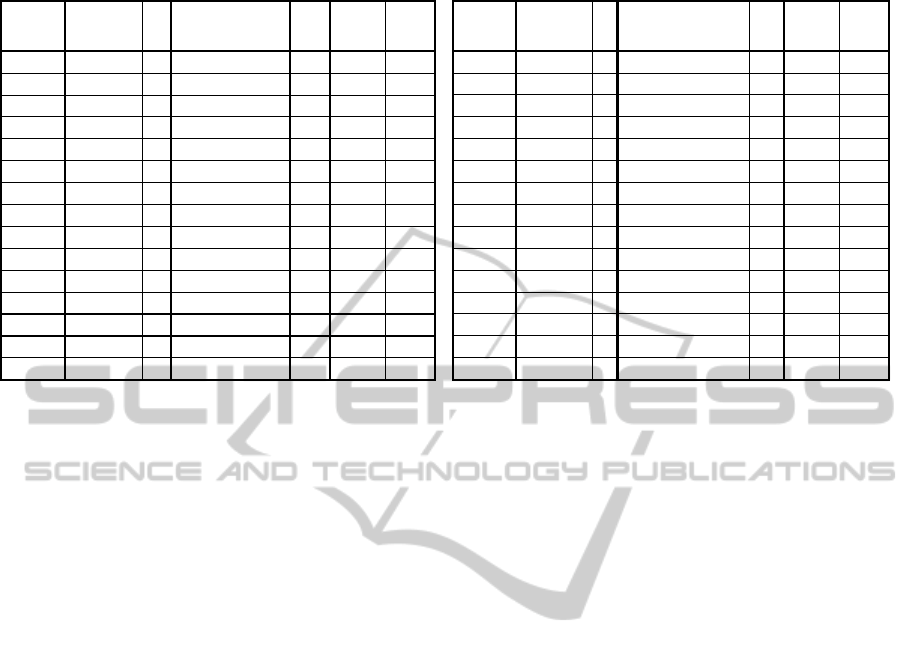
Table 3: Spearman’s Correlation for Corr.1: ExtensPLA and Subjects Extensibility Rates.
Config. # ExtensPLA
r
a
Subject's
Extensibility Rating
r
b
d
| r
a
- r
b
|
d
2
1 0.61 23 High 17.5 5.5 30.25
2 0.61 23 High 17.5 5.5 30.25
3 0.81 6 Extremely High 3.5 2.5 6.25
4 0.80 11 High 17.5 6.5 42.25
5 0.61 23 High 17.5 5.5 30.25
6 1.00 3 Extremely High 3.5 0.5 0.25
7 0.61 23 High 17.5 5.5 30.25
8 0.61 23 High 17.5 5.5 30.25
9 0.80 11 High 17.5 6.5 42.25
10 1.00 3 Extremely High 3.5 0.5 0.25
11 1.00 3 Extremely High 3.5 0.5 0.25
12 0.61 23 High 17.5 5.5 30.25
13 0.61 23 High 17.5 5.5 30.25
14 0.61 23 High 17.5 5.5 30.25
15 0.80 11 High 17.5 6.5 42.25
Config. # ExtensPLA
r
a
Subject's Extensibility
Rating
r
b
d
| r
a
- r
b
|
d
2
16 1.00 3 Extremely High 3.5 0.5 0.25
17 0.80 11 High 17.5 6.5 42.25
18 0.80 11 High 17.5 6.5 42.25
19 0.61 23 High 17.5 5.5 30.25
20 0.80 11 High 17.5 6.5 42.25
21 0.61 23 High 17.5 5.5 30.25
22 1.00 3 Extremely High 3.5 0.5 0.25
23 0.61 23 High 17.5 5.5 30.25
24 0.61 23 High 17.5 5.5 30.25
25 0.80 11 High 17.5 6.5 42.25
26 0.61 23 High 17.5 5.5 30.25
27 0.61 23 High 17.5 5.5 30.25
28 0.80 11 High 17.5 6.5 42.25
29 0.61 23 High 17.5 5.5 30.25
30 0.80 11 High 17.5 6.5 42.25
3.5.3 Threats to Internal Validity
We dealt with the following issues:
• Differences Among Subjects. As we dealt with
a small sample, variations in the subject skills
were reduced by applying the within-subject task
design. Thus, subjects experiences had approxi-
mately the same degree with regard to UML mod-
eling, and PL and variabilities basic concepts.
• Accuracy of Subject Responses. Extensibility
was rated by each subject. As they have medium
experience in UML modeling, and PL and vari-
abilities concepts, we considered their responses
valid.
• Fatigue Effects. On average the experiment
lasted for 58 minutes, thus fatigue was considered
not very relevant. Also, the variability resolution
model contributed to reduce such effects.
• Measuring PLA and Configurations. As PLA
can be analyzed based on its products (configura-
tions), measuring derived configurations provide a
means to analyze PLA quality attributes by allow-
ing the performing of trade-off analysis to prior-
itize such attributes. Thus, we consider valid the
application of the metrics to PLA configurations
to rate the overall PLA extensibility.
• Other Important Factors. Influence among sub-
jects could not really be controlled. Subjects took
the experiment under supervision of a human ob-
server. We believe that this issue did not affect the
study validity.
3.5.4 Threats to External Validity
Based on the greater the external validity, the more
the results of an empirical study can be generalized
to actual software engineering practice, two threats to
validity have been identified, which are:
• Instrumentation. We tried to use representa-
tive class and component diagrams of real cases.
However, the PL used in the experiment is non-
commercial, and some assumptions can be made
on this issue. Thus, more empirical studies taking
a “real PL” from software organizations must be
done.
• Subjects. Obtaining well-qualified subjects was
difficult, thus we used advanced students from
the Software Engineering academia. More exper-
iments with industry practitioners and profession-
als must be carried out allowing us to generalize
the study results.
4 DISCUSSION OF RESULTS
Obtained results of the study provided evidence that
the metric ExtensPLA is a relevant indicator of PLA
extensibility based on its correlation to the subject’s
rating.
Several more experiments must be carried out, as
well as more PLA configurations must be both de-
rived and incorporated to enhance the conclusions.
In addition, we need to apply our metrics to a com-
mercial PL in order to reduce external threats to the
study validity and for gathering real evidence that
these metrics can be used as extensibility indicators.
EmpiricalValidationofProduct-lineArchitectureExtensibilityMetrics
117

Existing literature presents no work directly re-
lated to this paper. Although some theoretical valida-
tions are presented in the literature for PLA metrics,
as far as we know, no empirical validation has been
performed similarly to the carried out study.
5 CONCLUSION
Current literature claims the need of metrics to allow
PL architects empirically analyze the potential of a
PLA, as well as PL managers analyze the aggregated
managerial and economical values of a PL throughout
its products.
Performing empirical validation of metrics is
essential to demonstrate their practical usefulness.
The proposed metrics for the extensibility (Exten-
sPLA) PLA quality attribute were empirically vali-
dated based on their application to a set of 30 products
generated by experiment subjects from the Arcade
Game Maker (AGM) PL. The observed metric val-
ues were submitted to normality tests which proved
their non-normality. Then, Spearman’s rank correla-
tion was used to demonstrate the metrics correlations,
which is: ExtensPLA has a strong positive correlation
with the subject’s extensibility rating.
Although we have used a non-commercial PL to
conduct our experiments, we had evidence that our
proposed metrics can be used as relevant indicators of
extensibility of a PLA based on its derived products.
We are currently proposing changes on various is-
sues to improve our experiments with metrics, which
are: (i) increase the derived configurations sample
size, which is important to stay closer to real projects
and to generalize the results; (ii) conduct experiments
in a more controlled environment; (iii) deal with real
data from commercial PL obtained from industry; and
(iv) recruit more subjects from the Software Engineer-
ing area, both from academic and industrial environ-
ments.
REFERENCES
Basili, V. R., Rombach, D., Schneider, K., Kitchenham,
B., Pfahl, D., and Selby, R. W. (2007). Empirical
Software Engineering Issues: Critical Assessment and
Future Directions. Springer, New York, NY, USA.
Bckle, G., Clements, P., McGregor, J. D., Muthig, D., and
Schmid, K. (2004). Calculating ROI for Software
Product Lines. IEEE Software, 21(3):23–31.
Bertoa, M. F., Vallecillo, A., and Garca, F. (2006). An
Ontology for Software Measurement, chapter 6, pages
175–196. Springer.
Bonissone, P. P. (1980). A Fuzzy Sets Based Linguistic
Approach: Theory and Applications. In Proceedings
of Conference on Winter Simulation, pages 99–111,
Piscataway, NJ, USA. IEEE Press.
Briand, L., Emam, K. E., Morasca, S., El, K., and Morasca,
E. S. (1995). Theoretical and Empirical Validation of
Software Product Measures. ISERN-95-03, Interna-
tional Software Engineering Research Network.
Capilla, R., Bosch, J., and Kang, K.-C. (2013). Systems and
Software Variability Management - Concepts, Tools
and Experiences. Springer, New York, NY, USA.
Garc
´
ıa, F., Ruiz, F., Calero, C., Bertoa, M. f., Vallecillo,
A., Mora, B., and Piattini, M. (2009). Effective use
of ontologies in software measurement. Knowl. Eng.
Rev., 24(1):23–40.
Linden, F. J. v. d., Schmid, K., and Rommes, E. (2007).
Software Product Lines in Action: The Best Indus-
trial Practice in Product Line Engineering. Springer-
Verlag New York, Inc., Secaucus, NJ, USA.
Oliveira Junior, E. A., Gimenes, I. M. S., and Maldon-
ado, J. C. (2008). A Metric Suite to Support Soft-
ware Product Line Architecture Evaluation. In Pro-
ceedings of the Conferencia Latinoamericana de In-
formtica, pages 489–498, Santa F, Argentina.
Oliveira Junior, E. A., Gimenes, I. M. S., and Maldonado,
J. C. (2010). Systematic Management of Variability in
UML-based Software Poduct Lines. Journal of Uni-
versal Computer Science (J.UCS), 16(17):2374–2393.
Oliveira Junior, E. A., Gimenes, I. M. S., Maldonado,
J. C., Masiero, P. C., and Barroca, L. (2013). Sys-
tematic Evaluation of Software Poduct Line Archi-
tectures. Journal of Universal Computer Science
(J.UCS), 19(1):25–52.
Pohl, K., B
¨
ockle, G., and Linden, F. J. v. d. (2005). Software
Product Line Engineering: Foundations, Principles,
and Techniques. Springer-Verlag, Secaucus, NJ, USA.
Sane, A. and Birchenough, A. (1999). First Class Exten-
sibility for UML - Packaging of Profiles, Stereotypes,
Patterns. In Proceedings of the International Confer-
ence on the Unified Modeling Language, pages 265–
277. Springer-Verlag.
SEI (2010). Arcade Game Maker Pedagogical Product
Line.
Smith, J. M. (2012). Elemental Design Patterns. Addison-
Wesley Professional, New York, NY, USA.
Spearman, C. (1904). The Proof and Measurement of As-
sociation Between Two Things. American Journal of
Psychology, 15(1):72–101.
Wohlin, C., Runeson, P., Hust, M., Ohlsson, M. C., Reg-
nell, B., and Wesslun, A. (2010). Experimentation in
Software Engineering: an Introduction. Kluwer Aca-
demic Publishers, Norwell, MA, USA.
Woolf, B. (1997). The Abstract Class Pattern. In Proceed-
ings of the Pattern Languages of Programming Con-
ference, pages 1–8. ACM.
ICEIS2014-16thInternationalConferenceonEnterpriseInformationSystems
118
