
Context-Specific Sentiment Lexicon Expansion via Minimal User
Interaction
Raheleh Makki, Stephen Brooks and Evangelos E. Milios
Faculty of Computer Science, Dalhousie University, 6050 University Avenue, Halifax, Canada
Keywords:
Context-Dependent Sentiment Lexicon, Visualization, User Interaction.
Abstract:
One of the important factors in the performance of sentiment analysis methods is having a comprehensive
sentiment lexicon. However, since sentiment words have different polarities not only in different domains,
but also in different contexts within the same domain, constructing such context-specific sentiment lexicons
is not an easy task. The high costs of manually constructing such lexicons motivate researchers to create
automatic methods for finding sentiment words and assigning their polarities. However, existing methods may
encounter ambiguous cases with contradictory evidence which are hard to automatically resolve. To address
this problem, we aim to engage the user in the process of polarity assignment and improve the quality of
the generated lexicon via minimal user effort. A novel visualization is employed to present the results of
the automatic algorithm, i.e., the extracted sentiment pairs along with their polarities. User interactions are
provided to facilitate the supervision process. The results of our user study demonstrate (1) involving the
user in the polarity assignment process improves the quality of the generated lexicon significantly, and (2)
participants in the study preferred our visual interface and conveyed that it is easier to use compared to a
text-based interface.
1 INTRODUCTION
With the growth of Web opinion data, the need for
analysing people’s attitudes toward different topics
has increased markedly. In most existing automatic
sentiment analysis methods, utilizing a comprehen-
sive sentiment lexicon is very crucial, otherwise the
intended sentiment will be misinterpreted. However,
we know that the sentiment value of the words is sen-
sitive not only to the topic domain but also to the
context. For instance, in the domain of cell phones,
“high” is negative within that domain for the “price”
aspect while being positive for the “quality” aspect.
Therefore, we can say that even in the same domain,
the same word may have different polarities for dif-
ferent aspects. That is to say, the polarity of a sen-
timent word is often context-dependent (Ding et al.,
2008). Consequently, entries in context-specific sen-
timent lexicons are pairs of sentiment words and as-
pects. Sentiment words are words indicating senti-
ment polarities (positive, negative, neutral) and as-
pects are words modified by the sentiment words. For
example, one entry can be “(huge, price)”. In this pa-
per, we refer to these pairs as sentiment pairs.
It is well known that available general-purpose
sentiment lexicons cannot be optimal for domain de-
pendent sentiment analysis applications. These lex-
icons cannot cover sentiment words for all differ-
ent domains (Lu et al., 2011). Since manually
constructing these lexicons is a hard, tedious and
time-consuming task, researchers have focused on
automatic methods of creating domain and context-
dependent sentiment lexicons and have been able to
improve the performance of the opinion mining ap-
plications. However, these methods may encounter
sentiment pairs that are difficult to predict their polar-
ities. There is no automatic method with 100 percent
accuracy and they can be further improved.
In this paper, we aim to improve the quality of the
generated lexicon by involving the user in the process
of the polarity assignment. For this purpose, results of
the automatic algorithm can be shown to the user and
she can make changes whenever she observes an in-
correct assignment. To minimize user effort and make
the polarity assignment task easier, we propose a vi-
sual interface. We combined existing visualization
modules, such as Tree Clouds and Tag Clouds into
an interface for context-specific sentiment lexicon cu-
ration. Briefly, our main contributions are:
• Improving the quality of context-specific senti-
178
Makki R., Brooks S. and Milios E..
Context-Specific Sentiment Lexicon Expansion via Minimal User Interaction.
DOI: 10.5220/0004745301780186
In Proceedings of the 5th International Conference on Information Visualization Theory and Applications (IVAPP-2014), pages 178-186
ISBN: 978-989-758-005-5
Copyright
c
2014 SCITEPRESS (Science and Technology Publications, Lda.)

ment lexicons by engaging the user in the polarity
assignment process and determining the extent to
which this is possible.
• Introducing a novel visualization for construct-
ing context-dependentsentiment lexicons with the
following capabilities: 1) presenting the extracted
sentiment pairs and their polarities predicted by
the automatic algorithm 2) providing interactions
that enable the user to assign new polarities to
sentiment pairs 3) making user involvement easier
by categorizing aspects and presenting sentiment
pairs in a structured way.
To evaluate to what extent involving the user in
the process of polarity assignment improves the qual-
ity of the lexicon and whether the visual interface is
helpful, we ran a user study. An overview of the pro-
posed approach is illustrated in Fig. 1. These steps
will be explained throughout this paper. The rest of
the paper is organized as follows. Section 2 provides
a survey of related work. The automatic method for
generating sentiment lexicons and our proposed vi-
sual interface are described in sections 3 and 4 re-
spectively. The user study and the experiments on its
results are described in sections 5 and 6. Finally,
section 7 contains the conclusion and future work.
2 RELATED WORK
Since we use visualization for constructing sentiment
lexicons, we review the literature in two sections:
first, related work to sentiment lexicon extraction and
then research related to visualizing sentiment values.
2.1 Generating Sentiment Lexicons
Most of the existing methods for constructing do-
main adapted sentiment lexicons use seed words with
known polarity to calculate the sentiment value of the
unknown words. A set of methods use a dependency
grammar to exploit the relationships between senti-
ment words and aspects. These methods propagate
sentiment values through both sentiment words and
the features (Qiu et al., 2009; Qiu et al., 2011). An-
other approach is to use existing general-purpose sen-
timent lexicons along with a method that can adapt the
lexicon to the new domain (Choi and Cardie, 2009).
There is recent work that applies a cross-domain clas-
sifier to construct domain-dependent sentiment and
aspect lexicons with no training data (Li et al., 2012).
In addition to corpus-based methods that use co-
occurrence statistics, there are some methods that
make use of knowledge sources like WordNet to ex-
pand the sentiment lexicon for different domains.
These methods use distance to the seed words, syn-
onyms, antonyms and the gloss information to calcu-
late the polarity of adjectives (Rao and Ravichandran,
2009; Esuli and Sebastiani, 2006). Finally, there are
some approaches that combine more than one of the
existing methods. It can be a combination of linguis-
tic heuristics and rules (Ding et al., 2008), or a uni-
fied framework that combines different information
sources (Lu et al., 2011).
This paper differs from previous work in several
ways. First, we involve the user in the polarity as-
signment process. To the best of our knowledge, there
is no prior formal work that engages the user to im-
prove the results of the automatic algorithm. There
is only one recent work involving the user in the ex-
traction of the aspects in a corpus of reviews (Husaini
et al., 2012), but no user study or evaluation has been
reported. Furthermore, we employ visualization for
the user supervision. Researchers have used visual-
ization in different sentiment analysis applications so
far. However, most of them used visualization for pre-
senting the results rather than providing an interface
with interactions that can enable users to provide in-
put.
2.2 Visualizing Sentiment Words
This section reviews literature that uses visualiza-
tion for presenting sentiment values. Various visual
metaphors are employed to visualize the sentiment
content of documents such as Rose plot (Gregory
et al., 2006). In this visualization, each affect is paired
with its opposite in order to allow direct comparisons;
each pair has a unique color and the intensity is used
to encode the positivity and negativity of the affects
within a pair.
There are a number of studies that visualize and
track sentiment changes over time. For example,
there is a novel visualization called time density plots
which is based on the occurrence frequency of fea-
tures and enables users to detect interesting time pat-
terns (Rohrdantz et al., 2012).
Using colors for encoding sentiment polarities is
very common. Annett and Kondrak use SVM to clas-
sify movie blogs based on their sentiment polarities.
They present their classifier results by using colors to
encode the sentiment polarity (Annett and Kondrak,
2008). Green, red, and yellow are used to show posi-
tive, negative, and neutral movies respectively. Simi-
larly, we employ colors to encode the sentiment polar-
ity. In addition, tree clouds and tag clouds are used to
present extracted information about sentiment pairs.
Section 4 explains the visualization components
and the provided user interactions. However, the first
Context-SpecificSentimentLexiconExpansionviaMinimalUserInteraction
179
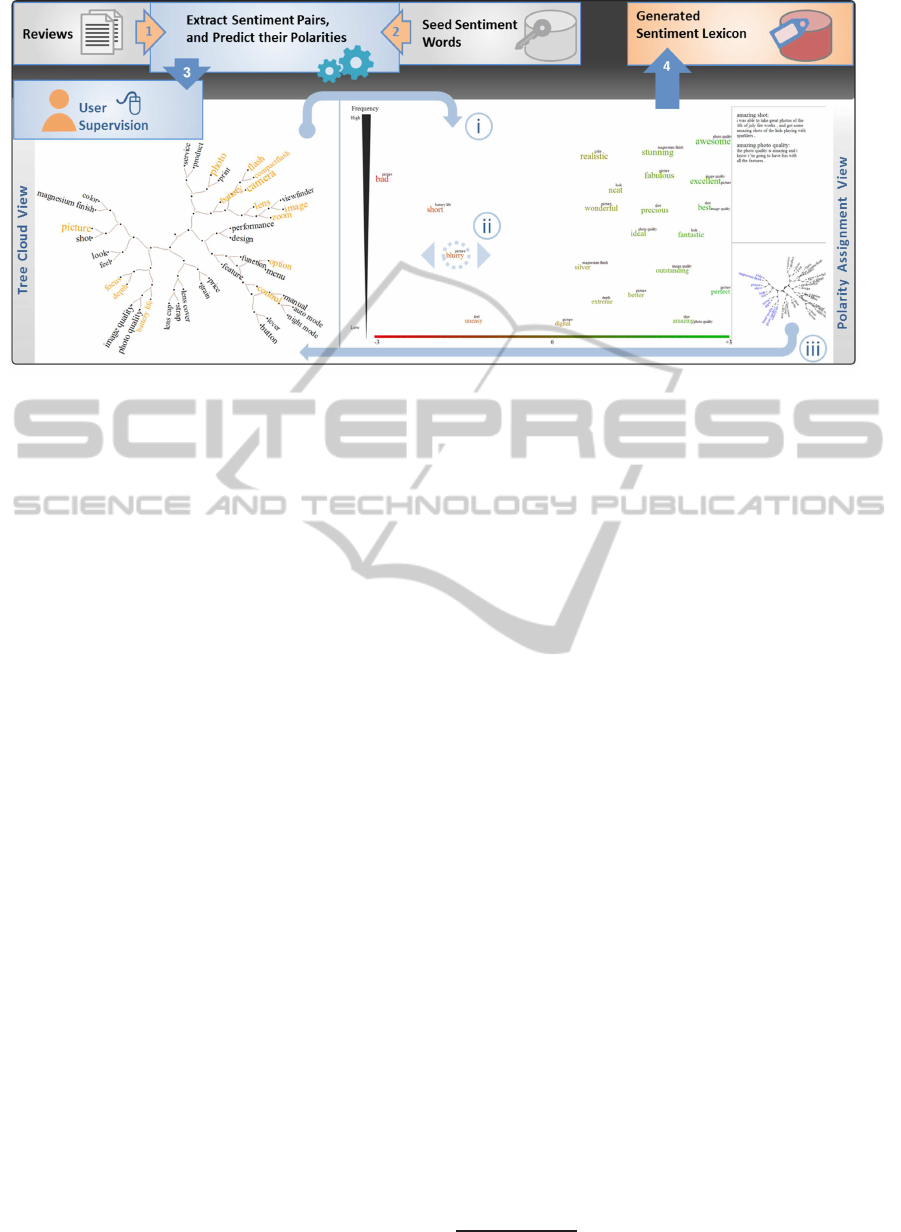
Figure 1: An overview of the proposed approach with the visual interface, labels i and iii show navigation between two views,
and ii show a sentiment pair in the polarity assignment view.
step is to employ an automatic method to extract the
sentiment pairs and predict their polarities prior to any
intervention by the user. In this paper, we followed
similar steps in the double propagation method pro-
posed by Qui et al. (Qiu et al., 2009). We chose this
method since it does not use any additional knowl-
edge sources except a list of seed sentiment words
and also is not dependent on meta data, nor the over-
all ratings of reviews. In addition, it is one of the
state-of-the-art methods. However, we made some
slight modifications as double propagation results in
domain-specific lexicons and we aim at constructing
context-specific sentiment lexicons. In the context-
dependent sentiment lexicons, the polarity is assigned
to the sentiment pairs, while in the domain dependent
lexicons, sentiment words have the same polarity for
all the aspect within a domain. The automatic algo-
rithm used here is explained in the next section. The
proposed approach is independent of the automatic
method used for generating the context-specific senti-
ment lexicon.
3 AUTOMATIC LEXICON
CREATION
Since sentiment words and their targets are linked
by several syntactic relations, a dependency parser
can explore these relations. Consequently, having
an initial list of seed sentiment words with known
polarities, one can attempt to discover existing
sentiment pairs in an iterative process. In each
iteration, new sentiment pairs are found and their
sentiment words and aspects are added to the known
lists. These newly updated lists are used to extract
more sentiment pairs in the same way. In this
paper, we considered nouns and noun phrases to be
aspects, while sentiment words are terms modifying
these aspects, not limited to adjectives. To extract
sentiment pairs from reviews in our dataset, we
utilize the Stanford parser
1
(Marneffe et al., 2006)
and we follow a set of rules which consists of
relations between sentiment words and aspects such
as “amod: adjectival modifier”, “acomp: adjectival
complement” and “nsubj: nominal subject”.
After a new sentiment pair is discovered, we
predict its polarity based on the evidence observed in
the context which can be any other sentiment word
that modifies the same aspect in the same review.
It is reasonable to assume that a reviewer does not
change her opinion about a specific aspect within
a review. Therefore, other sentiment words that
modify the same aspect in the review are considered
as evidence. After identifying evidence, we calculate
the polarity of the newly discovered sentiment pair
based on Eq. 1. In this relation, p
i, j
indicates the
polarity of sentiment pair (s
i
, a
j
) where s
i
is the
sentiment word and a
j
is the aspect. n is the number
of found evidence and f
k, j
is the frequency of k
th
evidence. Respectively, p
k, j
indicates the polarity
of that evidence. It is worth mentioning that in this
relation, besides the polarity of evidence, we also
take into account the frequency of their occurrence in
the corpus. The reason is if a sentiment word does
not appear frequently in the context of an aspect, then
its weight in calculating the polarity of other pairs
with the same aspect should be low.
1
nlp.stanford.edu/software/lex-parser.shtml
IVAPP2014-InternationalConferenceonInformationVisualizationTheoryandApplications
180

p
i, j
=
n
∑
k=1
f
k, j
· p
k, j
n
∑
k=1
f
k, j
(1)
Selecting the pairs for user adjustment. We se-
lect three types of sentiment pairs for presentation to
the user and potential adjustment of sentiment polar-
ity. First, If there is no evidence in the context of
the new sentiment pair, we consider the polarity of
its sentiment word in a general-purpose lexicon as
its predicted polarity and consider it as an ambigu-
ous case to be shown to the user through the visual
interface. In this paper, we used the lexicon
2
intro-
duced in (Hu and Liu, 2004) as the general-purpose
lexicon. Second, if the existing evidence is contradic-
tory (e.g. 3 positive and 2 negative out of 5 evidence),
the probability of wrong polarity assignment by the
automatic algorithm is high. Therefore, we consider
them as ambiguous cases to be included in our visu-
alization as well. Third, we present the most frequent
sentiment pairs (top 10%) in the visual interface since
they are the most important pairs in the lexicon. After
the pairs are selected, we use the visual interface to
present them to the user.
4 VISUALIZATION
The proposed visual interface consists of two views:
tree cloud view and polarity assignment view. The
tree cloud view is a navigation interface for the polar-
ity assignment view and aims at minimizing user ef-
fort, while the polarity assignment view presents the
sentiment pairs and their polarity and enables the user
to assign new polarities. Sections 4.1 and 4.2 ex-
plain the tree cloud and the polarity assignment view
respectively. In this paper, all the visualizations are
implemented in JavaScript using the d3 library
3,4
.
4.1 Tree Cloud View
This view presents the set of existing aspects in the
domain. For instance, if our dataset contains reviews
about printer, “price, quality, ppm, customer service,
shipping, cartridge” are some of the aspects in this do-
main. These aspects are presented in a tree structure
which is constructed based on the semantic related-
ness between its nodes and is called Tree Cloud. In
2
cs.uic.edu/ liub/FBS/sentiment-analysis.html
3
d3js.org/
4
The proposed visual interface can be accessed at:
cs.dal.ca/∼niri/app/SA
other words, aspects that are semantically related will
appear close to each other (neighbors in the tree). For
example, in the domain of printer, aspects “price” and
“cost” will appear as neighbors in the tree as well as
“support” and “warranty” (as illustrated in Fig. 2).
Tree clouds were first introduced in (Gambette
and Veronis, 2010). Gambette and Veronis used co-
occurrence frequency of the terms to calculate their
relatedness. Since reviews are usually short, instead
of co-occurrence frequency, we employ Google Tri-
grams to calculate the semantic relatedness between
each two terms (Islam et al., 2012). Therefore, we
have a matrix that shows the relatedness score for ex-
isting pair of terms. Then, to build the tree we fol-
low the neighbor-joining (Saitou and Nei, 1987) al-
gorithm. In each iteration, two terms with the high-
est score are joined together and considered as a new
single node. The relatedness scores for this newly
formed node and other terms are updated. Conse-
quently, in each iteration, the dimension of the sim-
ilarity matrix reduces by one. These steps are con-
tinued until all the terms are added to the tree. The
reasons of using tree cloud for presenting aspects is
explained in section 4.3.
The user interactions in this view include select-
Figure 2: Tree cloud built from a printer review dataset,
yellow terms show aspects with at least one sentiment word
with unknown polarity. Branches that are already seen by
the user are dimmed grey.
ing a group of aspects and the subsequent navigation
to the polarity assignment view. For this purpose, the
user can click on a node and all the aspects that are its
children will be added to the list of selected aspects.
Then, in the polarity assignment view, all the senti-
ment pairs associated with this set of aspects will be
presented. This is illustrated in Fig. 3 when sentiment
pairs related to the selected aspects, “cost, price, print
quality, quality”, are shown. In addition, when the
user hovers the mouse over a node, a number appears.
This value shows the number of the sentiment pairs
that are going to be shown if the user clicks on this
Context-SpecificSentimentLexiconExpansionviaMinimalUserInteraction
181

node. It can help the user in selecting branches with
appropriate size.
4.2 Polarity Assignment View
This view presents sentiment pairs and their predicted
polarity by the automatic algorithm. For this pur-
pose, we use color, size, and position of text elements
to present extracted information about the sentiment
pairs. Sentiment words are shown as main terms and
their aspects are presented as a word cloud around
them. The position along the x-axis shows the polar-
ity value of the sentiment pairs. In addition, color is
also used to encode polarity value. A color spectrum
from red to green at the bottom of the view presents
the range from the most negative to the most positive
value that is possible for polarity. The position along
the y-axis is based on the sentiment word frequency.
Frequent terms appear at the top of the view, while
sentiment pairs with lower frequency are shown at the
bottom. Moreover, since the size of elements is easy
for users to interpret, the font-size of the text elements
also shows the frequency.
A miniaturized rendering of the tree cloud view is
shown at the bottom right of this view. This acts as a
mini-map within this drill down view. All the nodes
are shown in black except the selected branch which
is in blue. This lets the user know which branch of the
tree she is currently observing. In addition, whenever
the user is satisfied with the polarities, she can click
on the minimized tree and go back to the tree cloud
view where the current branch is dimmed grey to in-
dicate that it has already been viewed.
To help the user in making decisions about the po-
larity of the sentiment pairs, their contexts are also
displayed in the context view at the top of the min-
imized tree (Fig. 3). Whenever the user hovers the
mouse over a sentiment term, a sample sentence ran-
domly selected from its contexts will be shown. This
assists the user in making decisions about the polarity
of the selected sentiment words.
We stated that the main point of the polarity as-
signment view is to enable users to change the polar-
ity of the sentiment pairs. To do this, the user should
move the sentiment words horizontally by dragging
and dropping them to the desired position. The color
of the selected term will accordingly change based on
its horizontal position. In addition, other presenta-
tions of the same sentiment word, if any, will be high-
lighted during the movement.
In addition, a sentiment word may be presented
with multiple aspects. That is, multiple sentiment
pairs are merged into one node. For instance, in
Fig. 3, “low” is shown with “cost”, “price” and “qual-
ity” as its aspects. The sentiment word “low” is posi-
tive in this figure. This means that all sentiment pairs
“(low, cost)”, “(low, price)” and “(low, quality)” also
have positive polarities. Since “low” has a positive
sentiment for “cost” and “price” but a negative mean-
ing for “quality”, the user may want to correct the po-
larity of the pair “(low, quality)”. She can click on
the text element presenting “quality” and duplicate
the current node. The red circle in Fig. 3 displays
duplicated terms along with their associated aspects
after the user clicks on “quality”.
4.3 Minimizing User Effort
In this section, we discuss the motivation for this way
of visualizing sentiment pairs. First of all, we be-
lieve that presenting aspects based on their semantic
relatedness makes the task easier. Since the terms ap-
pearing as neighbours are semantically close, it is ex-
pected that their common sentiment words may have
similar polarities. To illustrate, assume that aspects
“price” and “cost” are neighbours in the tree. If a sen-
timent word like “low” has a positive value for one of
these aspects, the likelihood that it has the same polar-
ity for the other one is high. In this case, we can merge
these two pairs and present them as a single node, as
illustrated in Fig. 3. This saves space and also mini-
mizes the user effort if a polarity change is required.
Besides, without the structured tree cloud view, all the
sentiment pairs would be shown together in one view
which would be cluttered and hard to read.
Furthermore, every automatic method that gener-
ates context-dependent sentiment lexicons may en-
counter difficult cases in the polarity assignment
stage. As explained in 3, these cases are the pairs with
contradictory evidence or no evidence in their context
and we believe they are more error-prone and there is
a higher chance that the user need to make corrections
for these sentiment pairs. Therefore, the user input on
these sentiment value can improve the quality of the
generated lexicon to a greater extent. Aspects that ap-
pear in these sentiment pairs will be shown in yellow
in the tree cloud, otherwise they will be presented in
black. Therefore, the user knows which aspects con-
tain more ambiguous sentiment pairs and she can pay
more attention to them when performing the polar-
ity assignment task. In addition, when the user does
not want to view all the shown sentiment pairs, she
can consider only these ambiguous pairs and still im-
prove the quality of the lexicon to a notable extent.
Finally, we select the most frequent and ambiguous
sentiment pairs and show them to users for supervi-
sion instead of showing all the extracted sentiment
pairs. This saves the amount of time users need to
IVAPP2014-InternationalConferenceonInformationVisualizationTheoryandApplications
182
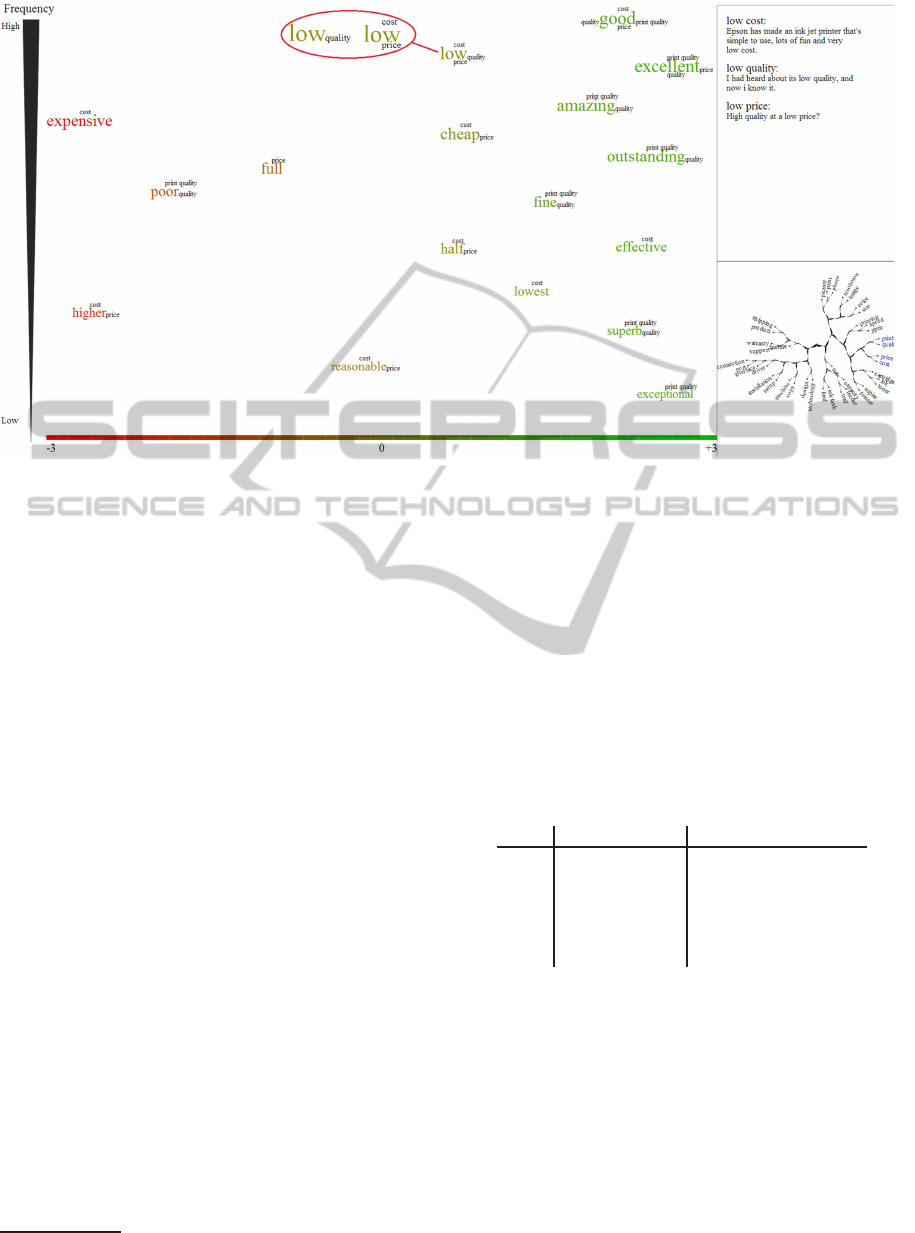
Figure 3: Polarity assignment, sentiment words and aspects are presented as main terms and word clouds respectively. The
color presents the polarity and the size indicates the frequency of the sentiment words. Sample contexts are shown at the top
right and the minimized tree is at the bottom right of the screen.
spent to complete the task.
5 USER STUDY
To evaluate the generated lexicon and provided inter-
faces, we ran a user study. The dataset we used in
this study contains reviews about three different prod-
ucts form Amazon website. This dataset is available
online
5
and have been provided and used by Hu and
Liu (Hu and Liu, 2004). The reviews come with labels
at the aspect-level, i.e. aspects are labelled with their
polarity value. The maximum and minimum value of
these labels are +3 and -3 respectively.
In order to determine whether the proposed visual-
ization is helpful in the polarity assignment task, we
also implemented a text-based interface. We compare
these two interfaces in the user study. In the text-
based interface, the sentiment pairs are shown to the
user in a list. Each row contains one sentiment pair, a
slider, and a sample sentence related to the sentiment
pair. The value of the slider shows the predicted po-
larity by the automatic algorithm and it is in the range
(-3,+3). The user can change the polarity of the senti-
ment value by moving the slider.
Regarding the study design, thirty students in
computer science participated in this study. Each par-
ticipant was given two separate tasks to perform with
5
cs.uic.edu/∼liub/FBS/sentiment-analysis.html#datasets
both the text-based and visual interfaces. In each task,
participants are asked to adjust the polarity values pre-
dicted by the automatic algorithm.
Table 1 shows how we conduct the study. The
participants’ identification number, the datasets and
the interfaces used in the first and second task are
shown. Different datasets are used in the first and
second tasks to avoid the effect of becoming famil-
iar with the data and sentiment pairs on the results.
Table 1: User study tasks and datasets.
UIDs
T1 Intf. T2 Intf. T1 Dataset T2 Dataset
1-5 Text Visual Cell Phone Camera
6-10
Visual Text Camera Cell Phone
11-15
Text Visual Mp3 Player Cell Phone
16-20
Visual Text Cell Phone Mp3 Player
21-25
Text Visual Camera Mp3 Player
26-30
Visual Text Mp3 Player Camera
6 EXPERIMENTAL RESULTS
In order to evaluate the user supervision effect on
the quality of the generated lexicons, we calculated
the accuracy of the lexicons before and after user su-
pervision against the gold standard. To the best of
our knowledge, there is no gold standard for context-
specific lexicons; consequently, we constructed it for
each domain in our dataset using the available score
labels of aspects. We extracted the sentiment words
which describe these labelled aspects using the same
Context-SpecificSentimentLexiconExpansionviaMinimalUserInteraction
183

set of rules given in Sec 3. Having aspects, their senti-
ment words and their aspects, we can easily construct
the gold standard. The datasets used in this paper are
relatively small; each domain contains a few hundred
reviews. The reason for choosing this dataset is hav-
ing score labels at the aspect level. So, we can build
the gold standard and evaluate our approach.
The results of the user study are shown in Table 2.
The average and standard deviation of the accuracy of
the generated lexicon for each domain indicates that
user supervision improves the quality of the gener-
ated lexicon. However, in order to see whether this
difference is significant or not, we ran a t-test on the
results of the user study for each domain. Since we
are testing the effect of user supervision regardless of
the type of the interface, we have 20 results about the
quality of the generated lexicon after user supervision.
The p-values show that the user supervision has a sig-
nificant affect in the quality of the generated lexicon.
In addition, the results show that in average, the
visual interface slightly outperformsthe text-based in-
terface. Similarly, to show whether this difference is
significant or not, we ran an independent-samples t-
test. Although in this study each participant worked
with both interfaces, the domains used for each task
were different. Therefore, for each domain, the stu-
dents that worked with the visual interface are differ-
ent form the students that participated in the text inter-
face. The p-value of this test for each dataset shows
that this difference is not significant. Since the user
supervision is the same in both interfaces, this result
is not surprising. Besides, the aim of the visual inter-
face is to provide an easy to use interface for the user
supervision. Finally, the last row in this table shows
the number of pairs that were shown to the partici-
pants.
Moreover, we recorded the amount of time that
each participant spent to complete the tasks. The av-
erage and standard deviation of this value for each
dataset and interface are shown in Table 3. In aver-
age, participants could finish their tasks faster using
the visual interface. However, this difference was not
statistically significant when we ran the t-test. It is
worth mentioning that in this study, no instruction re-
garding time were given and we did not ask partici-
pants to complete their tasks as quick as possible.
At the end of the study, participants were asked
to answer a questionnaire. Some of the questions and
the frequency of their answers are shown in Table 4.
Answers are in the scale from 1 to 5, where 5 is the
best. Questions in columns 1 and 2 are about how
easy are the interfaces to use. The frequencies of
the scores show that in average, participants assigned
higher scores to the visual interface. we also ran the
non-parametric Wilcoxon signed-rank test and the re-
sults show that there is a significant difference be-
tween the participants’ scores for the visual and text-
based interface. Similarly, for the questions 3 and 4,
we infer that the visual interface is significantly more
helpful in the polarity assignment task. In addition,
we asked this question “ Overall, which user inter-
face do you prefer to work with?” 25 participants an-
swered visual interface, while 5 stated that they prefer
text-based interface. Therefore, although the visual
interface is not significantly faster then the text-based
interface, because of its qualifications, most partici-
pants prefer to interact with it and its components are
more useful in making the polarity assignment task
easier.
We also asked participants to give us their com-
ments on the provided interfaces. Participants give
responses such as “For the visual system I like the
tree a lot, felt well organized.” (participant ID = 12),
“The text based system was harder to follow, scrolling
made it hard and easy to lose your place” (participant
ID = 27), and “The text-based interface, it is relatively
easy to use and I think it will bring more accurate in-
formation” (participant ID = 5).
Table 2: Average, Standard Deviation, and P-Value of the
Sentiment Lexicon Accuracy Before and After User Super-
vision Using Text-based and Visual Interfaces.
Camera Cell Phone Mp3 Player
Ac-U
a
60.27 55.80 68.52
Ac+UT
b
91.04(±4.61) 84.24(±5.50) 88.91(±3.49)
Ac+UV
c
94.21(±2.21) 85.33(±4.20) 91.10(±3.08)
p-val1
d
< 0.0001 < 0.0001 < 0.0001
p-val2
e
0.079 0.642 0.175
No. of pairs
138 114 141
a
Accuracy without user supervision
b
Accuracy after user supervision, text-based interface
c
Accuracy after user supervision, visual interface
d
P-value, accuracy before and after supervision, df=38
e
P-value, accuracy using text and visual interface,
df=18
Table 3: The Average and Standard Deviation of the
Amount of Time Spent by the Participants for Each Dataset
(in seconds).
Interface
Camera Cell Phone Mp3 Player
Text-based 635.8(±237.15) 745.5(±262.19) 745.2(±290.26)
Visual
629(±172.76) 737(±315.19) 707.5(±173.83)
IVAPP2014-InternationalConferenceonInformationVisualizationTheoryandApplications
184

Table 4: Questionnaire and Frequency of the Participants’
Answers with the P-Value of the Wilcoxon Signed Rank
Test.
Score
Q1
a
Q2
b
Q3
c
Q4
d
Q5
e
Q6
f
5 10 19 6 17 11 13
4
13 10 16 12 15 15
3
4 1 3 0 3 1
2
2 0 5 1 1 1
1
1 0 0 0 0 0
P
g
0.012 0.001 N/A N/A
a
How easy is the text-based interface to use
b
How easy is the visual interface to use
c
How helpful is the text-based interface in assigning senti-
ment values
d
How helpful is the visual interface in assigning sentiment
values
e
How useful is the tree cloud in making the task easier
f
How appealing are the visual components
g
P-value of the Wilcoxon signed rank test
7 CONCLUSIONS
Our main contribution in this paper is a novel visual-
ization framework for involving the user in the pro-
cess of generating sentiment lexicon. The visualiza-
tion shows sentiment pairs and allows the user to as-
sign polarity to them. To evaluate the generated lexi-
con, we ran a user study with 30 people. The results
show the extent to which the engagement of the user
in the polarity assignment improves the quality of the
lexicon and this improvement is statistically signifi-
cant. In addition, based on the users’ answers to the
questionnaire at the end of the study, we can say that
the visual interface was preferred by the participants
and it was useful for the polarity assignment task. We
note that polarity assignment for large lexicons is a
very tedious task and we speculate that offering an
improved interface that user’s prefer would like re-
duce fatigue and user disinterest.
As a future work, we would like to add user in-
teractions that enable users to accept or reject the
extracted aspects or even add new aspects that are
missed. In addition, since we needed a gold standard
to evaluate the generated lexicon, we chose a fairly
small dataset. Another way to evaluate the generated
lexicon is to use it in an application such as sentiment
classification and see how much it improves the re-
sults of the classifier. However, this type of evaluation
may add errors of the classifier to the results. Using
larger datasets and evaluating the generated lexicon in
this way is also considered as future work.
ACKNOWLEDGEMENTS
This research was funded by the Boeing Company
and the Natural Sciences and Engineering Research
Council of Canada. We thank Dr. Aminul Islam
for making available his software from (Islam et al.,
2012).
REFERENCES
Annett, M. and Kondrak, G. (2008). A Comparison of Sen-
timent Analysis Techniques: Polarizing Movie Blogs.
In Proceedings of the CSCSI, pages 25–35.
Choi, Y. and Cardie, C. (2009). Adapting a Polarity Lex-
icon Using Integer Linear Programming for Domain-
Specific Sentiment Classification. In Proceedings of
the 2009 Conf. on EMNLP: Volume 2, pages 590–598.
Ding, X., Liu, B., and Yu, P. S. (2008). A Holistic Lexicon-
Based Approach to Opinion Mining. In Proceedings
of the 2008 WSDM, pages 231–240. ACM.
Esuli, A. and Sebastiani, F. (2006). Sentiwordnet: A Pub-
licly Available Lexical Resource for Opinion Mining.
In In Proceedings of LREC, pages 417–422.
Gambette, P. and Veronis, J. (2010). Visualizing a Text with
a Tree Cloud. Studies in Classification, Data Analysis,
and Knowledge Organization, Part 3, pages 561–569.
Gregory, M. L., Chinchor, N., Whitney, P., Carter, R., Het-
zler, E., and Turner, A. (2006). User-Directed Senti-
ment Analysis: Visualizing the Affective Content of
Documents. In Proceedings of the Workshop on Sen-
timent and Subjectivity in Text, pages 23–30. ACL.
Hu, M. and Liu, B. (2004). Mining and Summarizing Cus-
tomer Reviews. In Proceedings of the Tenth ACM
SIGKDD Int. Conf. on KDD, pages 168–177.
Husaini, M., Koc¸yi˘git, A., Tapucu, D., Yanikoglu, B., and
Saygin, Y. (2012). An Aspect-Lexicon Creation and
Evaluation Tool for Sentiment Analysis Researchers.
In Proceedings of the 2012 ECML, pages 804–807.
Islam, A., Milios, E., and Keˇselj, V. (2012). Text Similarity
Using Google Tri-Grams. In Proceedings of Cana-
dian AI’12, pages 312–317.
Li, F., Pan, S. J., Jin, O., Yang, Q., and Zhu, X. (2012).
Cross-Domain Co-Extraction of Sentiment and Topic
Lexicons. In Proceedings of the ACL, pages 410–419.
Lu, Y., Castellanos, M., Dayal, U., and Zhai, C. (2011). Au-
tomatic Construction of a Context-Aware Sentiment
Lexicon: An Optimization Approach. In Proceedings
of the 20th Int.l Conf. on WWW, pages 347–356.
Marneffe, M. D., Maccartney, B., and Manning, C. D.
(2006). Generating Typed Dependency Parses from
Phrase Structure Parses. In LREC, pages 449–454.
Qiu, G., Liu, B., Bu, J., and Chen, C. (2009). Expanding
Domain Sentiment Lexicon Through Double Propa-
gation. In Proceedings of IJCAI, pages 1199–1204.
Qiu, G., Liu, B., Bu, J., and Chen, C. (2011). Opinion
Word Expansion and Target Extraction Through Dou-
ble Propagation. Comput. Linguist., 37(1):9–27.
Context-SpecificSentimentLexiconExpansionviaMinimalUserInteraction
185

Rao, D. and Ravichandran, D. (2009). Semi-Supervised Po-
larity Lexicon Induction. In Proceedings of the 12th
Conference of the EACL, pages 675–682. ACL.
Rohrdantz, C., Hao, M. C., Dayal, U., Haug, L.-E., and
Keim, D. A. (2012). Feature-Based Visual Sentiment
Analysis of Text Document Streams. ACM Trans. In-
tell. Syst. Technol., 3(2):26:1–26:25.
Saitou, N. and Nei, M. (1987). The Neighbor-Joining
Method: a New Method for Reconstructing Phyloge-
netic Trees. Molecular Biology and Evolution, 4:406–
425.
IVAPP2014-InternationalConferenceonInformationVisualizationTheoryandApplications
186
