
Visualization and Clustering of Online Book Reviews
Shiaofen Fang
1
, Lanfang Miao
2
and Eric Lin
1
1
Department of Computer & Information Science, Indiana University Purdue University Indianapolis,723 W Michigan St.,
SL 280, Indianapolis, IN 46202, U.S.A.
2
College of Mathematics, Physics and Information Engineering, Zhejinag Normal University, Yingbin Dadao 688#,
Jinhua, Zhejiang, 321004, China
Keywords: Visual Clustering, Online Reviews, Text Mining, Social Network.
Abstract: Online user reviews of products, movies, books, etc. have been an important source of information for
applications such as social networking, online retail, and sentiment analysis. In this paper, we present a
novel visualization tool for analysing and visualizing online book reviews. Using text mining techniques,
nontrivial features (tags) are identified on the text data extracted from the online reviews. These keyword
tags are used to cluster both the books and the readers based on global tag similarities. Two different
visualization methods are proposed: parallel coordinate views and 3D correlative cluster views. The parallel
coordinate visualization provides a flat view of the tag distributions to reveal clustering patterns. A novel
3D corrective visualization technique is developed to visually represent the correlations of reader clusters
and book clusters. These visualization techniques can also be applied to other types of online text data in
social networks and web commerce.
1 INTRODUCTION
The amount of information from online content has
increased exponentially in recent years. While there
has been extensive research on web content mining
and knowledge discovery, traditional text mining
and data mining techniques are becoming
increasingly difficult when applied to online content
because of the scale and heterogeneity of the
information available. One effective way of mining
and understanding big data information is to
combine visualization and data mining techniques to
enhance the knowledge discovery process through
human interactions.
User reviews of products, movies, books, etc. is
an especially interesting type of online data. Online
user reviews often include sentimental information
that cannot be easily obtained from other sources.
The analysis (e.g. clustering) of online reviews can
therefore generate added values pertaining to non-
trivial and sentimental information. In this paper, we
will focus on the analysis and visualization of online
book reviews. Using traditional and visual clustering
techniques, we can generate novel groups of books
that share certain sentimental values. This can be
very valuable for book suggestion and marketing.
We may also generate clusters of readers (who wrote
the reviews) based on their reading interests and
their opinions on various topics, which can be useful
in social networking of book lovers. Furthermore, it
would be interesting to see if there are correlations
between reader clusters and book clusters.
Conventional book clustering divides books into
trivial categories such as thriller, mystery and
science fiction. It is also fairly simple to determine if
a book is a historical autobiography, or American
literature from the Great Depression. However, such
trivial classifications are sometimes not sufficient
when sentimental and subtle classifications are
needed for, for instance, book suggestions, sentiment
analysis and social networking. In these cases,
nontrivial attributes, which are often sentimental
characteristics, will play a prominent role in
determining a book’s identity. An author’s tone, the
style of narrative, or the social commentaries
embedded in a book’s story are all examples of
nontrivial attributes. Moreover, these nontrivial
attributes can be combined with each other, or trivial
attributes to define extremely nuanced subsets of
books, with sentimental characteristics.
Goodreads is a social network for readers. On
Goodreads, users are able to maintain a catalog of
books they have read, including their overall opinion
187
Fang S., Miao L. and Lin E..
Visualization and Clustering of Online Book Reviews.
DOI: 10.5220/0004745501870194
In Proceedings of the 5th International Conference on Information Visualization Theory and Applications (IVAPP-2014), pages 187-194
ISBN: 978-989-758-005-5
Copyright
c
2014 SCITEPRESS (Science and Technology Publications, Lda.)

of the book, expressed in a 5-star rating, and more
detailed thoughts about the book, in the form of
written reviews. To date, Goodreads has over eleven
million registered users, who added over 320 million
book ratings to the Goodreads database. This
database of users and their review data provided us
with a substantial dataset of book reviews.
Representing books and readers in terms of their
coordinates on a set of keywords attributes (tags)
provides us a way to visualize and mine books and
readers as higher dimensional data, and thus make
interesting connections.
In the following, we will first discuss, in Section
2, other results closely related to our work. In
section 3, we will describe our text data processing
method, including the feature/tag extraction process.
An automatic clustering algorithm will be discussed
in Section 4. We will present several visualization
algorithms for this type of online review data in
Section 5, and conclude the paper in Section 6 with
additional remarks and future work.
2 RELATED WORK
The approach of representing text documents using
keywords has been widely applied in text mining
and analysis (Feldman, 1995; Feldman, 1998). Most
basic automated text mining techniques are
variations of the term frequency-inverse document
frequency method (TF-IDF) (Salton, 1988; Salton,
1989). Most studies of mining a large amount of text
focus on finding interesting relational patterns from
frequently occurring entities in the data. The
distinction between of ‘interesting’ and
‘uninteresting’ patterns has been studied in (Sahar,
1999; Silberschatz, 1996).
In the domain of mining the text of human (user)
written reviews, the idea of sentiment analysis
become increasingly important. Some studies have
used visualization techniques to assist with the
identification and evaluation of keywords, patterns
and emotive categories (Oelke, 2008; You, 2010;
Pang, 2008). An adaptive solution is proposed in
(Blitzer, 2007), and a keyword-based approach is
proposed in (Wanner, 2011), similar to the method
used in this study. In (Wanner, 2011), books are
identified as pertaining to a predetermined set of
topics, using human opinion to evaluate their topic
detection algorithm. Although a correlation was
found between topic significance, some cases were
noted where the results of topic detection were
misleading.
Many visualization techniques have been
developed for high-dimensional data. Direct high-
dimensional visualization includes star plots
(Chambers, 1983), parallel coordinate (Inselberg,
1990), and scatterplot (Becker, 1987). For large and
very high-dimensional datasets, dimension reduction
is often necessary. Common dimensions reduction
methods include PCA (Jollie, 1986), LDA
(Fukunaga, 1990), MDS (Cox, 2000), and Self-
Organizing Maps (Kohonen, 2001). Landscape or
terrain views have also been used to visualize high-
dimensional through through intuitive metaphors
(Johansson, 2009; You, 2010), which shows
structural overviews the datasets by generating
representations that people are familiar with.
The visualization of clustered high-dimensional
data has also been studied in (Choo, 2009) and in
ClusterSculptor (Nam, 2007). NodeTrix (Henry,
2007) combines a matrix representation for graphs
with traditional graph visualization methods. A
hierarchical multidimensional cluster analysis
technique was described in Seo et al. (Seo, 2002).
An interactive scatter plot matrix is developed in
(Elmqvist, 2008) to leverage animated transitions to
smoothly switch between different user selected
dimensions. Using visualization to explore and
analyse clusters of high-dimensional data is
particularly important when clusters from multiple
data sources or different data types are correlated,
which has not been well studied in current
literatures.
3 DATA PROCESSING
In a sample dataset, review data for 100 books were
pulled from the Goodreads database, consisting of
user reviews written about each of those books. This
data also included user ratings. Preliminary data
preprocessing was performed before mining and
visualization. Non-English words, and words not
contained in a standard dictionary were removed,
including misspelled words. Additionally, user
identifiers such as a user’s real name and email
address were removed. It should be noted that
Goodreads is an international community of readers,
and reviews written by international Goodreads
users were removed in this step.
Each book’s reviews were mined for frequently
occurring words, producing a set of vectors
corresponding to the frequency of each word. This
process was performed independently for each book,
resulting in a different set of vectors for each word.
Frequently occurring words were referred to as
candidate tags. The total incidence of a candidate tag
IVAPP2014-InternationalConferenceonInformationVisualizationTheoryandApplications
188

word in a book’s aggregated reviews is usually a
good indicator of the general relevance of that
candidate tag to the book. However, this approach
greatly exaggerates the importance of highly
occurring (but otherwise meaningless) candidate
tags, such as “the”, “an”, or “book”.
To account for the skewed nature of purely
incidental tag counts, as well as the varying amounts
reviews for each book, it was necessary to perform
some sort of normalization. For each word in a
book’s reviews, its weight was determined using the
following TF-IDF metric, named for the two terms
multiplied together to determine the weight of a
term.
log
As an example, suppose that a book has 100
reviews, with 40 counts of the word “evil”,
appearing in a total of 20 reviews. The weight of the
“evil” candidate tag, calculated using TF-IDF would
be calculated in the following manner:
40
100
log
100
20
0.6438
Using this method, after mining the weights of
candidate tags for each individual book, we
calculated the mean weight of each candidate tag
across the entire data set. These were considered to
be the ‘global’ weights for each candidate tag. We
eventually selected our feature tags out of this pool
of candidate tags.
Before selecting candidate tags as feature tags,
the candidate tags with the highest global weight
values were subjected to human evaluation. This
was necessary to remove tag words that were
lacking in description, too low in overall frequency,
or otherwise unsuitable. Words such as ‘book’,
‘read’, ‘story’, ‘really’, ‘reading’, ‘think’, and ‘love’
were removed due to their ambiguity: they do little
to distinguish features one book may have, that
another does not. Series’, on the other hand, was a
fairly meaningful candidate tag, describing whether
or not the book being reviewed was part of a series.
While useful, this was a trivial classifier, and the sort
of identifier we were trying to avoid. The ‘science’
and ‘fantasy’ tags, while comparably general, were
selected because they describe content. Had the data
set been restricted further to include only books
from either the science fiction or fantasy genre, they
would have been eliminated as candidate tags as
well.
We selected thirty tags out of the remaining
candidate tags, to be used for the duration of the
study, which we referred to as feature tags. We
decided on this number of feature tags because we
felt it was the lowest amount of tags that would be
able to adequately cover the breadth of book features
we felt were present in the books of our data set. As
part of the selection process, we combined duplicate
tags that overlapped to some degree (the words
“politics”, and “political”, for instance).
The use of feature tags provided a context with
which to quantify the content of books, since each
book could be described by the collection of its
weight counts for each of the feature tags. For each
book b, the weight of tag word w in b was indicative
of the presence of w in reviews of b.
The collection of these values was referred to as
a book’s coordinates, as these values could be used
to describe a book’s position in a 30-dimensional
space. Since each book occupied a coordinate in this
book space, we used these coordinates as the basis
of determining book similarity, by calculating the
cosine similarity between two books. This similarity
value was then used to cluster books by the weights
of their feature tags. This process would later be
used to determine the similarity between users, as
well.
4 CLUSTERING
In our study, a hierarchical clustering technique was
applied. Clusters were built up in successive rounds,
by combining the two clusters with the greatest
amount of similarity in each round. The clustering
process was considered to be finished when the two
most similar clusters had a similarity below a certain
threshold. The coordinates of the cluster centers
were used to determine the distance between two
clusters, and calculating the cosine similarity
between the two calculated cluster centers.
Over the course of the clustering process,
meaningful, clusters may get lost - a result of being
merged into larger clusters. There was a happy
medium between too much clustering, and not
enough. Many single book clusters persisted until
late in the process, while other, more archetypical
books were clustered together, forming massive
super clusters along obvious sub-genre lines.
The results were promising. Two books: Flowers
for Algernon, and The Time Traveler’s Wife.
Though both books have slight tendencies towards
science fiction, they are not widely considered to be
science fiction novels (Flowers for Algernon is
usually classified as classic literature, while The
Time Traveler’s Wife is usually described as
contemporary literature, or even romance, before
VisualizationandClusteringofOnlineBookReviews
189
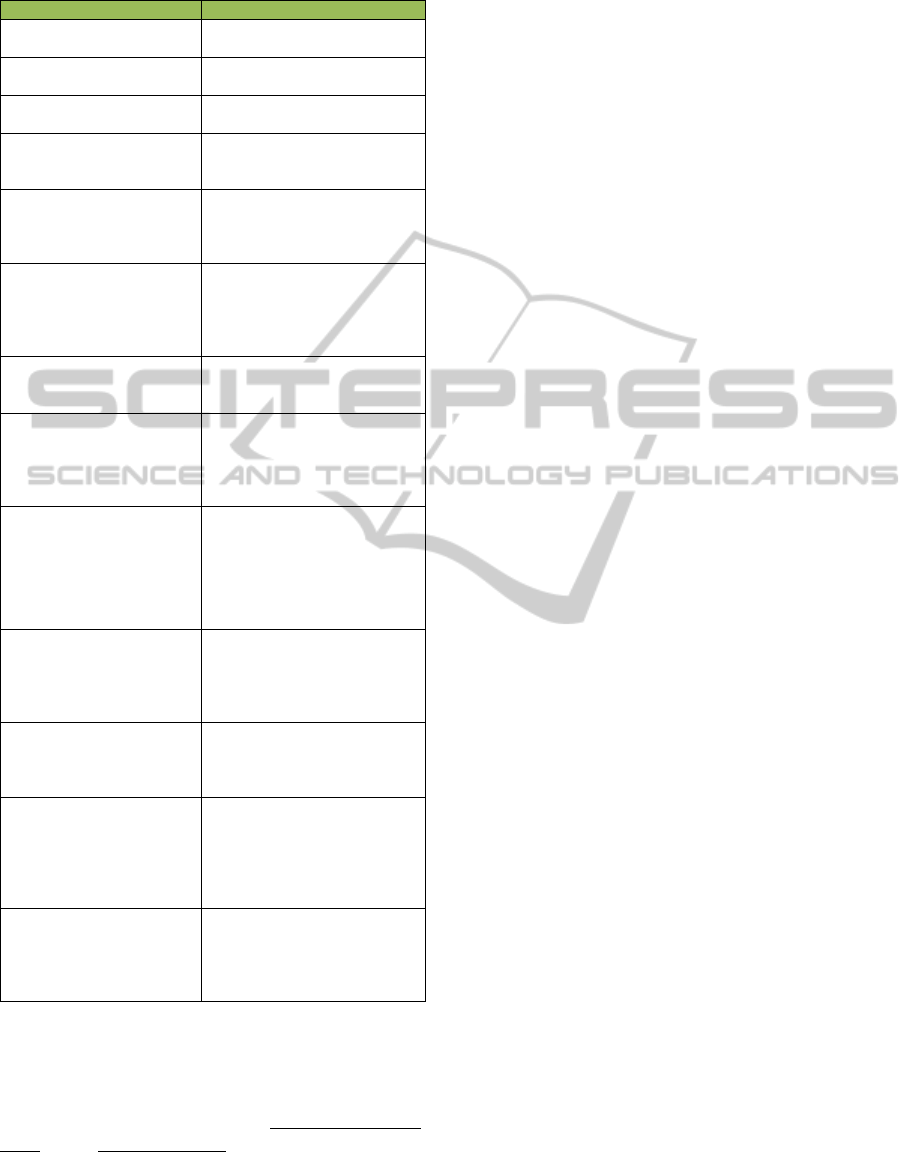
Table 1: Hierarchical Clustering Results.
Books Tags
The Time Traveler's Wife,
Flowers for Algernon
adult, sad, simple, sex
Watership Down, The
Princess Bride
adult, adventure, classic,
entertaining, exciting, humor
The Dark Tower, The Road battle, compelling, dark, epic,
reality, sad, simple
Journey to the Center of the
Earth, 20,000 Leagues
Under the Sea
adventure, classic, deep,
entertaining, exciting, modern,
science, technology
Outlander, Kushiel’s Dart adult, adventure, compelling,
complex, entertaining, epic,
exciting, fantasy, hero, sex,
religion, intriguing, , political
The Complete Chronicles
of Conan, Watchmen
adventure, battle, compelling,
complex, dark, deep,
entertaining, evil, fantasy,
hero, modern, reality, simple,
political
Small Gods, The Book of
the New Sun
epic, fantasy, humor, reality,
religion, simple, small,
technology, sex
Doomsday Book,
Cryptonomicon, Snow
Crash, The Diamond Age
adventure, compelling,
complex, entertaining, sex,
exciting, humor, intriguing,
modern, reality, religion,
science, social, technology
The Mists of Avalon,
American Gods, The Last
Unicorn, The Once and
Future King, The Way of
Kings, Gardens of the
Moon, Dragonflight, ……
adult, adventure, battle,
compelling, complex, dark,
epic, evil, exciting, fantasy,
hero, humor, intriguing, magic,
sad, small
Homeland, Something
Wicked This Way Comes,
Wicked, A Clockwork
Orange, Animal Farm, The
Stand
adult, battle, dark, deep, evil,
simple, social, political
I Am Legend, 1984, The
Handmaid's Tale, Brave
New World, World War Z,
Frankenstein, ……
classic, modern, reality,
religion, sad, science, social,
political, sex
Do Androids Dream of
Electric Sheep?, Contact, A
Canticle for Leibowitz,
Cat's Cradle, , Ender's
Game, Heir to the Empire,
……
alien, battle, classic,
compelling, complex, deep,
entertaining, exciting,
intriguing, reality, religion,
science, small, social, space,
technology, political
Slaughterhouse Five, or the
Children's Crusade,
Hitchhiker's Guide to the
Galaxy, Going Postal, The
Eyre Affair
classic, entertaining, humor,
reality
science fiction). Given the unique classifications of
these two books, we felt it was appropriate that they
remained as a 2-book cluster until one of the last
stages of clustering, where they were eventually
combined with other books like Brave New World,
1984, and Fahrenheit 451: books with relatively
similar faint elements of the science fiction and
fantasy genres.
After observing our clustering results at several
threshold levels, we decided to use clustering results
with a threshold value t=0.75. At this level of
clustering, there were 13 total book clusters, which
are shown in Table 1. Despite the presence of seven
two-book clusters, we believed the similarity
threshold had kept most of these books separate
from the larger clusters for a reason, as in the first
cluster, where both books deviate substantially from
the fairly standard formula of the science fiction
genre.
Previously, in our data collection process, we
collected every review that had been written about
the books on the NPR 100 list. All reviews in our
data set were grouped by user author, which allowed
us to mine each user in the same way we mined
books, looking for weights of the same feature tags
used for book clustering. There are 162 qualified (20
or more reviews on the NPR 100 list) users. Mining
user reviews with the same set of features was a
natural extension of our work in clustering books.
We believed that by mining the text of a user’s
reviews and looking for those same features, we
could make reasonable predictions about the type of
book a particular user tends to read. By performing
the same feature identification for a user, and
looking for a correlation between books they have
read, and books that the computer thinks are related
to books they rated highly, we would be able to
evaluate the performance of our clustering methods.
5 VISUALIZATION METHODS
The visualization of the book review data serves two
purposes: (1) we want to visualize the distributions
of the books and readers over the set of tags to see if
they exhibit natural clustering behaviour; and (2) we
want to see how the books and readers interact and
correlate through their tags coordinates and clusters.
Two visualization techniques are developed: parallel
coordinate views and correlative cluster views.
5.1 Parallel Coordinate Views
Parallel coordinate approach aligns all variables
(dimensions) along the X-axis, and plots the
coordinates of each data element in the Y-direction
as piecewise line segments. The variables in this
case are the 30 keyword tags. Each book or reader
can now be plotted as one piecewise line segments
curve, as shown in Figure 1. Colors can also be used
to depict different clusters coming from the
automatic clustering algorithm. One problem with
parallel coordinate is that when there are a large
IVAPP2014-InternationalConferenceonInformationVisualizationTheoryandApplications
190
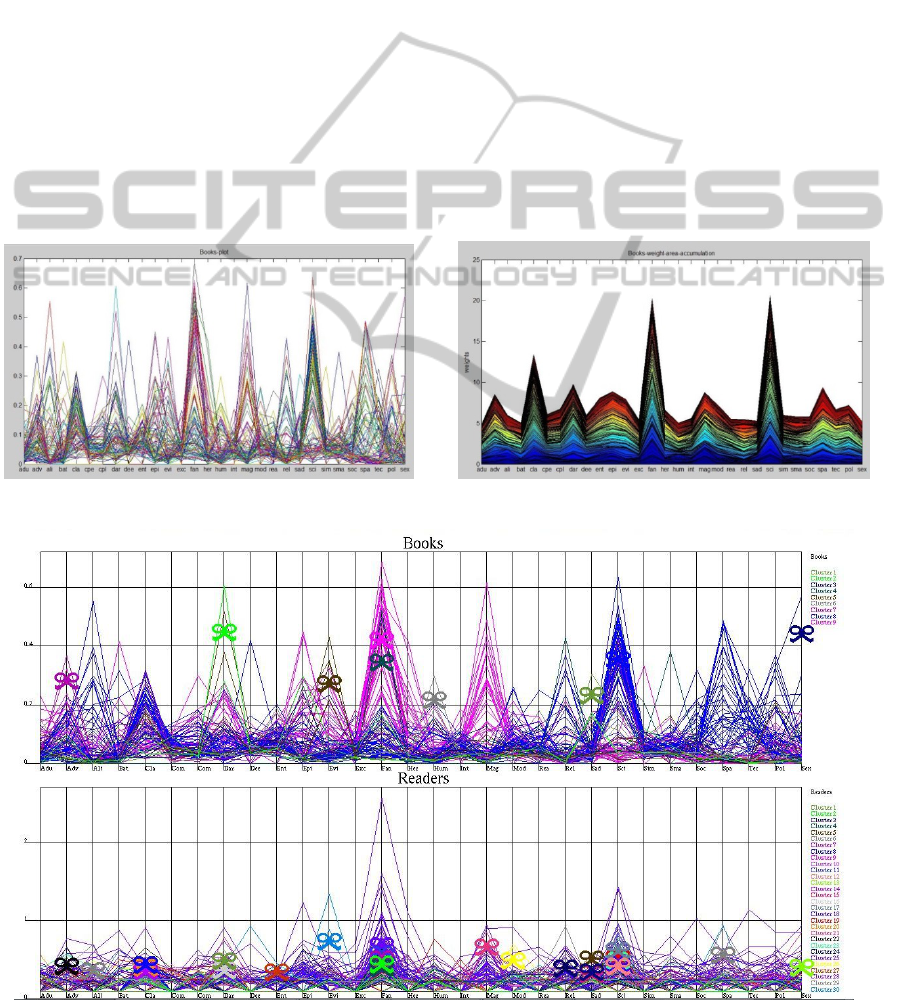
number of curves, the crossing of these curves
makes it hard to separate different objects. One
possible solution is to accumulate the coordinates in
the Y-direction by drawing them on top of each
other, as shown in Figure 2.
Parallel coordinates depicts the tag distributions
of all data elements in one figure. This allows the
users to identify groups of data elements that
demonstrate concentrations of a small number of tag
coordinates. Therefore, it is a natural visual
clustering tool, and at the same time, can also be
used to verify results from automatic clustering
algorithms. Figure 3 shows the clusters represented
in different colors, along with the prominent and
representative tags for each cluster, illustrated using
a knot over the line segments.
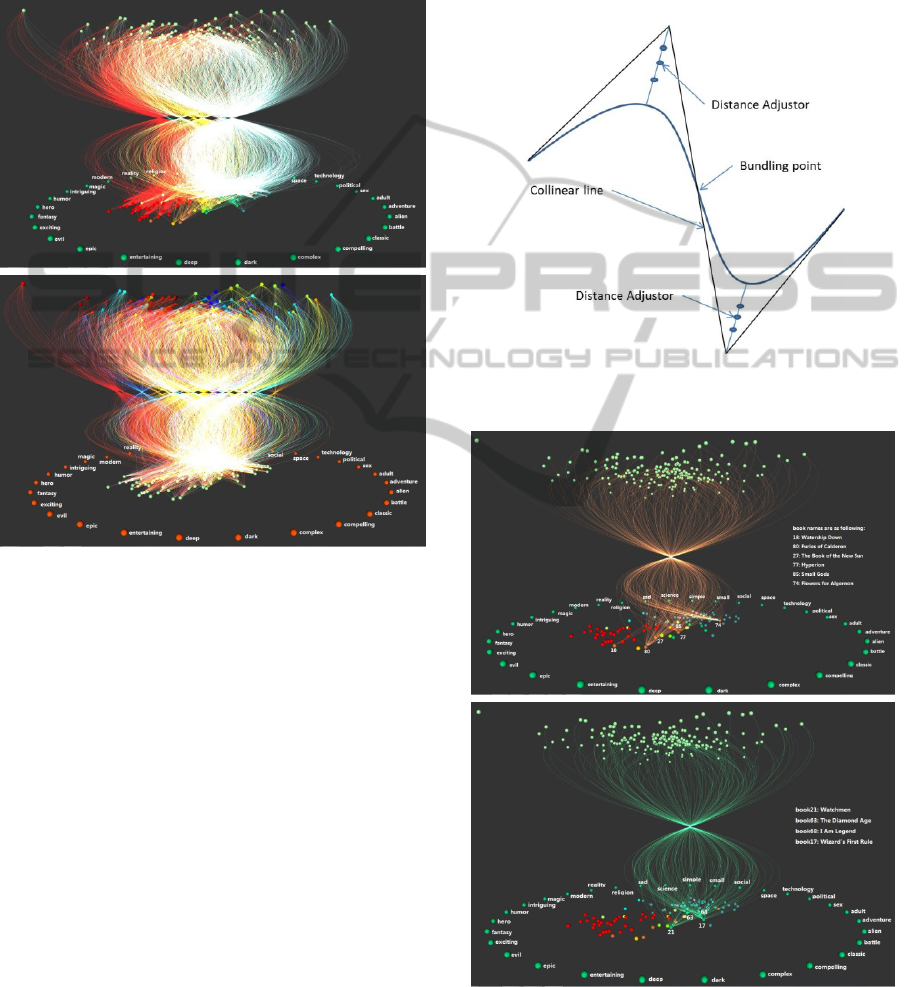
5.2 Correlative Cluster Views
One important data analysis goal for online reviews
is to identify the relationships and correlations
between products (books, in this case) and users
(readers, in this case). For this purpose, we develop
a 3D visualization technique called Correlative
Views.
In this method, books and readers are defined on
two parallel coordinate planes (book plane and
reader plane). On each plane, the data points are
placed within a circular area with the 30
variables(tags) defined on the circumference. The
2D radial coordinates of the data points are
computed using a weighted average of the locations
of the tags on the circumference. Since the tags are
placed exactly the same way on both coordinate
planes, the relative locations of the books and
readers represent the similarities of these data points.
Figure 1: Parallel coordinates plots of books. Figure 2: Parallel coordinates: accumulated view.
Figure 3: Parallel coordinates: cluster views.
VisualizationandClusteringofOnlineBookReviews
191
For example, if a reader is located at the same X-Y
location as a book does (though on two parallel
coordinate planes), then it is likely that the book and
the reader have similar tag coordinates (which
implies that this reader has a greater chance of liking
this book (Lin, 2013)).
Figure 4: Correlative cluster views view.
A curve connecting a book point and a reader point
will be generated if the reader has written a review
for that book. The reason curves are used is because
we would like to tie all curves coming from the
same cluster to form a bundle to show the
distributions of the clusters between the two spaces.
These connection curves will be defined with the
following characteristics:
1) The curve needs to be continuous everywhere
including at the bundling point.
2) The length of the curve is proportional to the
Euclidean distance between the book point and
the reader point (in the 30 dimensional tag
space). This creates the impression of a bendind
non-linear space.
3) If clusters are shown on one coordinate plane,
the colors of the curves will represent the colors
of their clusters.
4) The brightness (implemented using color
opacity) of a curve is proportional to the review
rating the reader gave the book. So it represents
how much the reader like this book.
The curves are implemented using Bezier curves.
Each connection curve is formed by two second
degree Bezier curves that are connected at the
bundling point. Their geometric continuity is
ensured by adjusting the two control points on the
two sides of the bundling point to form a collinear
line, as shown in Figure 5.
Figure 5: Generating a connection curve using two Bezier
curves.
Figure 6: Correlative cluster views view with only one
cluster at a time.
In Figure 4, two visualizations are generated with
IVAPP2014-InternationalConferenceonInformationVisualizationTheoryandApplications
192

our dataset, one showing books clusters and the
other showing the reader clusters. The dataset
includes 100 books, 162 readers, and 4715 reviews.
When the number of curves becomes large, the
visualization can be a little cluttered. In that case, we
may opt to show curves related to only one or two
clusters. Figure 6 shows two separate visualizations
for two different clusters.
6 CONCLUSIONS
In this paper, we proposed a way to visualize and
mine attributes from online book reviews by
identifying book features in the review text as
keyword tags to form a high-dimensional dataset.
Automatic cluster algorithm is applied to generate
clusters with both books and readers. The
visualization provides intuitive views of the
relationships of these books and readers, along with
their cluster information. The parallel coordinate
views also show that it is possible to visually
identify the clusters by visually and spatially
bundling data points. From the clusters, we have
demonstrated that meaning but non-trivial clusters
can be generated using carefully selected keyword
tags.
In the correlative cluster view, we opt to use 3D
visualization, instead of the more common 2D
information visualization techniques. While 3D
visualization is not always desirable for abstract
data, it does indeed provide added values in
situations when relationships and correlations need
to be explored from multiple visualization spaces.
The additional spatial dimension is critical here to
build the need relationships among multiple data
entities and their clusters.
In the future, we would like to further develop
this visualization system by introducing richer
interactive operations and visual queries such that
users can flexibly explore the dataset with various
clustering algorithms, tag options, and even text
content (as seen in (Alper, 2011)). We would also
like to increase the scale of the dataset. A much
larger dataset is available with Goodreads. We
would like to test how this technique works with a
massive dataset, evaluate the scalability of the
system, and develop more scalable techniques to
reduce the clutters in the 3D view. Another potential
direction is to expand the keyword tags to more
sophisticated concepts that can be extracted from the
text using text mining. This will allow more
interesting and subtle sentiment analysis. Finally, we
would like to study possible applications,
particularly how it can be used in marketing and
social network communications.
ACKNOWLEDEGMENTS
We would like to thank the Goodreads community
for writing the reviews we used in this work, as well
as the team at Goodreads, for providing us with
access to their data. This work is partly sponsored
NSFC (NO.61170315) and Opening Fund of Top
Key Discipline of Computer Software and Theory in
Zhejiang Provincial Colleges at Zhejiang Normal
University (No. ZSDZZZZXK07.
REFERENCES
Feldman, R., Dagan, I., 1995. Knowledge discovery in
textual databases (KDT). In Proceedings of the First
International Conference on Knowledge Discovery
and Data Mining. pp. 112-117.
Feldman, R., I. Dagan, and H.Hirsh, 1998. Mining Text
Using Keyword Distributions. In Journal of Intelligent
Information Systems: Integrating Artificial
Intelligence and Database Technologies, pp. 291-300.
Salton, G., C. Buckley, 1988. Term-weighting approaches
in automatic text retrieval. In Information Processing
and Management, vol. 24, no. 5, pp. 513-523.
Salton, G., 1989. Automatic Text Processing: The
Transformation, Analysis, and Retrieval of
Information by Computer. Reading, Addison-Wesley,
Sahar, S., 1999. Interestingness via what is not interesting.
In The Fifth ACM SIGKDD International Conference
on Knowledge Discovery and Data Mining, pp. 332-
336.
Silberschatz, A., A. Tuzhilin, 1996. What makes patterns
interesting in knowledge discovery systems. In IEEE
Transactions on Knowledge and Data Engineering,
vol. 8, issue 6, pp. 970-974.
Oelke, D., P. Bak, D. Keim, M. Last, and G. Danon, 2008.
Visual evaluation of text features for document
summarization and analysis. In IEEE Symposium on
Visual Analytics and Technology, pp. 75-82.
You, Q., S. Fang, and P. Ebright, 2010. Iterative visual
clustering for Unstructured Text Mining. In
International Symposium on Biocomputing, Calcuit,
Kalara, India.
Pang, B., L. Lee, 2008. Opinion Mining and Sentiment
Analysis. In Foundations and Trends in Information
Retrieval, vol. 2, no. 1-2, pp. 1-135.
Blitzer, J., M. Dredze, and F. Pereira, 2007. Biographies,
Bollywood, Boom-Boxes, and Blenders: Domain
adaptation for sentiment classification. In Proceedings
of the 45th Annual Meeting of the Association for
Computational Linguistics, pp. 440-447.
Wanner, F., J. Fuchs, D. Oelke, D. Keim, 2011. Are my
VisualizationandClusteringofOnlineBookReviews
193

children old enough to read these books? Age
suitability Analysis. In Polibits, vol. 43, pp. 93-100.
Chambers, J., 1983. Graphical Methods for Data Analysis,
Chapman and Hall, New York.
Inselberg, A., B. Dimsdale, 1990. Parallel coordinates: a
tool for visualizing multi-dimensional geometry. In:
Proceedings of the 1st conference on Visualization
’90, IEEE Computer Society Press, Los Alamitos, CA,
USA, pp. 361–378.
Becker, R., W. S. Cleveland, 1987. Brushing scatterplots,
Technmetrics 29 (2), 127–142.
Jollie, I., 1986. Principal Component Analysis, Springer
Verlag.
Fukunaga, K., 1990. Introduction to Statistical Pattern
Recognition, Academic Press, New York.
Cox, T., M. Cox, 2000. Multidimensional Scaling, Second
Edition, Chapman and Hall/CRC.
Kohonen, T., M. R. Schroeder, T. S. Huang, 2001. Self-
Organizing Maps, Springer-Verlag New York, Inc.,
Secaucus, NJ, USA.
Johansson, S., J. Johansson, 2009. Interactive
dimensionality reduction through user-defined
combinations of quality metrics. IEEE Transactions on
Visualization and Computer Graphics, 15(6):993–
1000.
You, Q., Fang, S., Chen, J, 2010. GeneTerrain: Visual
Exploration of Differential Gene Expression Profiles
Organized in Native Biomolecular Interaction
Networks. Journal of Information Visualization, 9:1,
1-12.
Choo, J., S. Bohn, H. Park, 2009. Two-stage framework
for visualization of clustered high dimensional data,
in: IEEE VAST, pp. 67–74.
Nam, E., Y. Han, K. Mueller, A. Zelenyuk, D. Imre, 2007.
Clustersculptor: A visual analytics tool for high-
dimensional data, in: IEEE VAST, IEEE, pp. 75–82.
Henry, N., J.-D. Fekete, and M. J. McGuffin, 2007.
Nodetrix: a hybrid visualization of social networks.
IEEE Transactions on Visualization and Computer
Graphics, 13(6):1302–1309.
Seo, J. B. Shneiderman, 2002. Interactively exploring
hierarchical clustering results. IEEE Computer,
35:80–86.
Elmqvist, N., P. Dragicevic, and J. Fekete, 2008. Rolling
the dice: multidimensional visual exploration using
scatterplot matrix navigation. IEEE Transactions on
Visualization and Computer Graphics, 14(6):1141–
1148.
Lin, E., Fang, S., Wang, J., 2013. Mining Online Book
Reviews for Sentimental Clustering. 2013 IEEE
International Conference on Advanced Information
Networking and Applications (AINA), Workshop on
Data Mining and Social Networks, Barcelona, Spain.
Alper, B., Yang, H., Haber, E., and Kandogan, E., 2011.
OpinionBlocks: Visualizing Consumer Reviews, in
IEEE VisWeek Workshop on Interactive Visual Text
Analytics for Decision Making.
IVAPP2014-InternationalConferenceonInformationVisualizationTheoryandApplications
194
