
Exploring Residual and Spatial Consistency for Object Detection
Hao Wang, Ya Zhang and Zhe Xu
Institute of Image Communication and Information Processing
Shanghai Jiao Tong University, Shanghai, China
Keywords:
Visual Object Detection, Wide Baseline Matching, Local Image Feature, Spatial Consistency.
Abstract:
Local image features show a high degree of repeatability, while their local appearance usually does not bring
enough discriminative pattern to obtain a reliable matching. In this paper, we present a new object matching
algorithm based on a novel robust estimation of residual consensus and flexible spatial consistency filter. We
evaluate the similarity between different homography model via two-parameter integrated Weibull distribution
and inlier probabilities estimates, which can select uncontaminated model to help eliminating outliers. Spatial
consistency test was encoded by the geometric relationships of domain knowledge in two directions, which is
invariant to scale, rotation, and translation especially robust to the flipped image. Experiment results on nature
images with clutter background demonstrate our method effectiveness and robustness.
1 INTRODUCTION
With the increasing popularity of image applications
on internet such as Google Image and Flickr, consid-
erable attention has been directed to image detection
and classification in multimedia research communi-
ties. However, accurate object recognition remains a
challenging problem, because the target object may
be small in size with cluttered background, or it is
significantly different from the query image in color,
scale, and orientation.
Among existing methods, the bag-of-features
model (Sivic and Zisserman, 2003; Lazebnik et al.,
2006) has been a popular technique because of its
simplicity and effectiveness. This method quantizes
local image descriptors into distinct visual words for
scalable image indexing and searching. With the in-
verted index of visual words, one not only avoids stor-
ing and comparing high dimensional local descrip-
tors, but also reduces the number of candidate images
because only images sharing common words with the
query image are considered. To improve the pre-
cision of the matching, a visual word may be aug-
mented with compact information from its original
local descriptor, including a Hamming code (Jegou
et al., 2008), descriptor scale and angle, and the dis-
tance (in descriptor space) to its neighboring visual
words.
Geometric verification such as RANSAC is a cru-
cial step after retrieval from the inverted index. Many
extensions of RANSAC have been proposed in or-
der to improve the accuracy of the matching. Multi-
GS (Chin et al., 2010) accelerates hypothesis sam-
pling by guiding it with information derived from
residual sorting. The LO-RANSAC (Chum et al.,
2003) method introduces an inner RANSAC loop into
the main RANSAC algorithm such that hypotheses
may be generated from the set of inliers. Guided-
MLESAC (Tordoff and Murray, 2005) and PROSAC
(Chum and Matas, 2005) focus on sampling more
confident keypoint matches. The above two meth-
ods are essentially guided only by the prior inlier
probabilities and do not conduct conditional sam-
pling to further improve efficiency. GroupSAC (Ni
et al., 2009) focuses on sampling groups of data ob-
tained using image segmentation. SCRAMSAC (Sat-
tler et al., 2009) introduces a spatial filtering step such
that matches with similar local geometry are consid-
ered. ARRSAC (Raguram et al., 2008) performs a
partially breadth-first verification such that the num-
ber of hypotheses may be modified according to the
inlier ratio estimation while still bounding the run-
time.
In recent years, spatial context have been proven
to be useful for enhancing the discriminative power
of individual local features. Features that are close to
each other are grouped to form a visual phrase. Visual
phrase is formed by two different methods. The first
type of methods mainly relies on object segmentation
or region detection, which finds spatial context of ob-
ject locating area by detecting contour (Russell et al.,
2006; Wu et al., 2009). An example of such meth-
191
Wang H., Zhang Y. and Xu Z..
Exploring Residual and Spatial Consistency for Object Detection.
DOI: 10.5220/0004746801910197
In Proceedings of the 9th International Conference on Computer Vision Theory and Applications (VISAPP-2014), pages 191-197
ISBN: 978-989-758-004-8
Copyright
c
2014 SCITEPRESS (Science and Technology Publications, Lda.)

ods is bundled-feature which groups features in local
MSER regions described by SIFT into a local group
to increase the discriminative power of local features
(Zhang et al., 2011). However, object need to be seg-
mented accurately. Otherwise the visual phrase will
be far away from the correct area. The second type of
methods selects the visual phrase at a fixed area, such
as geometry-preserving visual phrases that capture
long-range spatial layouts of the words (Sivic and Zis-
serman, 2009). They were generating a higher-level
lexicon, i.e. visual phrase lexicon, where a visual
phrase is a meaningful spatially co-occurrent pattern
of visual words (Jiang et al., 2011; Li et al., 2011).
In (Lowe, 2004), local spatial consistency from some
spatial nearest neighbors is used to filter false visual-
word matches.
In this work, we propose a novel robust estimation
of residual consensus and flexible spatial consistency
filter for object matching. Specifically, we evaluate
the similar structure from different homography mod-
els in two aspects. Firstly, We extend RANSAC to
model residuals distribution using two-parameter in-
tegrated Weibull which is between a power-law and
a Gaussian distribution. Secondly, we calculate the
normalized overlap of sorted residuals obtained from
hypothesis generation. For spatial consistency fil-
ter, previous literatures usually describe the relative
spatial positions between each feature pair along the
horizontal (X-axis) and vertical (Y-axis) directions or
measuring angles only in one direction. However, we
measure spatial consistency using geometric relation-
ships of globally point distribution in both clockwise
and counterclockwise, which is invariant to scale, ro-
tation, and translation especially robust to flipped im-
age.
2 RESIDUAL AND SPATIAL
CONSISTENCY
The SIFT feature is one of the most robust and distinc-
tive features (Kalantidis et al., 2011). SIFT feature
descriptor is invariant to uniform scaling orientation,
and partially invariant to affine distortion and illumi-
nation changes. Local interest points are extracted
by DOG detector and described by 128-dimensional
SIFT descriptor. A bag of visual words (BOW) is
obtained by quantizing high-dimensional local im-
age descriptors through clustering. An inverted index
structure is used for retrieval and each visual word has
an entry in the index that contains the list of images in
which the visual word occurs. Additionally, the tf-idf
weight is used to distinguish different matched fea-
tures. However, this structure ignores geometric re-
lationships among visual words due to quantization.
Geometric verification such as RANSAC becomes an
important post-processing step for getting reasonable
retrieval precision, especially for distorted images.
Given a set of tentative correspondences, a minimal
subset of size m is randomly sampled to hypothesize
a geometric model. Then the model is verified by
the remaining correspondences. This process is iter-
ated until a termination is met. Despite the effective-
ness of RANSAC, false matching might still appear
in a real application. An extension of the RANSAC
is proposed by adding an optimization procedure to
solve this problem. We compute the similarity be-
tween different homography model via residual or-
dering distribution, which can select uncontaminated
model to help eliminating outliers. Spatial consis-
tency test was encoded by the geometric relationships
of domain knowledge in both clockwise and counter-
clockwise, which is measured by relative orientation
and distance order. The use of spatial configuration
of local features aims at reducing the number of mis-
matches in the correspondence set.
2.1 Residual Consensus
Residual ordering distribution is useful for distin-
guishing between contaminated models and uncon-
taminated models. Naturally, residual errors obtained
from uncontaminated models are approximate simi-
lar with each other. Thus, potential patterns can be
discovered by evaluating the similarity between these
structures to help finding the optimal models.
Formally, given a set of N input data. Under the
hypothesize-and-verify framework, a model is fitted
by a minimal sample. Let R
i
= {r
i
1
, r
i
2
, ..., r
i
N
} be ab-
solute residuals corresponding to the input data. We
then find the permutation S
i
= {λ
i
1
, λ
i
2
, ...λ
i
N
} such
that the residuals are sorted in increasing order. We
define the intersection set Θ
i, j
n
as,
Θ
i, j
n
= S
i
1:n
\
S
j
1:n
, (1)
where S
i
1:n
denote the subset containing the first n
points of S
i
and S
i
1:n
T
S
j
1:n
finds the number of overlap
elements from S
i
1:n
and S
j
1:n
. We also give the normal-
ized overlap θ
i, j
n
.
θ
i, j
n
=
1
n
|Θ
i, j
n
|, (2)
Intuitively, Similar models should have the most
overlap of small value residuals. To verify this
method for distinguish uncontaminated and contam-
inated models, an example is shown to illustrates this
intuition explained. In details, we generate 400 ho-
mography hypotheses on the real images and select
VISAPP2014-InternationalConferenceonComputerVisionTheoryandApplications
192
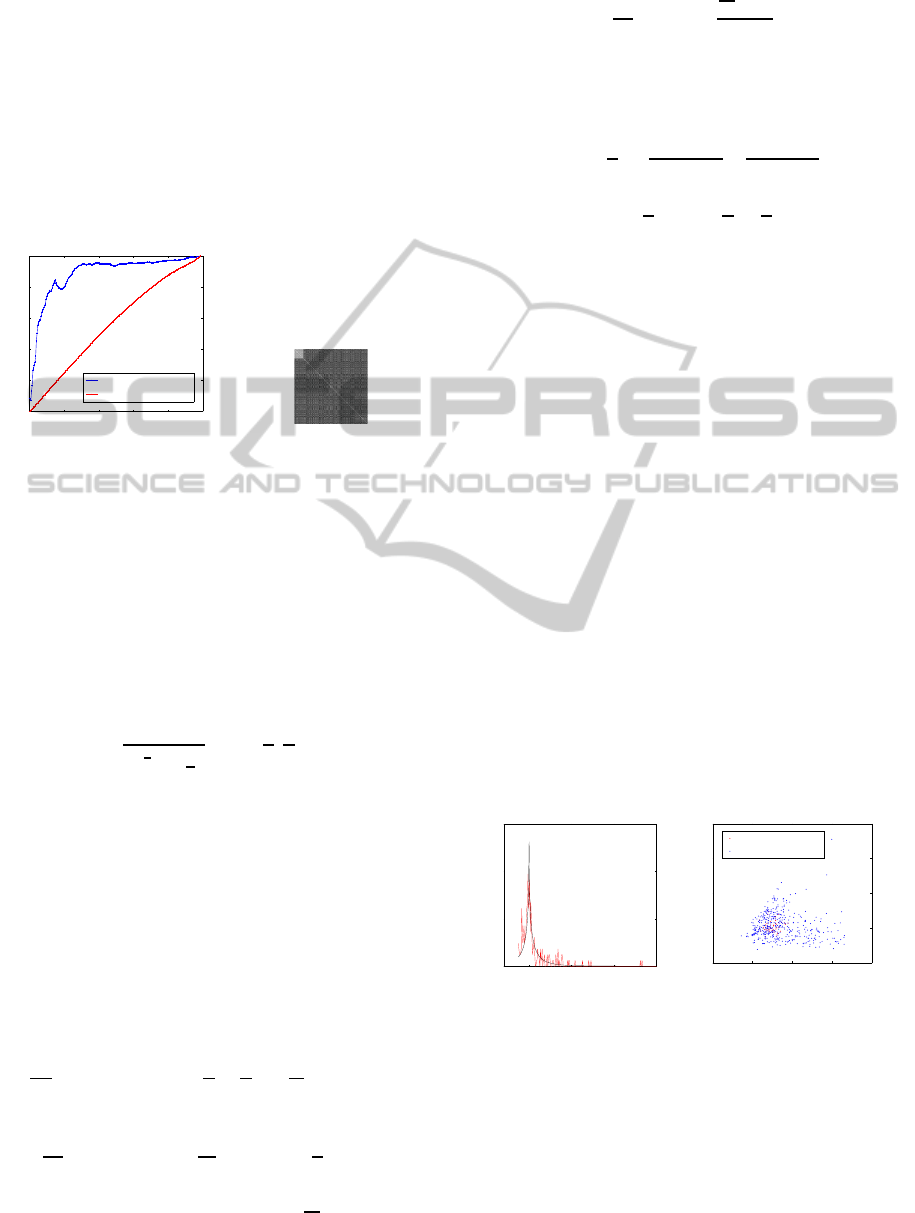
the uncontaminated models to compare with the ran-
dom models. Fig.1(a) plots the normalized overlap
θ
i, j
n
of sorted residuals from uncontaminated mod-
els and random models, respectively. Fig.1(b) shows
a block diagonal pattern of θ
i, j
n
(1 ≤ i, j ≤ 400), in
which, the points are scattered according to their
structure membership. The results show that, the val-
ues for an inlier concentrate mostly on other inliers
from the same distribution, while for a outlier the
value are generally low and appear to be randomly
distributed.
0 50 100 150 200 250
0
0.2
0.4
0.6
0.8
1
n
Norm. overlap
Uncontaminated Model
Random Model
(a) (b)
Figure 1: (a) Normalized overlap vs. subset size n for un-
contaminated models and random models. (b) The corre-
sponding matrix of size 400*400 with subset is set to 80.
We use a statistical model as an another means to
characterize the qualitive differences between mod-
els. By observing the data, the distribution of resid-
uals is usually between a power-law and a Gaussian
distribution, can be well modeled by a two-parameter
integrated Weibull distribution,
p(x) =
γ
2γ
1
γ
βΓ(
1
γ
)
exp{−
1
γ
|
x
β
|
γ
}, (3)
where x is the residuals of geometric model. γ > 0
denotes the peakness of the distribution. β > 0 repre-
sents the scale parameter of the distribution. Γ(x) is
the complete Gamma function.
Γ(x) =
Z
∞
0
t
x−1
exp(−t)dt, (4)
Given the observed data X = x
1
, x
2
, ...x
n
. The best
fit is obtained when model parameters maximize the
log-likelihood function, in which case their respective
derivatives should equal zero.
∂
∂β
lnL
iw
(β, γ|X) = −
1
β
+
1
β
n
∑
i=1
|
x
i
β
|
γ
= 0, (5)
∂
∂γ
lnL
iw
(β, γ|X) =
1
γ
2
(γ− 1+ Ψ(
1
γ
)+
ln(γ) +
n
∑
i=1
|
x
i
β
|
γ
),
(6)
Ψ(γ) =
d
dγ
lnΓ(γ) =
d
dγ
Γ(γ)
Γ(γ)
, (7)
The parameter is obtained by eliminating from
Eq.(6):
f(γ, X) = −
1
γ
n
∑
i=1
|x
i
|
γ
∑
n
i=1
|x
i
|
γ
ln
|x
i
|
γ
∑
n
i=1
|x
i
|
γ
+1+
1
γ
ln(γ) +
1
γ
Ψ(
1
γ
) = 0.
(8)
Eq.(6) is solved using standard iterative proce-
dures, for example, the Newton-Raphson. Fig.2(a)
displays the fitting result using an integrated Weibull
distribution. The residual is subtracted by median be-
cause we want the peak of probability density is lo-
cated on where residual equal zero. As in Fig.2(b),
we can see that the two parameters of models build
up a 2-D map and the most uncontaminated mod-
els come from the intensive area. Therefore, we can
use this property to capture uncontaminated models.
Given discrete data points from 2-D map, the center of
the intensive area is located using mean-shift method
(Comaniciu and Meer, 2002). Here, the mean-shift
path toward the mode follows a smooth trajectory, and
the angle between two consecutive vectors being al-
ways less than 90 degrees. The search procedure can
be interpreted as kernel density estimation for the po-
sition of the model distribution points. Moreover, we
define an elliptical area lying on the center of the 2-D
map, such that, the major axis l
1
parallel to scale axis
and minor axis l
2
parallel to shape axis. In this case,
the models within the elliptical area are kept for spa-
tial consistency test and unpromising hypotheses can
be quickly filtered out .
0 20 40 60
0
0.005
0.01
0.015
Residual
Probability density
(a)
0 50 100 150 200
0
0.5
1
1.5
2
scale
shape
uncontaminated models
contaminated models
(b)
Figure 2: (a) Residual distribution is fitted by an integrated
Weibull model. (b) The parameter map of uncontaminated
models and contaminated models.
2.2 Spatial Consistency Analysis
Given an image I, we extract a set of visual words
U(I) = {u
i
} with center coordinates (x
i
, y
i
) and
V(I) = {v
j
} is another visual word. In an image pair
ExploringResidualandSpatialConsistencyforObjectDetection
193

(I
1
, I
2
), all the point correspondences are established
by visual words. Thus, we obtain a correspondence
set C,
C = {(u
i
, v
j
)|u
i
∈ U ∧ v
j
∈ V}. (9)
We define a matching score M(I
1
, I
2
), which con-
sists of a membership term M
m
(I
1
, I
2
) and a geometric
M
g
(I
1
, I
2
).
M(U,V) = M
m
(U,V) + λM
g
(U,V), (10)
where λ is a weighting parameter. For membership
term, we compute inlier scores to define the member-
ship term M
m
(U,V).
Our geometric term performs a weak geometric
verification between training image I
1
and query im-
age I
2
using relative ordering, and we incorporate ori-
entation configuration into distance configuration. In
detail, the minimal value of two kinds of configura-
tion is the final value,
M
g
(U,V) = min(M
g1
(U,V), M
g2
(U,V)), (11)
where, M
g1
(U,V) is orientation configuration term
and M
g2
(U,V) is distance configuration term. As in
Fig.3, the centroid of all the features is located as a
reference point. Starting from zero degree, the whole
visual words position is scanned clockwise. As the
angle increases, each visual word is assigned a num-
ber with ascending order. Note that the visual word
from testing image has the same number as training
one if they are the matching pair. The inconsistency
is accumulated by the difference of neighbor number
between training image and testing image,
M
D
g1
(U,V) = −
∑
i
δ(O
v
[u
i
] > O
v
[u
i+1
]), (12)
where D is a pre-defined geometric sorting order, and
δ(O
v
[u
i
] > O
v
[u
i+1
]) is an indicator function that mea-
sures the consistency between the order i < i+ 1 (be-
fore matching) and the order O
v
[u
i
] > O
v
[u
i+1
] (after
matching). In other words, we penalize geometric in-
consistency of the visual word matching between two
images and put a weight to inconsistency avoid for
weak discrimination by small difference. In order to
match flipped image, the minimal inconsistency is set
as final scores from clockwise and counterclockwise
image scan,
M
g
(U,V) = min(M
C
g
(U,V), M
A
g
(U,V)), (13)
where M
C
g
(U,V) is computed by a geometric verifica-
tion via clockwise, and M
A
g
(U,V) by a counterclock-
wise geometric verification. For spatial consistency
filter with distance, the only differencebetween orien-
tation is that we compare the distance from reference
point to the position of visual words.
(a)
(b)
(c)
Figure 3: The ordering constraint for local features. (a)
Correct matches preserve the relative orientation orders; (b)
Wrong matches results in inconsistent relative orientation
orders; (c) Wrong matches results in inconsistent relative
distance orders.
2.3 Algorithm
Consider the residual consensus aforementioned, a
statistical rest that evaluates the similarity between
distributions can give the optimal homographymodel.
Specifically, we first measure the fraction of models
by Weibull distribution intensivearea which is located
using mean-shift method. Then we restrict all fur-
ther processing to correspondences where this frac-
tion surpasses a threshold T by inlier probabilities
estimates, resulting in a reduced set of models. our
approach combines the robust estimation of residual
consensus and spatial consistency filter in a unified
framework. The details of algorithm are shown in Al-
gorithm 1.
Generally, image retrieval system uses criteria
whether the absolute matching number exceeds a cer-
tain threshold to decide the final matching results.
However, taking into account the different complex-
ity of the images and different number of features,
which lead to more correspondence generating in im-
ages with large number features. In that case, even if
the query image does not have the object, the features
of the object still have high probabilities to match
the other parts of the image. In our approach, we
use the total number of features as penalty factor to
eliminate this problem. Note that the importance of
inliers is different because of residuals of geometric
model have diverse values. The residual with small
values is more important for correspondence selec-
tion, because they have high probabilities to become
true inliers. We follow MLESAC(Maximum Likeli-
hood SAC) (Torr and Zisserman, 2000) to define the
VISAPP2014-InternationalConferenceonComputerVisionTheoryandApplications
194

Algorithm 1: Residual and spatial consistency.
1. Hypothesis generation
k = 0
while k < k
max
do
Randomly sample minimal subset of m points.
Estimate model parameters θ
k
.
end while
2. Residual consensus
Sort residuals, store sorted index S
i
and residual er-
rors
for all models S
i
in {M
1
, M
2
, ...M
i−1
} do
Fit integrated Weibull distribution to sorted
residuals.
The most intensive area S
∗
is located using
mean-shift method.
Store models come from this area.
Compute intersection Θ
i, j
n
for M
i
and M
j
, and
normalize to θ
i, j
n
.
if θ
i, j
n
> T for some n then
Store K uncontaminated models and find the
model with large number inliers.
end if
end for
3. Spatial Consistency
Gain orientation and distance between visual word
via position and centroid.
Compute inconsistency M
g
(U,V) using different
permutation.
loss function. It models inliers error as unbiased
Gaussian distribution and outlier error as uniform dis-
tribution.
3 EXPERIMENTAL RESULTS
In this section, experiments were conducted to
demonstrate the effectiveness of the proposed resid-
ual and spatial consistency method on real image
datasets. Yannis et al. [16] built the FlickrLo-
gos dataset by downloading real-world images from
Flickr containing 27 logos covering various aspects of
life. The 27 logo classes is Adidas, Apple, BMW, Cit-
roen, Coca-Cola, DHL, Fedex, Ferrari, Ford, Google,
Heineken, HP, Intel, McDonalds, Mini, Nbc, Nike,
Pepsi, Porsche, Puma, RedBull, Sprite, Starbucks,
Texaco, Unicef, Vodafone, and Yahoo. The dataset
selected 40 images per class from Flickr, and every
selected image include at least one instance of the
brands logo. All 1080 images were annotated with
bounding boxes. The annotated logo was partitioned
into 2 subsets: The training set has 30 randomly se-
lected images from the 40 images per brand, and the
rest were the test set. To further verify the scalabil-
ity and effectiveness of our approach, we add 500
crawled Flickr images with noting logos and 230 with
logos to the test set.
Baseline. We use Trademark Matching (Bagdanov
et al., 2007) approach with RANSAC as the base-
line approach, which is denoted as “RANSAC”. The
method is a compact representation of trademarks and
video frame content based on SIFT feature points,
which is state-of-the-art logo detection methods, and
has been used in commercial application. In the
paper, a visual vocabulary of 2M visual words is
adopted. In fact, we have experimented with differ-
ent visual codebook sizes, and have found the 2M vo-
cabularies yield the best overall performance for the
baseline.
Comparisons. Another two compared algorithms are
improved versions of baseline by adding different ge-
ometry consistency. The first one is Hamming Em-
bedding [3] by adding a hamming code to filter out
matched features that have the same number of quan-
tized visual words but have a large hamming distance
from the query feature. We denote this method as
“HE.” The second one is accelerate hypothesis sam-
pling by guiding it with information derived from
residual sorting [6], which is denoted as “Multisac”.
In this paper, we set a fraction of inliers T to 0.95
in Residual consensus evaluation. For pairs of uncon-
taminated models, we found that when subset n close
to the true inlier ratio, θ
i, j
n
is approaching T. For pa-
rameter of elliptical area, we set the value of l
1
and l
2
to 40 and 0.25. We look for K good models to provide
robustness structure. In our experiments, setting K =
3 was sufficient in practice. We empirically exam-
ine the ratio of optimal RANSAC score and geomet-
ric inconsistency. The parameter is set in the range
of λ = [0, 0.5, ..., 2.5]. For each varying of λ, we run
the residual and spatial consistency approach. Table 1
shows that λ = 1.0 is the most effective value. Param-
eters γ and σ are set to 0.7 and 0.3 for Loss function.
Table 1: Comparing the performance for varying λ.
λ 0 0.5 1.0 1.5 2.0 2.5
Accuracy 73.41 75.95 76.42 74.57 72.49 70.52
Performance results when varying the number of
training images are presented in Fig.4. To vary the
number of training images, we split the training set
into 5 random subsets of 5 images per class. Fig.5
shows performance comparison with Recall and Pre-
cision curves. We can see that our approach leads
to a better detection performance compared with the
other algorithms. Fig.6 displays the matching re-
sults between the same objects. It can be observed
ExploringResidualandSpatialConsistencyforObjectDetection
195
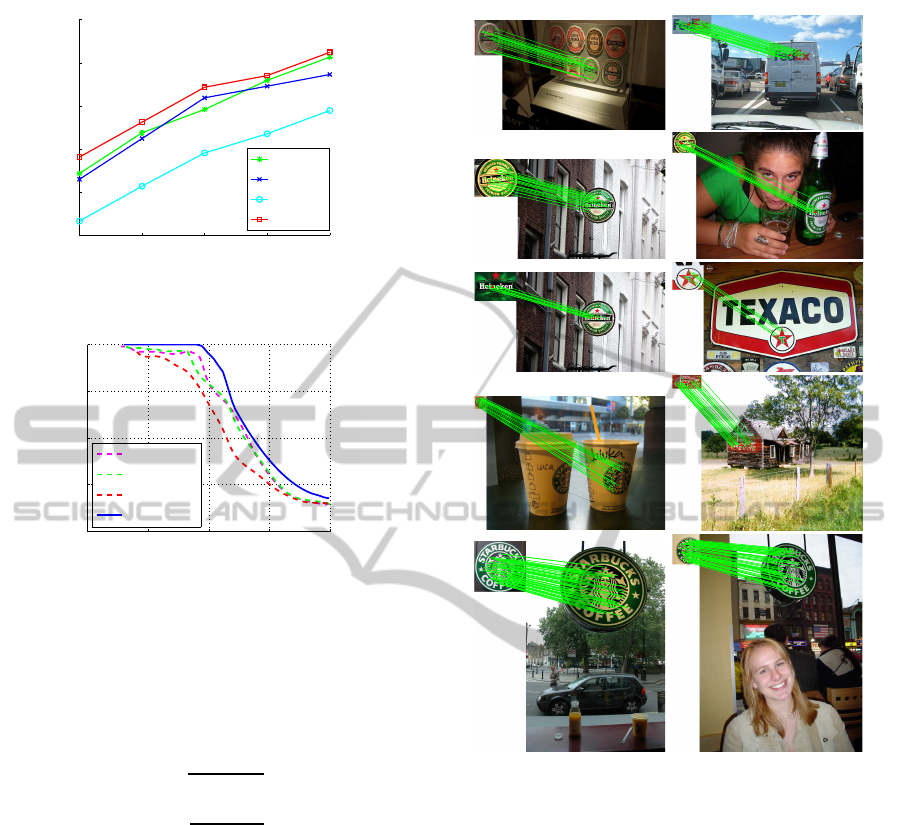
10 15 20 25 30
68
70
72
74
76
78
# of training samples per class
Accuracy
Multisac
HE
RANSAC
Proposed
Figure 4: Compare with other method on different training
samples per class.
0.2 0.4 0.6 0.8 1
0.2
0.4
0.6
0.8
1
Recall
Precision
Multisac
HE
RANSAC
Proposed
Figure 5: Precision and Recall curve comparison.
that most of matched ones locate on the object. As
a reminder, these curves are generated by varying
the matching threshold and computing the following
values:(TP:True Positive, FP:False Positive, FN:False
Negative)
Recall(%) =
TP
TP+ FN
× 100,
Precision(%) =
TP
TP+ FP
× 100,
(14)
4 CONCLUSIONS
In this paper, we present a new object matching algo-
rithm based on robust estimation of residual consen-
sus and flexible spatial consistency filter. For resid-
ual consensus, we model residuals distribution using
two-parameter integrated Weibull which is between a
power-law and a Gaussian distribution. Then we esti-
mate a series of inlier probabilities, which are updated
on the fly. For spatial consistency filter, we measure
spatial consistency using geometric relationships of
global point distribution in both clockwise and coun-
terclockwise, which is invariant to scale, rotation, and
translation especially robust to flipped image. Exper-
iments on clutter background images show that the
Figure 6: Sample matching results from the same objects.
proposed method leads to improvements in the per-
formance of object detection system.
ACKNOWLEDGEMENTS
This research was supported by the High Technol-
ogy Research and Development Program of China
(2012AA011702, 2011AA01A107).
REFERENCES
Bagdanov, A. D., Ballan, L., Bertini, M., and Del Bimbo,
A. (2007). Trademark matching and retrieval in sports
video databases. In Proceedings of the international
workshop on Workshop on multimedia information re-
trieval, pages 79–86. ACM.
Chin, T.-J., Yu, J., and Suter, D. (2010). Accelerated
hypothesis generation for multi-structure robust fit-
VISAPP2014-InternationalConferenceonComputerVisionTheoryandApplications
196

ting. In Computer Vision–ECCV 2010, pages 533–
546. Springer.
Chum, O. and Matas, J. (2005). Matching with prosac-
progressive sample consensus. In Computer Vision
and Pattern Recognition, 2005. CVPR 2005. IEEE
Computer Society Conference on, volume 1, pages
220–226. IEEE.
Chum, O., Matas, J., and Kittler, J. (2003). Locally opti-
mized ransac. In Pattern Recognition, pages 236–243.
Springer.
Comaniciu, D. and Meer, P. (2002). Mean shift: A robust
approach toward feature space analysis. Pattern Anal-
ysis and Machine Intelligence, IEEE Transactions on,
24(5):603–619.
Jegou, H., Douze, M., and Schmid, C. (2008). Hamming
embedding and weak geometric consistency for large
scale image search. In Computer Vision–ECCV 2008,
pages 304–317. Springer.
Jiang, Y., Meng, J., and Yuan, J. (2011). Grid-based local
feature bundling for efficient object search and local-
ization. In Image Processing (ICIP), 2011 18th IEEE
International Conference on, pages 113–116. IEEE.
Kalantidis, Y., Pueyo, L. G., Trevisiol, M., van Zwol, R.,
and Avrithis, Y. (2011). Scalable triangulation-based
logo recognition. In Proceedings of the 1st ACM
International Conference on Multimedia Retrieval,
page 20. ACM.
Lazebnik, S., Schmid, C., and Ponce, J. (2006). Beyond
bags of features: Spatial pyramid matching for rec-
ognizing natural scene categories. In Computer Vi-
sion and Pattern Recognition, 2006 IEEE Computer
Society Conference on, volume 2, pages 2169–2178.
IEEE.
Li, T., Mei, T., Kweon, I.-S., and Hua, X.-S. (2011). Con-
textual bag-of-words for visual categorization. Cir-
cuits and Systems for Video Technology, IEEE Trans-
actions on, 21(4):381–392.
Lowe, D. G. (2004). Distinctive image features from scale-
invariant keypoints. International journal of computer
vision, 60(2):91–110.
Ni, K., Jin, H., and Dellaert, F. (2009). Groupsac: Efficient
consensus in the presence of groupings. In Computer
Vision, 2009 IEEE 12th International Conference on,
pages 2193–2200. IEEE.
Raguram, R., Frahm, J.-M., and Pollefeys, M. (2008). A
comparative analysis of ransac techniques leading to
adaptive real-time random sample consensus. In Com-
puter Vision–ECCV 2008, pages 500–513. Springer.
Russell, B. C., Freeman, W. T., Efros, A. A., Sivic, J.,
and Zisserman, A. (2006). Using multiple segmen-
tations to discover objects and their extent in image
collections. In Computer Vision and Pattern Recog-
nition, 2006 IEEE Computer Society Conference on,
volume 2, pages 1605–1614. IEEE.
Sattler, T., Leibe, B., and Kobbelt, L. (2009). Scramsac: Im-
proving ransac’s efficiency with a spatial consistency
filter. In Computer Vision, 2009 IEEE 12th Interna-
tional Conference on, pages 2090–2097. IEEE.
Sivic, J. and Zisserman, A. (2003). Video google: A text
retrieval approach to object matching in videos. In
Computer Vision, 2003. Proceedings. Ninth IEEE In-
ternational Conference on, pages 1470–1477. IEEE.
Sivic, J. and Zisserman, A. (2009). Efficient visual search of
videos cast as text retrieval. Pattern Analysis and Ma-
chine Intelligence, IEEE Transactions on, 31(4):591–
606.
Tordoff, B. J. and Murray, D. W. (2005). Guided-mlesac:
Faster image transform estimation by using match-
ing priors. Pattern Analysis and Machine Intelligence,
IEEE Transactions on, 27(10):1523–1535.
Torr, P. H. and Zisserman, A. (2000). Mlesac: A new ro-
bust estimator with application to estimating image
geometry. Computer Vision and Image Understand-
ing, 78(1):138–156.
Wu, Z., Ke, Q., Isard, M., and Sun, J. (2009). Bundling
features for large scale partial-duplicate web image
search. In Computer Vision and Pattern Recognition,
2009. CVPR 2009. IEEE Conference on, pages 25–32.
IEEE.
Zhang, Y., Jia, Z., and Chen, T. (2011). Image retrieval
with geometry-preserving visual phrases. In Com-
puter Vision and Pattern Recognition (CVPR), 2011
IEEE Conference on, pages 809–816. IEEE.
ExploringResidualandSpatialConsistencyforObjectDetection
197
