
Exploring a Sub-optimal Hidden Markov Model Sampling Approach for
De Novo Peptide Structure Modeling
Pierre Thevenet
1,2
and Pierre Tuff´ery
1,2
1
INSERM, U973, MTi, F-75205 Paris, France
2
Univ Paris Diderot, Sorbonne Paris Cit´e, F-75205 Paris, France
Keywords:
Structure Prediction, Peptide, Structural Alphabet, Hidden Markov Models.
Abstract:
Peptides have, in the recent years, become plausible candidate therapeutics. However, their structural char-
acterization at a large scale, necessary for their identification and optimization, still remains an open in silico
challenge. We introduce a new procedure to the rapid generation of 3D models of peptides. It is based on
the concept of Hidden Markov Model derived structural alphabet, a generalization of the secondary structure.
Based on this concept we have previously setup an approach to the de novo modeling of peptide structure
based on a greedy algorithm. Here, we explore a new strategy that relies on the sampling of the sub-optimal
sequences of states in the terms of a Hidden Markov Model derived structural alphabet. Our results suggest
such procedure is able to identify the native conformation of peptides at a very low algorithmic complexity,
while having a performance similar to the former greedy approach. On average peptide models approximate
the experimental structure at less than 3
˚
A RMSD, for a processing cost of only few minutes on a workstation.
As a result, peptide de novo modeling becomes tractable at a large scale.
1 INTRODUCTION
The recent years have seen a regain of interest in
peptides as candidate therapeutics, some of the bot-
tlenecks for the use of peptides as drugs or protein-
protein interaction probes being overcome (Vlieghe
et al., 2010). However, the assistance of in silico ap-
proaches for the discovery of new peptides can still
largely be improved. Focusing on the structural char-
acterization of peptides, the number of genomes fully
sequenced, and experimental efforts to identify natu-
ral peptides - bacterial peptides (Hobbs et al., 2011),
venom peptides (Vetter et al., 2011), peptides of the
central nervous system (Malavolta and Cabral, 2011),
to cite some - make available a large amount of in-
formation about candidate peptides. The rate of de-
termination of peptide structure by Nuclear Magnetic
Resonance (NMR) spectroscopy or X-ray crystallog-
raphy remains however low.
Unlike proteins, peptides are known to be more
flexible, not always adopting a stable tri-dimensional
structure (Gellman and Woolfson, 2002), which
makes homology modeling techniques more chal-
lenging to use, compared to proteins. This is
why methods have been developed for the de novo
or ab initio peptide structure prediction. Among
these, PEPstr (Kaur et al., 2007), PepLook (Thomas
et al., 2009), I-TASSER (Zhang, 2008) Rosetta (Rohl
et al., 2004) or PEP-FOLD (Maupetit et al., 2010).
These approaches rely on different strategies. PEPstr
uses the secondary structure predicted by PSIPRED
(Jones, 1999) combined with a β-turn predictor to
predict conformations that are then refined by energy
minimization. I-TASSER relies on Lomets (Wu and
Zhang, 2007), a meta-threading approach, to iden-
tify template fragments from a collection of experi-
mentally determined structures. The most represen-
tative fragments are extracted and used for the as-
sembly of the complete peptide structure considering
only the alpha carbons and side chain centroids. A
Monte Carlo procedure is then applied to refine the
final structure. The structures generated are cluster-
ized (Zhang and Skolnick, 2004) and a second pass
is made considering fragments taken from the clus-
ter centroids. The all-atom models are finally gen-
erated (Li and Zhang, 2009) and are sorted accord-
ing to the C-score, an intrinsic measure of the qual-
ity of the structures. PepLook uses a Boltzmann-
Stochastic based algorithm (Thomas et al., 2006), that
generates structures by randomly selecting couples of
φ/ψ angles taken from canonical local conformations
(Etchebest et al., 2005) to cover the complete pep-
24
Thevenet P. and Tufféry P..
Exploring a Sub-optimal Hidden Markov Model Sampling Approach for De Novo Peptide Structure Modeling.
DOI: 10.5220/0004750000240030
In Proceedings of the International Conference on Bioinformatics Models, Methods and Algorithms (BIOINFORMATICS-2014), pages 24-30
ISBN: 978-989-758-012-3
Copyright
c
2014 SCITEPRESS (Science and Technology Publications, Lda.)

tide. The probabilities of each couple of angles are
then iteratively modified depending on the energy of
the conformation generated, and cycles of conforma-
tion generation - 10
4
conformations per step, energy
scoring - using the AMBER-95 force-field (Lins et al.,
2006), and probability refinement are performed un-
til convergence. PEP-FOLD is also based on the
prediction of the local conformation from an amino
acid sequence. Unlike PepLook, the assembly is per-
formed using a greedy algorithm to grow amino acid
by amino acid the structure of the complete peptide,
using the sOPEP coarse grained force-field (Maupetit
et al., 2007) to drive the assembly. The conforma-
tions generated are then refined using a Monte Carlo
procedure, then clusterized and sorted according to
sOPEP. On average, these methods have shown effi-
cient. For instance PEP-FOLD, one of the most effi-
cient approach so far, is able to approximate the ex-
perimental structure at a RMSD of only 2.8
˚
A for pep-
tides of size between 9 and 25 amino acids.
So far however, none of these approach is able
to cope with the large scale processing of millions
of sequences, which is the estimated order of mag-
nitude of the number of venom peptides (Escoubas
and King, 2009), or bacterial peptides (Warren et al.,
2010). Here, we introduce an improved version of
PEP-FOLD, that takes advantage of using the pre-
diction of the local conformations within the Hidden
Markov Model framework to efficiently select low en-
ergy conformations. This approach reduces the con-
formational sampling by several orders of magnitude,
which result in high speed peptide de novo prediction,
not affecting the performance of the approach, and
thus offering new perspectives for large scale peptide
structure prediction.
2 MATERIALS AND METHODS
2.1 Data Set
To evaluate the accuracy of the algorithms, we have
used the PepStr data set used in our previous stud-
ies (Maupetit et al., 2009). The PepStr set, origi-
nally introduced by Kaur and co-workers (Kaur et al.,
2007), consists in 15 peptides of size between 9 and
22 amino acids. Note that PepFold performance has
already been assessed on larger sets (Maupetit et al.,
2010) (Th´evenet et al., 2012). Here, since we are in-
terested in assessing how the new procedure we ex-
plore impacts the quality of the models returned, this
limited but representative set was found sufficient.
The peptides contain only natural amino acids, are lin-
ear - do not contain any disulfide bond, and are known
to be monomeric in aqueous solution.
2.2 Structural Alphabet
PEP-FOLD relies on the concept of Structural alpha-
bet (SA). SA can be assimilated to a generalization
of the secondary structure, with a larger number of
canonical conformations (SA states, or letters). Here,
we have used a Hidden Markov Model derived Struc-
tural Alphabet (HMM-SA) (Camproux et al., 2004).
In this model, a protein - or peptide, is considered as
a series of fragments of 4 residues overlapping by 3
residues. Hence, a protein of L amino acids, corre-
sponds to a series of L − 3 fragments. The fragments
are associated with 4 geometrical descriptors, namely
the three distances between the non consecutive al-
pha carbons of the fragment, and the triple-product
defining the signed volume of the fragment. The pa-
rameters of the HMM model are the mean values of
the descriptors of each state and their co-variance and
the transition matrix associated with the first order
Markovian process. For the present study, we have
used a 27 letter SA we have found to correspond to a
statistical optimum.
Given the model and the descriptors associated
with a conformation of a protein of size L, it is pos-
sible to identify the series of the L− 3 SA letters that
optimally describe the conformation using the Viterbi
algorithm (Viterbi, 1967). It is also possible to iden-
tify the probability that each letter emits each of the 4
amino acid fragment of the protein using the forward-
backward algorithm (Rabiner, 1989).
2.3 3D Model Generation from
Sequence
A flowchart of the complete model generation proce-
dure is depicted Figure 1. It consists in three steps.
The first is the prediction of a SA profile from the
amino acid sequence. The SA profile describes for
each of the L−3 fragments of 4 amino acids in the se-
quence, the probability that it is associated with each
of the 27 SA letter. In a second step, the SA profile
can be processed to select, for each position in the se-
quence, a limited number of SA letters. Since each
SA letter is associated with a limited number of pro-
tein fragments depending on its conformational vari-
ability, this corresponds to a fragment selection step.
In this study, we use two different selection strategies.
Finally, the fragments associated with the selected SA
letters are assembled to produce full structure models.
We describe more in detail each step in the following
sections.
ExploringaSub-optimalHiddenMarkovModelSamplingApproachforDeNovoPeptideStructureModeling
25
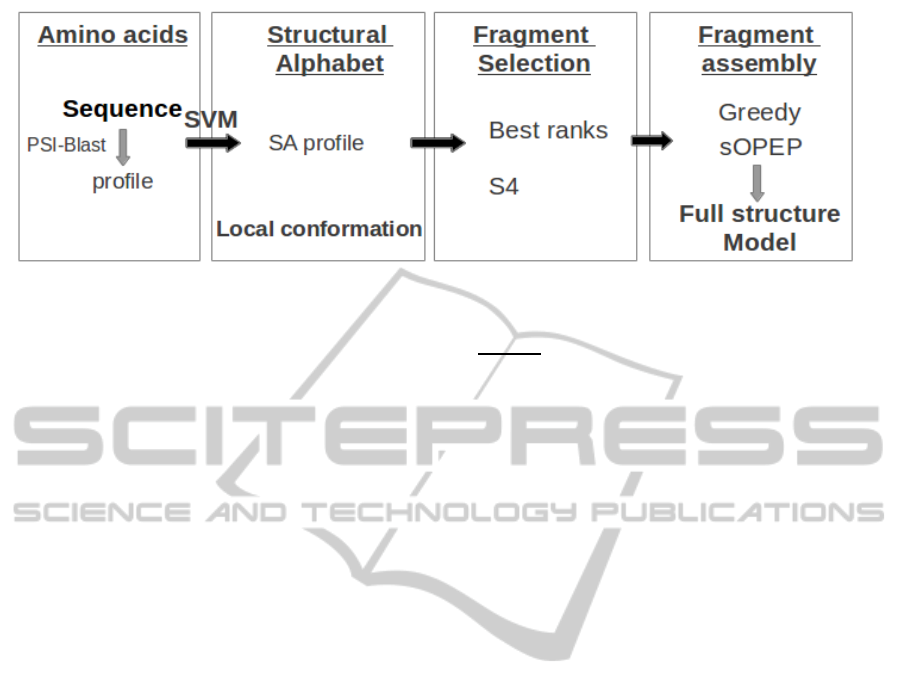
Figure 1: Model generation flowchart.
2.3.1 Structural Alphabet Prediction from
Sequence
The estimation of the probabilities of the states from
the amino acid sequence is a prediction problem.
Given an amino acid sequence, we have trained a
SVM to predict the probabilities of each state given
a sequence of 4 amino acids enlarged by two amino
acids each side (Maupetit et al., 2010) - i.e. using
a window of 8 amino acids centered on the 4 amino
acids of interest. In practice, the SVM takes as input
a matrix of 20∗ 8 values, where each series of 20 val-
ues corresponds to the probabilities of the 20 amino
acids at the corresponding positions, obtained using
PSI blast (Altschul et al., 1997) against the Uniprot
collection filtered at 90% sequence identity (Suzek
et al., 2007). We perform the prediction for each frag-
ment of 4 amino acids of the sequence, in turn. The
output of the prediction is thus, given a sequence of
size L amino acids, a profile of dimension L− 3∗ 27.
2.3.2 Fragment Assembly to Generate a Full
Structure Model
We do not use a continuous space to generate the 3D
models. Each SA state is associated with a limited
number of representative fragments - or prototypes -
that have been chosen to sample the conformational
variability of the letter. The number of prototypes as-
sociated with the letters depends on their conforma-
tional variability. In practice, we limit this number to
a maximum of three except for one letter particularly
fuzzy for which we allow up to eight prototypes.
The selection of the SA letters considered at each
position - see next section - and their prototypes de-
fines a finite ensemble of conformations of the com-
plete peptide. The size of this space can be measured
in terms of complexity. According to the convention
set by Park and Levitt (Park and Levitt, 1995), the
complexity - the average number of states per residue
- for a peptide of size L, i.e. consisting of L − 3
fragments of 4 residue length, can be expressed as:
L
q
∏
L−3
i=1
n
i
, with n
i
the possible conformations at each
position i.
Despite we use a limited number of prototypes
for each fragment, and despite we prune the number
of SA letters using a fragment selection strategy, the
combinatorial to sample is yet too large to be sam-
pled using brute force strategy. We use the stochastic
greedy approach considered in our previous studies
(Tuffery et al., 2005). We use a rigid assembly proce-
dure in which the three first alpha carbon of the next
fragment are superimposed onto the last three of the
previous one using a best fit RMSD procedure - see
(Tuffery et al., 2005). Given a set of conformations
generated for fragments of size L − 3 − x − 1 amino
acids, where L − 3 stands for the L − 3 letters nec-
essary to describe the conformation of the L amino
acids of the peptide, the procedure generates all the
conformations of size L− 3− x by adding all the pro-
totypes of the SA letters accepted to grow the peptide
by one amino acid. Since this number can be large, we
limit the number of conformations to a maximal num-
ber - heap size - of conformations that correspond to
a combination of the best scored conformations and
conformations randomly selected using the Metropo-
lis criterion. Since the approach has some stochastic
aspects, we perform series of runs.
2.3.3 Fragment Selection Strategies
Best Ranked SA Letters (8BR). In our previous
studies, we have considered the assembly of the frag-
ments associated with the eight best ranked SA let-
ters, based on the predicted probabilities. Based on
this selection, we have performed series of one hun-
dred runs per peptide (see previous section). This ap-
proach has shown successful to the de novo prediction
of the structure of peptide of size up to 25 amino acids
(Maupetit et al., 2010).
BIOINFORMATICS2014-InternationalConferenceonBioinformaticsModels,MethodsandAlgorithms
26

Sampling the Sub-optimal Sequences of State (S4).
Another selection strategy can be specified using
HMM formalism. Given the prior observations of the
sequence, one can derive the probabilities that each
letter is associated with each fragment along the pep-
tide sequence (see upper), independently. Such prob-
abilities can be assimilated to the initial laws of the
HMM model, and can be used to infer the most prob-
able series of letters associated with the amino acid
sequence using the Viterbi algorithm or the Forward-
Backward algorithm to select the most probable state
at each position. Unfortunately, the uncertainty and
error associated with the prediction from the amino
acid sequence make unlikely that the optimal series of
letters derived using either the Viterbi or the Forward-
Backward algorithm can describe the native confor-
mation (see (Maupetit et al., 2010)). Ways to ex-
plore sub-optimal sequences of states are thus desir-
able. The generalized Viterbi algorithm (Foreman,
1992) that precisely determines the k−best sequences
of states is confronted to the limit of a possibly very
large number of sequences to explore to reach the na-
tive conformation, most of them being associated with
small conformational changes, making its computa-
tional cost prohibitive and not efficient. For this rea-
son, we have chosen to explore an alternative proce-
dure that performs a Sampling of the Sub-optimal Se-
quences of States (S4 procedure). We note Sopt and
Ssubopt the optimal sequence and the sub optimal se-
quences of states, respectively. These are identified
using in a iterated manner the Viterbi algorithm start-
ing from the initial laws P
1..L−3
using the following
procedure:
input initial laws P
1..L−3
identify Sopt
1..L−3
(Viterbi)
for n suboptimal sequences do:
randomly select position k in sequence
randomly select state s not already present in a previous se-
quence of states
set P[k][l
i6=s
] = 0. then P[k][s] = 1.
identify Ssubopt
n
1..L−3
(Viterbi)
restore P[k] to its initial values
enddo
We have found such procedure allows a fast sam-
pling of the sub-optimal conformations, while ensur-
ing a diversity of the conformational sampling. For
each sequence of states, we then apply the greedy al-
gorithm. Since only one state is accepted at each posi-
tion, the complexity of the search is reduced to the use
of the prototypes of the letters. In the present study,
we have considered up to 400 sub-optimal sequences
of states.
2.3.4 Force Field
To drive the generation of the model during the as-
sembly, we use the sOPEP force field (Maupetit et al.,
2007). sOPEP is a coarse grained force field that al-
lows a fast, yet accurate evaluation of the energies. It
has been adapted from the OPEP3.2 force field de-
signed for molecular dynamics in cartesian coordi-
nates. Like OPEP, sOPEP makes use of a six bead
representation per residue. Five are for the backbone
- one for each atom of the backbone but the alpha car-
bon hydrogen, and one for the side chain. sOPEP spe-
cific terms are related to side chain-side chain interac-
tions. Since PEP-FOLD is based on the rigid assem-
bly of a limited number of prototype fragments sam-
pling the conformational variability of each SA let-
ter, the OPEP formulation using a 6-12 potential was
found too sharp and has been adapted (see (Maupetit
et al., 2007)). sOPEP has been optimized for solu-
ble peptides, at pH 7 and for the 20 standards amino
acids. Ions are presently not considered.
2.3.5 Clustering
To clusterize the ensembles of models generated we
use a procedure using the TMscore to score the simi-
larity, similarly to our previous work (Maupetit et al.,
2010). The clusters are sorted by increasing energy
according to sOPEP. The centroid of the cluster is the
conformation associated with the lowest energy.
2.4 PepStr and PepLook Models
Results presented for PepStr (Kaur et al., 2007)
and PepLook (Thomas et al., 2009) are based on
the models returned by the servers available at
http://www.imtech.res.in/raghava/pepstr/ and http://
peplook.gembloux.ulg.ac.be/, respectively. Note that
the PepStr and PepLook server identify only one best
preferred conformation.
3 RESULTS AND DISCUSSION
We first discuss the ability of the S4 approach to iden-
tify native like conformations. Table 1 reports the re-
sults obtained for the peptides of the PepStr set. The
BestEne5 section reports the results reached when
considering the cluster of lowest energy for each se-
ries of runs, i.e. corresponding to the solution of low-
est energy. These values can be compared with those
obtained using PepStr of PepLook. The BestRMSD5
section reports the best results that could be reached
considering the five clusters of lowest energy, i.e. the
ExploringaSub-optimalHiddenMarkovModelSamplingApproachforDeNovoPeptideStructureModeling
27

Table 1: Results obtained with the S4 procedure for the peptides of the PepStr set. L: peptide size (amino acids), C
8
:
complexity of the assembly using the 8BR procedure, C
S4
: complexity of the assembly using the S4 procedure (average
number of conformations per position), µ and σ correspond to the mean and standard deviation of the RMSD (full structure)
to the experimental conformation over 4 series of 100 runs. ∆ denotes if the RMSD is smaller (-) or greater (+) compared to the
results obtained with the 8BR procedure. Number in parentheses correspond to the values obtained using the 8BR procedure,
taken from (Maupetit et al., 2010). BestEne5 results are related to the conformation of lowest energy. BestRMSD5 results
are related to the centroid of the 5 best clusters approximating at best the experimental conformation. PepStr and PepLook:
RMSD to the experimental conformation of the models returned by the servers.
RMSD BestEne5 BestRMSD5 RMSD
Id L C
8
C
S4
µ σ µ σ ∆ µ σ µ ∆ PepStr PepLook
1a13 14 12.0 1.3 2.3 0.1 2.3 (1.8) 0.1 + 2.3 (1.8) 0.1 1.0 + 2.5 2.8
1b03A 18 20.6 2.5 2.5 0.1 2.9 (2.0) 0.3 + 2.8 (2.0) 0.2 2.5 + 8.8 10.1
1du1 20 14.3 1.1 5.1 0.1 5.2 (5.1) 0.0 + 5.1 (5.3) 0.1 1.8 - 5.0 4.9
1e0q 17 16.3 2.3 0.9 0.2 2.0 (4.7) 0.3 - 1.2 (4.5) 0.2 3.3 - 7.1 7.2
1egs 9 11.0 2.9 1.6 0.5 2.4 (1.5) 0.8 + 2.1 (1.5) 0.6 3.3 + 3.8 4.5
1gjf 14 14.2 2.0 2.0 0.3 2.4 (2.5) 0.2 - 2.0 (2.5) 0.3 1.8 - 3.9 4.6
1in3 12 10.1 1.3 2.3 0.0 2.4 (2.5) 0.0 - 2.3 (2.3) 0.0 2.0 - 4.2 3.9
1l2y 20 23.2 2.0 1.4 0.1 3.7 (2.1) 0.6 + 2.4 (2.1) 0.2 3.8 + 4.8 6.7
1l3q 12 15.1 2.6 2.5 0.1 3.9 (3.3) 0.4 + 3.3 (3.4) 0.2 4.0 - 4.3 5.7
1lcx 13 11.1 1.4 2.8 0.0 2.8 (2.8) 0.0 - 2.8 (2.8) 0.0 1.0 - 2.8 3.2
1niz 14 16.3 2.7 1.1 3.0 2.0 (2.1) 0.2 - 1.8 (1.5) 0.3 5.0 + 4.8 7.9
1nkf 16 16.3 1.8 1.9 0.1 5.5 (4.3) 0.4 + 4.4 (4.3) 0.2 2.8 + 3.6 6.1
1pef 18 13.1 1.0 0.8 0.1 0.8 (0.9) 0.1 - 0.8 (1.0) 0.0 1.3 - 1.3 0.9
1rpv 17 12.8 1.1 1.5 0.0 1.6 (0.6) 0.0 + 1.5 (0.7) 0.0 4.3 + 4.2 3.2
2bta 15 13.0 1.4 4.5 0.0 4.6 (4.5) 0.0 + 4.5 (4.5) 0.0 2.5 + 4.1 4.1
mean 15.3 14.6 1.9 2.2 0.3 2.8 (2.7) 0.2 2.6 (2.7) 0.2 2.6 4.3 5.1
lowest RMSD among the centroids of the 5 best clus-
ters. The ∆ values report how the results compare
with our previous results (Maupetit et al., 2010), con-
sidering series of 100 runs. The size of the series to
consider has been tested using a Wilcoxon test and
we have found that there is no significant difference
between the two strategies considering series of size
equal or more than 100 runs. The RMSD section re-
ports information about the best RMSD reached accu-
mulating all the series of simulations - a total of 400
models. A first result is the effectiveness of the S4
procedure. Overall, the procedure gives results com-
parable to those obtained with the 8BR strategy. The
average RMSD of the conformations of lowest energy
is of 2.8, when it was of 2.7 using the 8BR selection.
A similar observation is made looking, over the five
best clusters, at the centroid having the lowest RMSD
with the experimental structure (2.6 vs 2.7). These
values do not, on average, deviate much from the best
conformation - RMSD section - generated among the
simulations. The largest deviations between the two
procedures are observed for 1e0q (improvement by
2.7
˚
A) and 1l2y (decrease by 1.6
˚
A). However, as il-
lustrated in Figure 2, the native topology of the pep-
tides is identified in both cases. For 1l2y, a native like
solution is proposed in the five best clusters. A last
observation from Table 1 is that the reproducibility of
the S4 procedure seems good, as illustrated by the low
values of the standard deviations.
Looking at the efficiency of the two strategies, it
is striking that the S4 performance is reached consid-
ering a very low number of sub-optimal sequences of
states. Indeed, the part of the conformational space
sampled by the S4 procedure is several order of mag-
nitudes smaller than that sampled by the best ranks
procedure. As shown Table 1, the gain in terms of
complexity is important, the difference being close to
13 on average. Note that the values of the complex-
ity can be misleading since for instance considering 3
conformation at each position results, for a peptide of
twenty amino acids in a complexity of 2.5. It also de-
pends on the size. The corresponding number for 100
amino acids would be of 2.9. However, on average,
for a peptide of size 20 amino acids, the difference in
complexity results in decreasing the number of con-
formations sampled during the assembly process from
over 6 10
19
down to only 5.4 10
4
, i.e. a gain of 15 or-
ders of magnitude. Considering why such dramatic
decrease in the conformational sampling can still lead
to the effective identification of native conformations,
it seems obvious it necessarily implies that the ini-
tial laws resulting from the SVM prediction are al-
ready biased towards the correct local conformations
of the fragments along the complete sequence. It ap-
pears sufficient to efficiently sample the low confor-
mations of low energy resulting form the SVM pre-
diction. However, the efficiency of the modeling also
relies on the effectiveness of the force field. Actually,
BIOINFORMATICS2014-InternationalConferenceonBioinformaticsModels,MethodsandAlgorithms
28
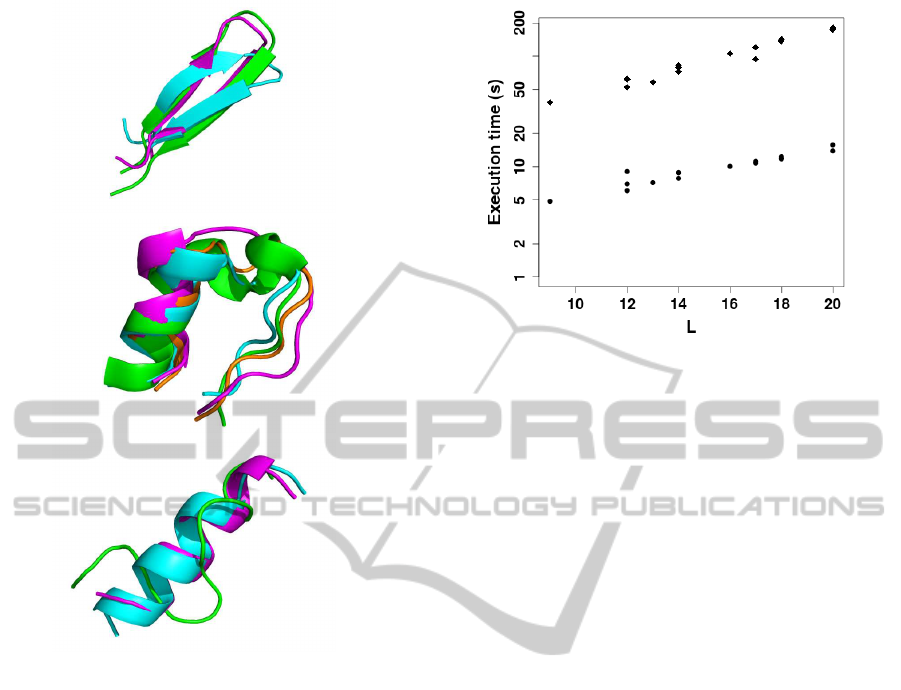
Figure 2: Bests models constructed using the 8BR (cyan)
and S4 (magenta) strategies compared to native structure
(green). From top to bottom: 1e0q, 1l2y and 2bta targets.
For 1l2y, the model depicted in orange corresponds to the
best model over the 5 best clusters.
as illustrated in Figure 2, the S4 procedure does not
solve the poor modeling obtained for the 2bta target
using the best ranks approach. Indeed, for this target,
the SVM prediction makes likely non helical confor-
mations that are not identified. The same behavior is
observed for 1du1 (not shown). Accepting the current
limits of the coarse grained force field it remains the
S4 procedure appears much more efficient than the
8BR strategy.
An important outcome of S4 is in terms of com-
putational cost. As illustrated in Figure 3, the execu-
tion times to generate the models of peptides up to 20
amino acids are of only a few seconds per simulation,
compared to several minutes using the 8 best ranks
strategy. On average, execution times are on the order
of 10 times faster using S4, and close to 14 seconds
for a peptide of 20 amino acids. On the opposite to
the best ranks approach, it is also noteworthy that the
S4 procedure can be easily paralleled, since it consists
in series of independent simulations. This makes the
simulation of peptide conformation given the SA pre-
Figure 3: Execution times (seconds) per run - Logarithmic
scale - as a function of peptide size (L) in amino acids. Di-
amonds: 8 best ranks procedure. Circles: S4 procedure.
diction profile easily tractable on a desktop machine.
For instance using a 8 cores machines, a series of 100
simulations for the modeling of a peptide of 20 amino
acids would require on the order of only 3 minutes.
This clearly opens the door to the large scale de novo
modeling of peptides since the complete processing
from sequence can be as low as five minutes. On
a medium size computational resource of 400 cores,
it would become possible to process as many as 24
000 peptide sequence of 20 amino acids per day, and
2 400 000 in 100 days. Such order of magnitude is
compatible with estimates of the number of candidate
peptides in the complete set of prokaryotic genomes
(Kastenmayer et al., 2006).
4 CONCLUSIONS
In the present study, we have explored a new proce-
dure for the de novo modeling of peptide structure. It
is based on the sampling of the sub optimal sequence
of states using a Hidden Markov Model. Using a test
set of 15 peptides of size between 9 and 20 amino
acids, our results show that it is able to identify the
native conformation of the peptides at a success rate
comparable to a much more resource consuming pro-
cedure previously benchmarked. The complexity of
this procedure is much lower, and it requires the gen-
eration of as few as only one hundred models, which
makes possible the de novo generation of models in
only a few minutes on a desktop computer. Having
addressed an important issue in terms of our ability to
model large quantities of peptide structure, we still re-
main confronted with other limits of the de novo pre-
diction of structures, such as the effectiveness of the
force field, or the exactness of the prediction of the lo-
ExploringaSub-optimalHiddenMarkovModelSamplingApproachforDeNovoPeptideStructureModeling
29

cal structure underlying the approach. It remains that
such procedure now makes tractable the processing of
peptide sequence at a scale compatible with the out-
come of the complete genome sequencing projects,
which should open new opportunities in terms of the
discovery of bioactive peptides.
REFERENCES
Altschul, S. F., Madden, T. L., Sch¨affer, A. A., Zhang,
J., Zhang, Z., Miller, W., and Lipman, D. J. (1997).
Gapped BLAST and PSI-BLAST: a new generation
of protein database search programs. Nucleic Acids
Res, 25(17):3389–402.
Camproux, A., Gautier, R., and Tuff´ery, P. (2004). A hid-
den Markov model derived structural alphabet for pro-
teins. J. Mol. Biol., 339:591–605.
Escoubas, P. and King, G. F. (2009). Venomics as a drug
discovery platform. Expert Review of Proteomics,
6(3):221–224.
Etchebest, C., Benros, C., Hazout, S., and de Brevern, A. G.
(2005). A structural alphabet for local protein struc-
tures: Improved prediction methods. Proteins: Struc-
ture, Function, and Bioinformatics, 59(4):810–827.
Foreman, L. (1992). Generalisation of the Viterbi algo-
rithm. IMA J. Management Math., 4:351–367.
Gellman, S. and Woolfson, D. (2002). Mini-proteins trp the
light fantastic. Nature Structal Biology, 9:408–410.
Hobbs, E., Fontaine, F., Yin, X., and Storz, G. (2011). An
expanding universe of small proteins. Current Opin-
ion in Microbiology, 14:167–173.
Jones, D. (1999). Protein secondary structure prediction
based on position-specific scoring matrices. J. Mol.
Biol., 292:195–202.
Kastenmayer, J. P., Ni, L., Chu, A., Kitchen, L. E., Au, W.-
C., Yang, H., Carter, C. D., Wheeler, D., Davis, R. W.,
Boeke, J. D., Snyder, M. A., and Basrai, M. A. (2006).
Functional genomics of genes withsmall open reading
frames (sORFs) in S. cerevisiae. Genome Research,
16(3):365–373.
Kaur, H., Garg, A., and Raghava, G. (2007). PEPstr: A de
novo method for tertiary structure prediction of small
bioactive peptides. Protein Pept Lett., 14:626–630.
Li, Y. and Zhang, Y. (2009). REMO: A new protocol to
refine full atomic protein models from C-alpha traces
by optimizing hydrogen-bonding networks. Proteins:
Structure, Function, and Bioinformatics, 76(3):665–
676.
Lins, L., Charloteaux, B., Heinen, C., Thomas, A., and
Brasseur, R. (2006). “De Novo” Design of Peptides
with Specific Lipid-Binding Properties. Biophysical
Journal, 90(2):470–479.
Malavolta, L. and Cabral, F. (2011). Peptides: important
tools for the treatment of central nervous system dis-
orders. Neutopeptides, 45:309–316.
Maupetit, J., Derreumaux, P., and Tuff´ery, P. (2009). PEP-
FOLD: an online resource for de novo peptide struc-
ture prediction. Journal of Computational Chemistry,
31:726–738.
Maupetit, J., Derreumaux, P., and Tuff´ery, P. (2010). A fast
method for large-scale de novo peptide and minipro-
tein structure prediction. J Comput Chem, 31(4):726–
38.
Maupetit, J., Tuff´ery, P., and Derreumaux, P. (2007). A
coarse-grained protein force field for folding and
structure prediction. Proteins, 69:394–408.
Park, B. and Levitt, M. (1995). The complexity and accu-
racy of discrete state models of protein structure. J.
Mol. Biol., 249:493–507.
Rabiner, L. (1989). A Tutorial on Hidden Markov Mod-
els and Selected Applications in Speech Recognition.
Proceedings of the IEEE, 77:257–286.
Rohl, C., Strauss, C., Misura, K., and Baker, D. (2004).
Protein structure prediction using Rosetta. Methods in
Enzymology, 383:66–69.
Suzek, B., Huang, H., McGarvey, P., Mazumder, R., and
Wu, C. (2007). UniRef: Comprehensive and Non-
Redundant UniProt Reference Clusters. Bioinformat-
ics, 23:1282–1288.
Th´evenet, P., Shen, Y., Maupetit, J., Guyon, F., Der-
reumaux, P., and Tuff´ery, P. (2012). PEP-FOLD: an
updated de novo structure prediction server for both
linear and disulfide bonded cyclic peptides. Nucleic
Acids Res., 40(Web Server issue):W288–93.
Thomas, A., Deshayes, S., Decaffmeyer, M., Eyck, M. V.,
Charloteaux, B., and Brasseur, R. (2009). PepLook:
an innovative in silico tool for determination of struc-
ture, polymorphism and stability of peptides. Adv Exp
Med Biol., 611:459–460.
Thomas, A., Deshayes, S., Decaffmeyer, M., Van Eyck,
M. H., Charloteaux, B., and Brasseur, R. (2006).
Prediction of peptide structure: How far are we?
Proteins: Structure, Function, and Bioinformatics,
65(4):889–897.
Tuffery, P., Guyon, F., and Derreumaux, P. (2005). Im-
proved greedy algorithm for protein structure recon-
struction. J Comput Chem, 26(5):506–13.
Vetter, I., Davis, J., L.D.Rash, Anangi, R., Mobli, M., Ale-
wood, P., Lewis, R., and King, G. (2011). Venomics:
a new paradigm for natural products-based drug dis-
covery. Amino Acids, 40:15–28.
Viterbi, A. (1967). Error bounds for convolutional codes.
IEEE Trans. Inform. Theory, 13:260–269.
Vlieghe, P., Lisowski, V., Martinez, J., and Khrestchatisky,
M. (2010). Systhetic therapeutic peptides: science and
market. Drug Discovery Today, 15:40–56.
Warren, A. S., Archuleta, J. S., chun Feng, W., and Se-
tubal, J. C. (2010). Missing genes in the annotation of
prokaryotic genomes. BMC Bioinformatics, 11:131.
Wu, S. and Zhang, Y. (2007). LOMETS: A local meta-
threading-server for protein structure prediction. Nu-
cleic Acids Research, 35(10):3375–3382.
Zhang, Y. (2008). I-TASSER server for protein 3D structure
prediction. BMC Bioinformatics, 9(1):40.
Zhang, Y. and Skolnick, J. (2004). SPICKER: A clustering
approach to identify near-native protein folds. Journal
of Computational Chemistry, 25(6):865–871.
BIOINFORMATICS2014-InternationalConferenceonBioinformaticsModels,MethodsandAlgorithms
30
