
Noninvasive Glucose Monitoring by Mid-infrared
Self-emission Method
Yen-Chun Yeh, Sheng Yang, Fan Zhao and Dominik Schmidt
Department of Electrical Engineering, International Technological University, San Jose, CA, U.S.A.
Keywords: Non-invasive Glucose Monitoring, Mid-infrared Self-emission, Skin Glucose, Blood Glucose.
Abstract: In this article we present a non-invasive glucose monitoring technique by measuring human body mid-
infrared self-emission. The human body is a black body radiator that provides a stable temperature and
infrared radiation; thus the human body is considered a continuous radiation energy source in the mid-
infrared range. The fingerprint spectrum of glucose shows strong peaks between 8.5 m to 10.4 m,
therefore, measuring the self-emission form human body in the mid-infrared range allows estimation of
glucose concentration. Using a simple and miniaturizable design with a tunable Fabry-Perot filter (FPF) and
a thermal detector, glucose concentration can be measured through the human skin.
1 INTRODUCTION
It has been decades since blood glucose monitoring
techniques were introduced for diabetes patients to
help them with daily management of diabetes
treatments, including diet control, oral medication
and insulin injection. The traditional measurement of
blood glucose concentration requires the patients to
stab themselves in the finger with a needle to extract
the blood to the skin surface so that the blood can be
collected for enzymatic reaction and analysis.
However, in the past decade, the desire to avoid the
pain resulting from the puncture and to realize
continuous blood glucose monitoring has driven
research in a variety of non-invasive glucose sensing
techniques. The non-invasive glucose monitoring
techniques can be classified into two different types,
transdermal (Rao, 1993; Volden, 1980; Gebhardt,
2001) and optical (Shen, 2003; Nelson, 2006;
Enejder, 2005). The main idea of transdermal
glucose sensing techniques is to extract the glucose
from the interstitial fluid to the outer surface of the
skin, where the glucose will be collected and
analyzed by a traditional glucose sensor. The
popular transdermal techniques include reverse
iontophoresis, sonophoresis and skin suction blister
technique (Kost, 2000.). Essentially, the key point of
these methods lies in the different approaches to
collect the glucose. The technique used to identify
and quantify glucose remains the same, which is
based on enzymes. By contrast, the optical methods
aim at identifying the unique spectral signature of
glucose and exploring the best way to calibrate and
quantify optical measurements. Due to the noise
coming from the skin, both SNR and sensitivity are
affected. A significant advantage of this system is
not requiring an enzyme replacement.
Non-invasive optical glucose monitoring
methods basically include three different techniques
to measure glucose in the infrared region. Of the
three methods, near-infrared (NIR) (Nelson, 2006)
spectroscopy, mid-infrared (MIR) (Shen, 2003)
spectroscopy, Raman spectroscopy (Enejder, 2005),
only MIR spectroscopy can measure glucose without
a light source. Because the human body is an
excellent black body, it will cause heat emission in
the MIR wavelength range. Therefore, self-emission
from the human body can generate good target
glucose spectra, and enable an easy to measure
glucose concentration in the human body. In the
mid-IR, glucose has a stronger absorption than most
other chemicals, and if avoids most of the water
signal peaks. Also, using the MIR method can avoid
the use of high-energy light sources on the skin,
which can cause burns. Furthermore, these
advantages facilitate the implementation of the non-
invasive system on a single microelectromechanical
system (MEMS) chip, which is our long-term goal.
Therefore, we chose to use thermal emission
spectroscopy as our scheme to realize a non-invasive
glucose sensor. The most significant advantage is
107
Yeh Y., Yang S., Zhao F. and Schmidt D..
Noninvasive Glucose Monitoring by Mid-infrared Self-emission Method.
DOI: 10.5220/0004750101070111
In Proceedings of the International Conference on Biomedical Electronics and Devices (BIODEVICES-2014), pages 107-111
ISBN: 978-989-758-013-0
Copyright
c
2014 SCITEPRESS (Science and Technology Publications, Lda.)
the relative simplicity of the system, which does not
require a light and is relative to fabricate.
2 EXPERIMENTAL
The principle of the glucose measurement device is
that the human body emits strong mid-infrared
(MIR) radiation and some of the chemical molecules
in the human body would cause the distinct
absorption at their characteristic peaks (Vonach,
1998). The human body is essentially a black body
that emits MIR radiation. According to Planck’s law
(Planck, 1991), we know the relationship between
temperature and intensity of radiation. Glucose
molecules have strong characteristic peaks in both
near-infrared (NIR) and mid-infrared (MIR)
spectrum (Carl, 2002). However, the glucose
radiation can only be measured by human body self-
emission in the MIR region, at least without a strong
light source. Also, the glucose IR spectra can avoid
the strong water signal from human body in MIR
range rather than NIR range.
The main application of the device is a
measurement of the glucose MIR radiation from the
self-emission of the human body. Due to the
vibration of the glucose chemical bond, the molecule
would cause absorption or emission of radiant
energy. Therefore, a molecule such as glucose would
form several distinct peaks in the MIR spectra
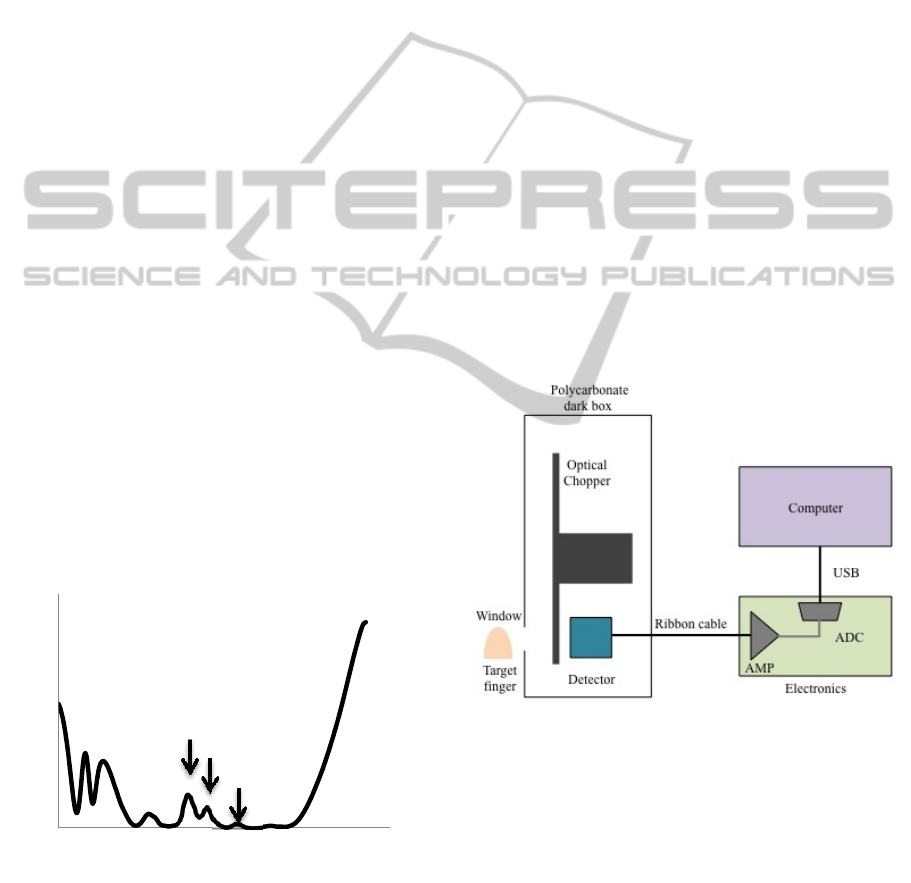
between 8.5 m and 10.5 m. Figure 1 shows that
the IR spectra of D-glucose in a potassium bromide
(KBr) sample, which was measured by FTIR
spectroscopy (Shumadzu FTIR 8900).
Figure 1: D-glucose spectrum that were measured by FTIR
spectroscopy in a KBr sample. The spectra show the
characteristic peaks between 8 m to 10.5 m.
According to Fig 1, we can recognize the
characteristic peaks of glucose at 9.2 m, 9.3 m,
and 9.6 m. By measuring the distinct peaks from
human body self-emission, the relationship between
MIR radiation at the special wavelength and glucose
concentration can be obtained.
The targets were the men whose age ranged
between 25 to 27 years old and no diabetes history.
Blood glucose measurements started before the
target had a meal and continued measuring the
glucose concentration every 20 minutes. After the
target had a meal, the glucose concentration started
to increase, and we measured the glucose
concentration continuously until the glucose
concentration decreased and become stable. Every
measurement test was done by both the non-invasive
self-emission measurement system (Fabry-Perot
filter system) and the invasive blood test. The
Bayer’s Contour Next meter was used to measure
the glucose concentration by stabbing target’s finger
for getting blood and measuring the glucose on the
chemical strip. The results of the blood invasive
measurement were taken as the reference blood
concentrations.
The self-emission detector system was built up
as shown in Fig 2. The detector was a pyro-electric
thermal detector combined with a tunable Fabry-
Figure 2: Schematic of the Fabry- Perot filter with system.
Perot filter (FPF), which was made by InfraTec
(LFP-80105-337). The tunable Fabry-Perot filter is a
microelectromechanical system (MEMS) optical
filter, and the scanning range was from 8 m to 10.1
m. The detectivity and the noise density of the
pyro-electric thermal detector are 3.7x10
8
cm(sqrt[Hz])/W and 75 V/(sqrt[Hz]), respectively.
The detectivity and the noise density of the whole
sensor are 3x10
6
cm(sqrt[Hz])/W and 75
V/(sqrt[Hz]), respectively. The electronics are
purchased from InfraTec for processing the signal
0
1
2
3
4
5
6
7
8
8 9 10 11
Intensity [a.u.]
Wavelength [m]
9.2 m
9.3 m
9.6 m
BIODEVICES2014-InternationalConferenceonBiomedicalElectronicsandDevices
108
and transferring to the computer. The schematic is
shown in Fig. 3. The aperture diameter size of the
sensor was 1.9 mm, and there was a hole on the
polycarbonate black box, which is aligned with
fitting finger the aperture of the sensor. This hole is
used for positioning the target’s finger putting
target’s finger and fixes the position of target.
Since the pyro-electric thermal detector is
measuring the temperature difference, the detector
can only measure an absolute temperature change.
To measure stable IR radiation, an optical chopper
(Stanford research system SR 540) was connected
with the pyro-electric thermal detector to measure
the IR radiation continuously.
The background signal was subtracted from the
intensity result before the averaging process. The
intensity results were plotted against the real time
blood test result to establish a relationship.
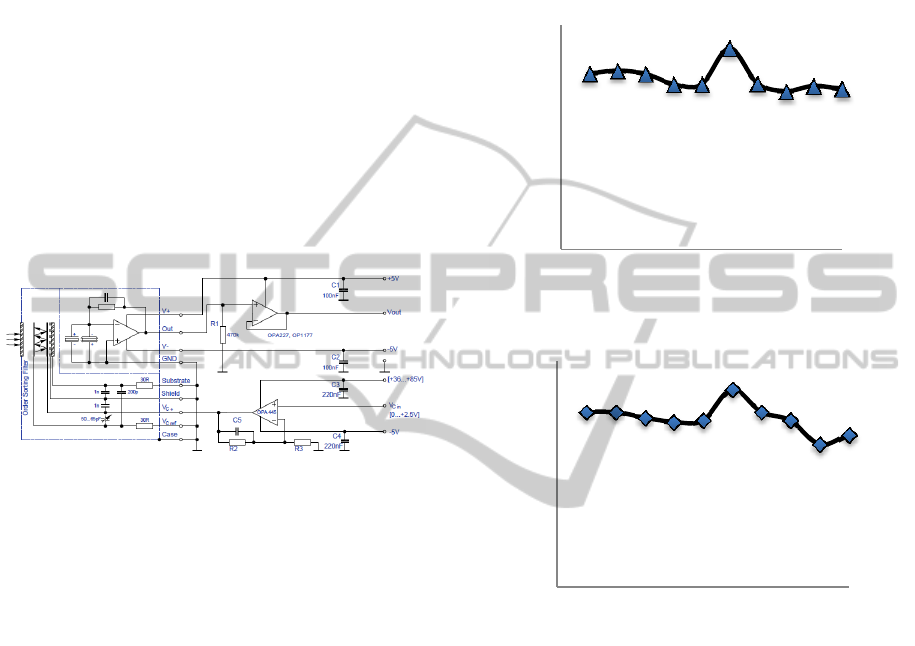
Figure 3: Schematic of the electronics part (InfraTec,
2013).
3 RESULT AND DISCUSSION
The target had their blood glucose concentration
measured every 20 minutes in 200 minutes and had a
meal during the experiment. After having the meal,
the target’s blood glucose concentration increased,
and then decreased with time as shown in Fig 2. The
main band at 9.3 m was used as the detection
characteristic peak from infrared self-emission
measurement by FPF system. Figure 4 (a) shows the
blood glucose measurement result by detecting the
self-emission from target’s finger skin. The
concentration change had almost the same tendency
as the measurement result by blood test meter (Fig 4
(b)).
The highest blood glucose concentration was
143.2 mg/dl that measured by FPF system, and the
same point related to 140 mg/dl that was measured
by blood glucose meter. The first point and the last
point measured by the FPF system were 125.4 mg/dl
and 114.3 mg/dl, and related to 124 mg/dl and 108
mg/dl in blood glucose test, respectively.
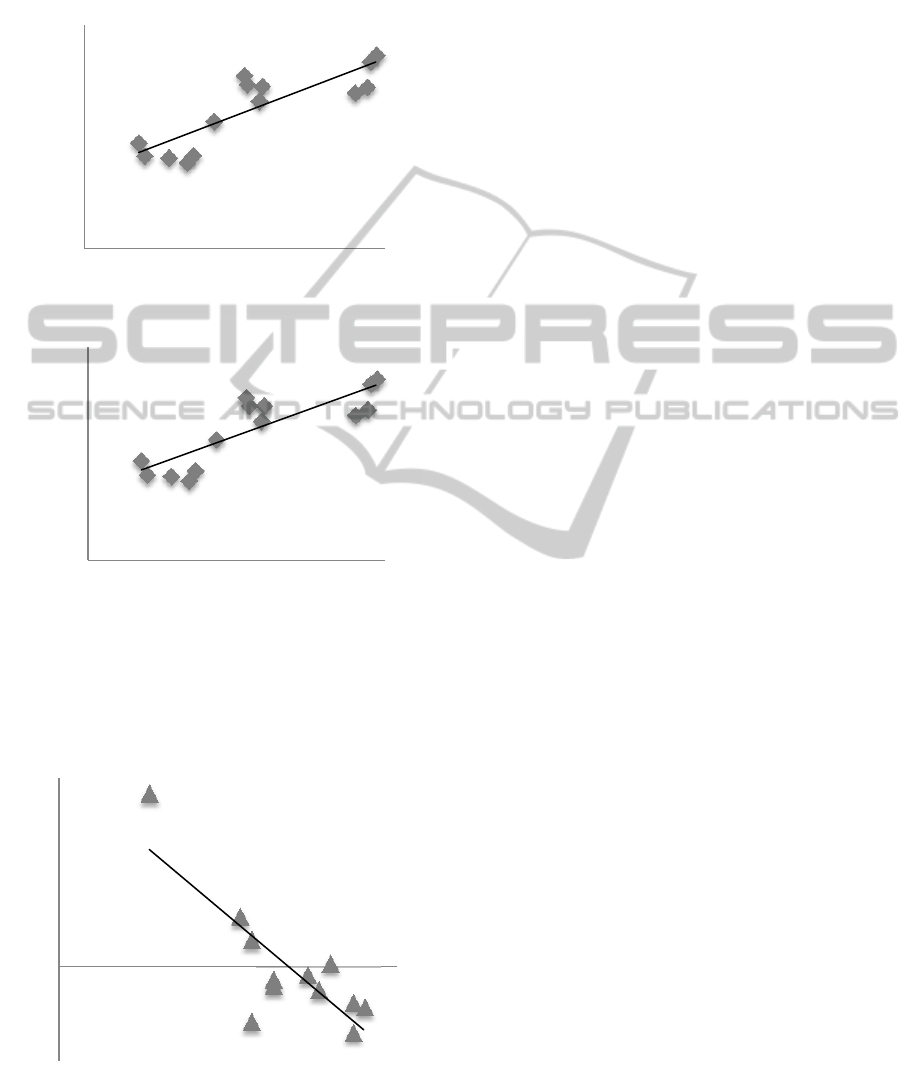
The relationship between the intensity of the
target’s infrared radiation and real blood glucose
concentration is shown in Fig 5. The measurement
took the blood glucose concentration from 108
mg/dl to 187 mg/dl by measuring a target person
who was just having a meal. Figure 5 (a) and (b)
(a)
(b)
Figure 4: Continuous blood glucose concentration test
result by different two methods. (a) Continuous glucose
monitoring by FPF system. Measured the glucose
concentration by detecting the skin of the target’s finger
by the FPF system. (b) Continuous glucose monitoring by
the blood test meter in 200 minutes. Measured the glucose
concentration by stabbing target’s finger to get the blood
and measuring by Bayer’s Contour meter.
shows the measurement of the band at 9.3 m and
8.9 m. The equation of the trend lines was y =
0.171x - 3.8144 and y = 0.1759x - 4.1653, and the
R
2
value of the trend line was 0.723 and 0.712
individually, thus it showed the correlation between
infrared radiation and glucose concentration in
human body. However, the accuracy of the FPF
system still needs to be improved. The body
temperature and the ambient temperature caused a
part of the error, and that was because the detected
0
20
40
60
80
100
120
140
160
0100200
Glucose concentration [mg/dl]
Time [min]
0
20
40
60
80
100
120
140
160
0100200
Glucose concentration [mg/dl]
Time [min]
NoninvasiveGlucoseMonitoringbyMid-infraredSelf-emissionMethod
109
0
5
10
15
20
25
30
35
90 140 190
Intensity [a.u.]
Glucose concentration [mg/dl]
0
5
10
15
20
25
30
35
90 140 190
Intensity [a.u.]
Glucose concentration [mg/dl]
signal was affected by heat from surrounding
materials.
According to Plank’s law, the infrared radiation
and the temperature are related. One of the
(a)
(b)
Figure 5: Calibration curve of intensity signal versus blood
glucose concentration. (a) Measuring the band at 9.3 m,
and the R
2
value of the trend line is 0.723. (b) Measuring
the band at 8.9 m, and the R
2
value of the trend line is
0.712.
Figure 6: Temperature effect. The relation difference value
and the temperature of target’s skin.
conditions that affects the self-emission
measurement is the temperature of the target’s skin.
The more difference between the trend line (trend
line of intensity vs. glucose concentration) and each
measurement point would be located in a lower
temperature region (temperature was measured by a
thermopile). The relationship between the
temperature and the difference value is shown in
Fig. 6, and the R
2
value is 0.664. The next step for
improving the relationship between the intensity of
the target’s infrared radiation and real blood glucose
concentration is temperature effect elimination
through improved temperature calibration. Also the
materials surrounding the target need to have a low
thermal mass so they don’t affect the target
temperature.
4 CONCLUSIONS
The Fabry-Perot filter (FPF) system can measure the
mid-infrared radiation from the human body without
an external light source. By measuring the distinct
band from the self-emission of the human body, the
blood glucose concentration can be monitored. This
non-invasive glucose measurement system allows
patients to avoid the pain from stabbing their skin
when they monitor their blood glucose
concentration. However, the system still needs to
calibrate several effects, such as the body
temperature and ambient temperature. All the
components in our setup can be fabricated on a little
chip with a microelectromechanical system
(MEMS). Our final goal is to use this concept to
build a complete non-invasive glucose monitor on a
1 x 1 cm chip.
REFERENCES
Rao, G., 1993. Reverse iontophoresis: development of a
non-invasive approach for glucose monitoring, Pharm
Res, 10, 1751–1755.
Volden, G., 1980. Biochemical composition of suction
blister determined by high resolution multicomponent
analysis (capillary gas chromatography-mass
spectrometry and two-dimensional electrophoresis),J
Invest Dermatol, 75, 421–424.
Gebhardt, S., 2001. Glucose sensing in transdermal body
fluid collected under continuous vacuum pressure via
micropores in the stratum corneum. Diabetes Technol
Ther , 3, 81–90.
Shen, Y.C., 2003. The use of Fournier-transform infrared
spectroscopy for the quantitative determination of
‐3
‐2
‐1
0
1
2
3
4
5
6
30 31 32 33
Difference value
Temperature [
o
C]
BIODEVICES2014-InternationalConferenceonBiomedicalElectronicsandDevices
110

glucose concentration in whole blood. Phys Med Biol,
48, 2023–2032.
Nelson, L.A., 2006. Development and validation of a
multiwavelength spatial domain near-infrared
oximeter to detect cerebral hypoxia–ischemia. J
Biomed Opt, 11, 064022.
Enejder, A., 2005. Raman spectroscopy for non-invasive
glucose measurements. J Biomed Optics,10, 031114.
Kost, J., 2000. Transdermal monitoring of glucose and
other analytes using ultrasound. Nat Med, 6, 347–350.
Vonach, R., 1998. Application of mid-infrared
transmission spectrometry to the direct determination
of glucose in whole blood. Applied Spectroscopy, 52,
820–822.
Planck, M., 1991. The Theory of Heat Radiation. Dover
Publications.
Carl, D., 2002. A novel noninvasive blood glucose
monitor, Diabetes Care, 25, 2668-2275.
InfraTec, 2013. LFP-80105-337, Catalog, 85.
NoninvasiveGlucoseMonitoringbyMid-infraredSelf-emissionMethod
111
