
Mapping Membrane Topology Label Free and Corrected for
Changes in the Refractive Index of the Membrane on a Nanometer
Scale
Joachim Walter
1
, Natalia Schiefermeier
2
, Nina Hobi
3,4,5
, Benjamin Grau
6
, Christine E. Bandtlow
3
,
Lukas A. Huber
2,7
, Rainer Uhl
1
, Sebastian Munck
3,8
1
BioImaging Zentrum of the Ludwig-Maximilians, Universität München Martinsried, München, Germany
2
Divisions of Cell Biology and for Neurobiochemistry, Biocenter - Innsbruck Medical University, Innsbruck, Austria
3
Biocenter - Innsbruck Medical University, Innsbruck, Austria
4
Department of Physiology and Medical Physics, Division of Physiology, Innsbruck Medical University, Innsbruck, Austria
5
Institut for General Physiology, University Ulm, Ulm, Germany
6
Department of Developmental Neurobiology, Instituto Cajal, C.S.I.C., Madrid, Spain
7
Austrian drug screening institute, ADSI, Innsbruck, Austria
8
VIB Center for the Biology of Disease, KU Leuven, Leuven, Belgium
Keywords: Adhesion Sites, Membrane Dynamics, Interference Reflection Microscopy, Topography.
Abstract: The plasma membrane is the outer limit of the animal cell. As such, it is both a border separating inside
from outside and a signaling platform for interactions with the surroundings. Among these interactions are
extracellular matrix contacts and adhesion sites. The membrane and its contact sites together with the
underlying cytoskeleton undergo constant remodeling, which leads to changes of the cell shape. In addition
to spatial information micro-topographical maps provide, information about the z-dimension and describe
the position of the plasma membrane with respect to the distance to a given substrate. Here we address how
to measure height differences in the plasma membrane and how to create topographical maps of the plasma
membrane with nanometer resolution. We address the currently used methodologies along with their
advantages and drawbacks. Moreover, we delineate a label-free method to obtain topographic maps of the
plasma membrane that are corrected for differences in the refractive index of the membrane utilizing an
interferometric approach with multiple wavelengths and a normalization procedure to account for changes
in the refractive index in the membrane.
1 INTRODUCTION
The cell membrane separates the intracellular
content from the external environment of the cell. It
forms a hull over the cytoskeleton of the cell. The
shape of the cell can be compared to a tent plane
spanned over its poles, which leads to bending and
curvature of the membrane covering the
cytoskeleton. The cytoskeleton in turn anchors the
membrane to a substrate and is reported to be
involved in the compartmentalization of the
membrane through so called pickets and fences
(Ritchie et al., 2003). The adhesion points
themselves can act as signaling platforms (Cabodi et
al., 2010). Cell surface proteins transduce dynamic
extracellular signals to the cell interior (Spiller et al.,
2010) including interactions with the extracellular
matrix, modeling multiple cellular responses
including migration, differentiation and
proliferation.
Per se the plasma membrane is a self-organizing
organelle with strong interdependencies of its
constituents which are compartmentalized through a
special interaction and distribution pattern into so
called nano- and microdomains (Lingwood and
Simons, 2010).
In living cells, adhesion and migration are
fundamental cellular processes, which undergo
constant remodeling together with constant turnover
of the membrane itself. Adhesion and migration are
involved in all organizational levels of the organism,
from single cell translocation to tissue development
and movement of entire organisms. Consequently,
31
Walter J., Schiefermeier N., Hobi N., Grau B., Bandtlow C., Huber L., Uhl R. and Munck S..
Mapping Membrane Topology Label Free and Corrected for Changes in the Refractive Index of the Membrane on a Nanometer Scale.
DOI: 10.5220/0004752100310040
In Proceedings of the International Conference on Bioimaging (BIOIMAGING-2014), pages 31-40
ISBN: 978-989-758-014-7
Copyright
c
2014 SCITEPRESS (Science and Technology Publications, Lda.)

adhesion and migration are fundamental aspects of
development and appear early in the evolution of
higher organisms (Harwood and Coates, 2004).
Defects in adhesion have been implicated in several
diseases, for example in neuro-developmental
disorders (Olson and Walsh, 2002), and changes can
be associated with the carcinogenic transformation
of normal cells (Knudsen and Miranti, 2006).
Considering the interdependent role of the plasma
membrane, adhesion, cell surface movement,
diffusion of its constituents and the interactions with
the cytoskeleton have to be investigated as one
complex. How cells remodel their envelope during
early adhesion events and during spreading has been
highlighted before (Pierres et al., 2003, Ryzhkov et
al., 2010). Nanometer scale topographic maps of the
membrane can be used as a read-out for this
remodeling (Parthasarathy and Groves, 2004,
Sugiyama et al., 2012).
A topographic map is a representation that adds
the relief or height information to the classic x,y 2-D
information. Unfortunately the typical tool of the
cell biologist for retrieving 3-D information, a
confocal microscope does not have the resolution
that is required to accurately depict the typical
variations in height of cell membrane (Giebel et al.,
1999). Therefore, we want to explore a technique
that is not limited in depth, like for example TIRF
and that ideally is label free. While there is no
denying that efficient labeling techniques are
available, these techniques are offset by the time and
resources required to attach the probe to the
biomolecule of interest. The quality of the technique
is depending on the quality of the label and the
labeling process. In contrast, to this previously used
interferometric methods are label free. Here we
present an interferometric method that uses a multi
wavelength normalization procedure. By applying
this new method we are the first to compensate for
artifacts, which are introduced by differences in the
refractive index of the membrane, e.g. at sites of
adhesion between the membrane and the substrate
and thus get more reliable results for creating micro-
topographical maps of adhering cells.
2 DIFFERENT TECHNIQUES TO
CREATE TOPOGRAPHIC
MAPS
Several procedures can be applied to investigate the
membrano-cytoskeletonal complex reorganization
via topographic maps on a nanometer scale. Among
them are Atomic Force Microscopy (AFM), Total
Internal Reflection Fluorescence Microscopy
(TIRF); Surface Plasmon Resonance (SPR),
Fluorescence Interference Contrast (FLIC), Point
Spread Function (PSF) fitting, Foerster Resonance
Energy Transfer (FRET) and micro-interference
methods.
2.1 Atomic Force Microscopy
Atomic Force Microscopy (AFM) involves probing
a surface, e.g. a cell surface by scanning a sharp tip
over the cell. In AFM, the interaction between the
specimen and the tip is measured by the deflection
of the cantilever (the tip holder) (Zhang et al.,
2010). A topographic map of the cellular membrane
can be created using AFM (Duman et al., 2010). The
limitations of AFM include the time-resolution as a
consequence of the scanning process and the fact
that only the top membrane is accessible to the
scanning probe.
2.2 Total Internal Reflection
Fluorescence
In Total Internal Reflection Fluorescence (TIRF)
microscopy light is projected under an angle of total
internal reflection on an interface from higher to
lower refractive index. This process initiates an
evanescent wave that can be used for excitation of
fluorescence. The intensity of the fluorescent signal
scales exponentially with the distance from the
interface (Axelrod et al., 1984). This technique has
been used to investigate the adhesion contacts and
membrane dynamics (Reichert and Truskey, 1990,
Snijder-Van As et al., 2009). The artifacts that can
occur include interference fringes due to laser light
being scattered at non-uniformities in the light path
and anisotropic blur due to a mismatch in the
refractive index between the specimen and the
surrounding medium.
TIRF based topographic maps encounter the
problem decreasing fluorescence intensity with
increasing distance from the interface; therefore,
making measurements more difficult and more
inaccurate the further away the sample is from the
interface. The penetration depth depends on the
wavelength and the incident angle, which means that
measurements in practice are limited to ~200 nm
above the coverslip (Mattheyses and Axelrod, 2006)
which however was sufficient for dynamic cell
measurements (Ryzhkov et al., 2010).
BIOIMAGING2014-InternationalConferenceonBioimaging
32

2.3 Surface Plasmon Resonance
Surface Plasmon Resonance (SPR) measurements
are another possibility for creating topographic maps
and have been successfully used in the past to create
topographic maps (Giebel et al., 1999) . SPR are
electromagnetic waves, which are traveling parallel
to a metal or dielectric surface, if the frequency of
the photons matches the frequency of surface
electrons. SPRs are changed upon changes to the
dielectric surface like absorption or binding
processes. Since surface plasmons are used to
establish an evanescent wave, SPR shares some
similarity with TIRF microscopy.
2.4 Fluorescence Interference Contrast
Fluorescence Interference Contrast (FLIC) can be
used to create topographic displays with nanometer
resolution of the cellular envelope (Parthasarathy
and Groves, 2004). Since FLIC occurs only by the
interference of a light emitted by a fluorophore with
its reflection in vicinity of a reflecting surface
(Lambacher and Fromherz, 1996) it is not very
commonly used for biological measurements.
2.5 Point Spread Function Shape based
Methods
Another way to deduce height information on the
nanometer scale has been applied for single particle
tracking (Toprak et al., 2007). Here, the path of the
single molecule is corrected based on information
derived from the microscopic image itself and the
way the light is diffracted.
For a given spot, typically the shape of the Point
Spread Function (PSF) changes with height, which
means for an object with a known shape and a
corresponding 3-D PSF, that the z-position can be
measured.
Different attempts have been made so far to use
this paradigm. One way is to use a double plane
detection scheme, which allows imaging of different
optical planes at the same time allowing the 3-D
information of the PSF to be fitted. Another method
is to use a cylindrical lens as it changes the 3-D PSF
due to an introduced astigmatism and allows direct
conclusions to be made about the height (Kao and
Verkman, 1994).
Basically, if the path of a particle is read out in 3-
D, it can be corrected for movements in 3-D;
however, a topographic map would not necessarily
be created. This can be achieved using the 3-D
detection scheme for super-resolution microscopy
images as described by (Huang et al., 2008, Juette et
al., 2008). The quality of the measurement depends
on the quality of the PSF fit.
Concerning maps created by PSF based methods;
differences in the refractive index of the membrane
will as well influence the PSF. These distortions of
the PSF are difficult to compensate for. Moreover, if
a complete topographic map is measured on living
cells with a super-resolution method, the timing can
become problematic, as a multitude of images need
to be acquired for these methods (Schermelleh et al.,
2010). Another difficulty is that single molecule
super-resolution methods are pointillistic and depend
on the labeling density, which means they leave
gaps, requiring interpolation of the missing data
(Galbraith and Galbraith, 2011).
2.6 Fluorescent Resonant Energy
Transfer
FRET provides information about the interaction
between proteins at a resolution of a few
nanometers. As such, it is used for surface
interactions of proteins and was used to some extent
to create topographic maps (Parthasarathy and
Groves, 2004). However, due to the limited range of
the resonant energy transfer, the answer provided by
this technique was a contact or no contact answer
and not a differentiated read-out describing the
topography of the cell membrane over a longer
ranges.
2.7 Interferometric Methods
Interferometric methods represent another potential
strategy for the creation of topographic maps. Both
interference reflection microscopy (IRM) and
reflection interference contrast microscopy (RICM)
have been applied to investigate minute changes in
the height of membranes at nanometer resolution
(Weber, 2003). For example, these techniques were
used to investigate the dynamics of adhesion of
fibroblasts to several surfaces (e.g. see (Fang et al.,
2005)). However, repeatedly changing from dark to
bright due to the oscillatory nature of the
interference pattern over longer distances creates
some ambiguity due to lack of an absolute intrinsic
reference. This problem has also limited the
possibility for investigation of the z-direction of
objects with unknown shape. Nevertheless, recent
advantages in RICM have shown that absolute
distance measurements are possible in floating
vesicles with the application of more wavelengths
and quantitative image analysis (Schilling et al.,
MappingMembraneTopologyLabelFreeandCorrectedforChangesintheRefractiveIndexoftheMembraneona
NanometerScale
33
2004). Consequently dual wavelength or DW-
reflection interference microscopy is used recently
for adhesion, vesicle dynamics and further
developments of the technique (for examples see
(Contreras-Naranjo and Ugaz, 2013, Limozin and
Sengupta, 2009, Monzel et al., 2009, Mundinger et
al., 2012, Sugiyama et al., 2012)). One of the
advantages of the interference methods is that they
allow for label free investigation of the cell
membrane. However, earlier reports have shown that
interference microscopy and measurements of
adhesion force were not in agreement (Zheng et al.,
1994) and that the refractive index within the cell
membrane can vary, especially at adhesion sites
(Iwanaga et al., 2001). According to the Fresnel
equations (Hecht, 2002) changes in the refractive
index of the membrane lead to changes in
reflectivity of the membrane. Along the same lines,
it was shown that the reflectivity at adhesion sites
can be higher (Atilgan and Ovryn, 2011). Moreover,
we could not fit DW-RICM measurements of
cellular process to the theory. In order to overcome
these problems and to be able to create absolute,
correct and label free topographic maps that can
universally be applied to cells, DW-RICM
measurements need to be corrected for differences in
the refractive index.
Here we delineate a method to correct for
differences in the refractive index of the membrane
using a normalization procedure based on multiple
wavelengths. We provide a theoretical background
and show the proof of principle using a cellular
process.
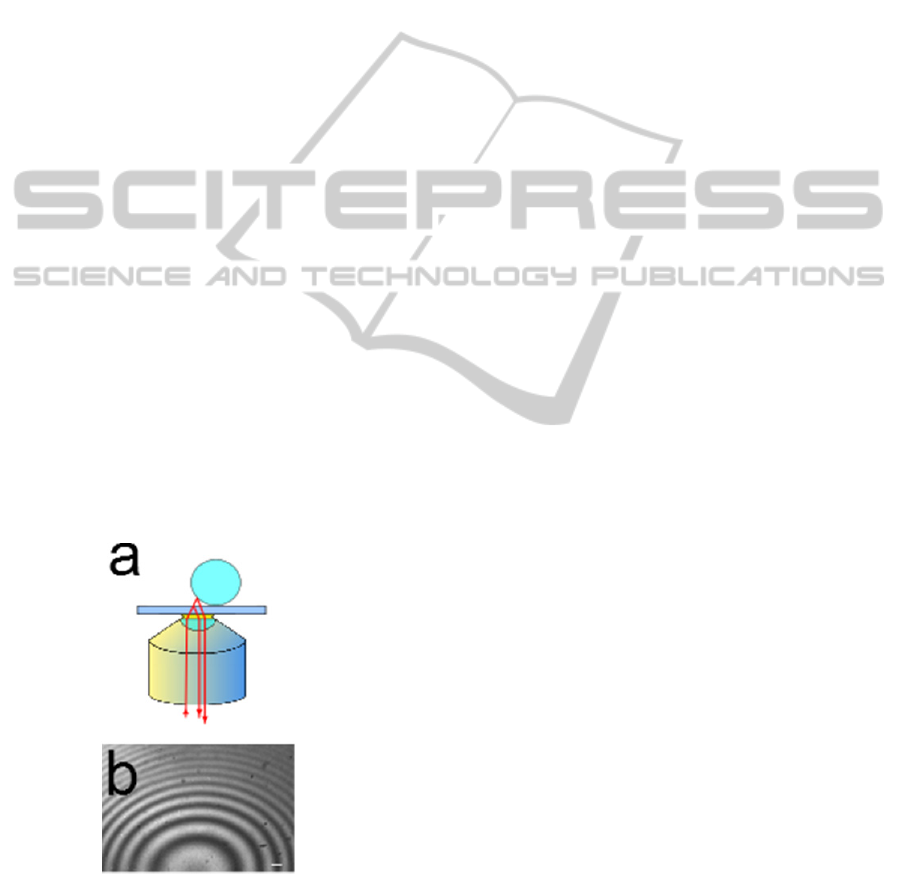
Figure 1: (a) schematic of reflective interference imaging
of a glass bead. (b) interference fringes of a glass bead
imaged with the setup. Scale bar=5µm.
3 MATERIALS AND METHODS
The images were acquired using a Zeiss Axiovert
200M equipped with a 63x oil (NA 1.4), a 100x oil
(NA 1.45) objective lens and a RT monochromatic
camera (diagnostic instruments). The setup was
driven by the Metamorph software (Universal
Imaging). A 50/50 beam splitter was used for
reflected light illumination and to allow collection of
the reflected light. A HBO lamp was used as light
source using Köhler illumination and aperture and
field diaphragms relatively closed to restrict the light
exposure of the sample. Interference filters (center
wavelength as indicated) were used in the parallel
part of the illumination path to create
monochromatic light. A motorized filter wheel was
used to switch between the wavelengths.
The rat CNS neuroblastoma cell line B104
(Schubert et al., 1974) was grown at 8.5% CO
2
in
DMEM (Invitrogen) supplemented with 10% heat-
inactivated fetal calf serum and 1% antibiotics
(Sigma; 10,000 units penicillin/ml and 10 mg
streptomycin/ml). Cultures were passaged once a
week at approximately 70–80% confluence and the
growth medium was changed every two days. B104
cells were plated at a density of 3,000 cells/cm
2
in
growth-supplemented medium on glass bottom
tissue-culture dishes (Sarstedt, Newton, NC), which
coated with poly-D-lysine (Sigma) and laminin
(Sigma). A heated stage and a cover were used to
conserve optimal conditions for cell survival and
growth (Carl Zeiss, Jena).
Beads of approximately 2 mm diameter with
unmarked surfaces were created from glass droplets
with a Bunsen burner.
Images were analyzed using ImageJ (1.44
National Institutes of Health USA,
http://rsb.info.nih.gov/ij), with custom written
macros. Models were calculated using Mathcad (13,
Mathsoft Engineering & Education, Cambridge MA)
and Excel (Microsoft, Redmond).
For clarity, the background in the images with
the growth cones has been removed based on the
phase contrast image. Background in the acquired
images was measured with a region of interest in the
vicinity of the object. Images of Q’1, Q’2 and Q’3
were derived according to the theory section. For the
creation of the height maps, values were rounded
and compared to a theoretical look up table
generated in Excel. Correlation plots were created
using the cytofluorogram module in Jacob using Fiji
(Bolte and Cordelieres, 2006, Schindelin et al.,
2012).
BIOIMAGING2014-InternationalConferenceonBioimaging
34

4 RESULTS
4.1 Theory of Refractive Index-free
Interferometric Measurements
In interference microscopy, the sample is
illuminated in reflective mode. Part of the light is
reflected at the interface between the coverslip and
the medium with a lower refractive index (interface
1). At the interface between the medium and the cell
membrane, which has a higher refractive index,
again part of the light is reflected (interface 2).
These two reflected beams form the interference
pattern that is observed as a function of the distance
between the coverslip and the cell membrane. The
intensity distribution of the interference pattern for a
given wavelength was previously described
(Schilling et al., 2004):
12 12
4(,)
((,), ) 2 cos
nh x y
Ihxy I I II
(1)
with I(h(x,y,),λ) being the intensity on the
interferogram corresponding to a point whose lateral
position is defined by the coordinates (x,y) and the
height of the membrane above the coverslip is given
by h(x,y). I
1
and I
2
are the intensities of the beams
reflected from interface 1 and interface 2,
respectively.
δ is the difference of the phase shifts δ
1/2
both
beams undergo upon reflection. δ
1/2
is 0 if the beam
is reflected from an interface to a medium with
lower refractive index, such as interface 1. It is
π if
the beam is reflected from a medium with lower
refractive index such as interface 2 (Hecht, 2002).
Hence, in this application
(2)
The intensity distribution further depends on n being
defined as the refractive index of the medium and
λ,
the wavelength of the illumination light.
A glass bead was used as a test object as it has a
higher refractive index than water and a known
shape, permitting analysis of the interference pattern
under controlled conditions. As expected, the glass
bead shows the characteristic Newton fringes (see
Figure 1). When two wavelengths were applied, the
resulting pattern fits nicely to the relation given in
(1). When we consequently investigated cellular
processes we have observed that the phase shift and
the intensity do not match the relation given in (1).
This finding confirms previously published data,
indicating the variability of the reflection coefficient
especially at focal adhesion sites (Atilgan and
Ovryn, 2011, Iwanaga et al., 2001).
Consequently, our aim was to find a way to measure
the height of the membrane above the coverslip
without relying on the assumption of a constant
reflectivity of the plasma membrane.
In Equation (2), I
1/2
can be written as
2/12/1
RaI
(3)
a being the intensity of the incoming light and R
1/2
the reflectivity of the respective interface.
We used three wavelengths to correct for the
inhomogeneities in the reflectivity. For wavelength
λ
α
,, inserting equations (2) and (3) into (1) yields
12 12
4
(, ) 2 cos
nh
Ih a R R RR
(4)
Similar equations hold for wavelengths λ
β
and λ
γ
.
Scaling and subtracting the intensities for different
wavelengths cancels out the summand R
1
+ R
2
.
12
12
(, ) (, )
44
2cos cos
44
2coscos
a
Ih Ih
a
nh nh
aRR
nh nh
aRR
(5)
Finally, division by a similar expression with a third
wavelength eliminates the term
21
RR .
nhnh
nhnh
hI
a
a
hI
hI
a
a
hI
Q
4
cos
4
cos
4
cos
4
cos
),(),(
),(),((
(6)
As the denominator reaches zero,
Q
contains
reoccurring discontinuities which can be avoided by
defining the denominator as
1
22
2
2
(, ) (, ) (, ) (, )
(, ) (, )
aa
Ih Ih Ih Ih
aa
D
aa
Ih Ih
aa
(7)
and defining new quotients as
MappingMembraneTopologyLabelFreeandCorrectedforChangesintheRefractiveIndexoftheMembraneona
NanometerScale
35

2
2
'
1
(( ( , ), ) ( ( , ), )
a
I hxy Ihxy
a
Q
D
(8)
2
2
'
2
(( ( , ), ) ( ( , ), )
a
I hxy Ihxy
a
Q
D
(9)
22
22
'
3
(, ) (, )
aa
Ih Ih
aa
Q
D
(10)
The expressions
a
a
and
a
a
can be measured in
areas of the images, where only the interface
between the coverslip to the medium contributes to
the signal (cell-free areas) as from equation (3) it
follows
a
a
Ra
Ra
I
I
1
1
1
1
(11)
An instructive display of the different wavelengths
(540 nm, 600 nm and 685 nm) illuminating the bead
(Figure 2 a-d), their relation to the height of the bead
and the relative intensity of the consequent quotients
Q’1, Q’2 and Q’3 in dependence of the measured
height of the glass bead can be seen in Figure 2 e-h.
The height of the lower hemisphere of the glass bead
can be calculated and is a function of the radius r
and distance x from the center where the glass bead
touches the coverslip (see (12)).
hxrr
22
(12)
Overall, the intensity distributions follow the
theoretical descriptions. The different wavelengths
in Figure 2d show the described phase shift
(Schilling et al., 2004). For the RICM, the intensity
changes with height of the bead, which is in
agreement with previous findings (Contreras-
Naranjo and Ugaz, 2013). In contrast to DW-RICM
our approach normalizes for this effect.
4.2 Practical Test of Refractive Index
Free Interferomtric Measurements
Next the growth cone of a B104 cell, a widely used
neuronal model (Schubert et al., 1974), was
investigated as a more physiologically relevant
model (Figure 3). The sample was imaged with the
same three wavelengths as the glass bead described
above (Figure 3 a-c). The equations above were
applied to calculate Q’1, Q’2 and Q’3 (Figure 3 d-f).
Figure 2: Testing multi-wavelength interference
microscopy on glass beads. (a-c) interferometric images of
the glass bead using light of 540nm; 600nm and 685nm
wavelength. (d) is an intensity profile of the pictures (a),
(b) and (c) from the region indicated by the yellow line in
(a). The x axis represents the height if the glass bead based
on equation 12. The length of the region is about 30 µm.
Insert shows theoretical values (e-g) depicts the calculated
quotients Q’1-Q’3 based on (a-c). (h) the relative intensity
distribution of Q’
1
, Q’
2
and Q’
3
of (e-f) similar to (d).
Insert shows theoretical values. Scale bar = 5 µm.
To test DW-RIM under these conditions, a rectangle
of 50x50 pixels in the growth cone was selected and
is displayed in a correlative graph. It can be seen that
the points do not strongly follow a pattern and the
characteristic curl shaped relation of (Schilling et al.,
2004) does not become visible. Using the same
approach with our method and using the Q’1 and
Q’2 (Figure 3 h),) the expected oval shaped relation
of the two Q’s becomes recognizable. Next, we
explored calculating a 3-D topography of the
membrane. As the concatenation of
'
3
'
1
QQ
can be
used for calculating the height in the range from 0 to
240 nm, which proved to be sufficient in this case, a
look-up table was generated and applied to the
values measured from the growth cone. Therefore,
an image with grey values representing the height in
nm can be deduced and is displayed as a surface plot
next to the phase contrast image of the growth cone
(Figure 3i,j). The result is in agreement with earlier
publications (Giebel et al., 1999). It was not possible
to map all pixels in the look-up table with the
measured values, which is probably due to noise in
the system; these values were consequently set to
zero. The overall noise was relatively low as can be
seen by the minimal variation in the relation of
BIOIMAGING2014-InternationalConferenceonBioimaging
36
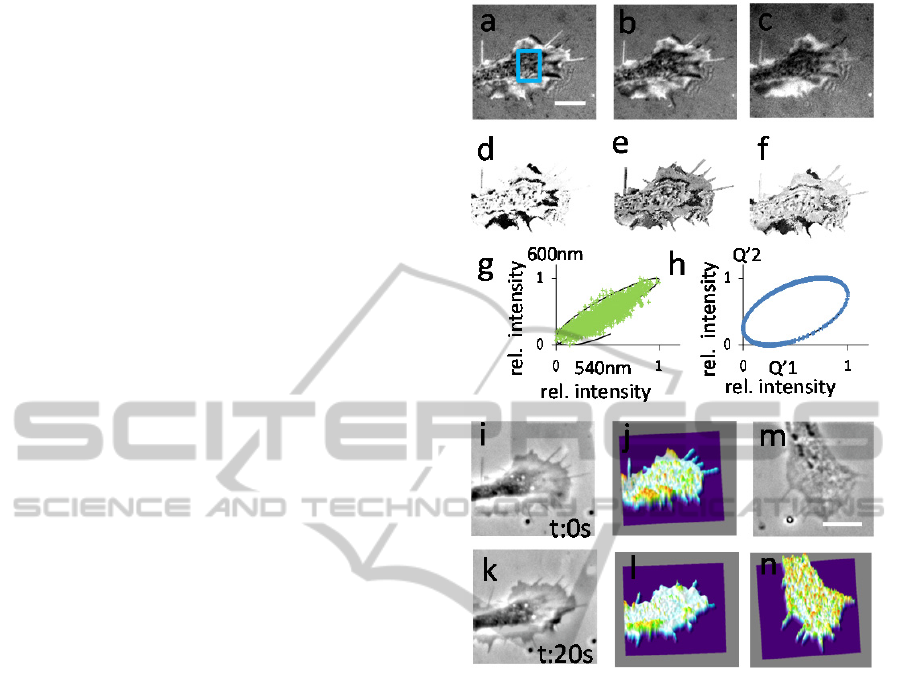
Figure 3h, which depicts depicting the oval shaped
relation of Q’1 and Q’2 with little variation. To
demonstrate the dynamic behavior of the membrane
and the height changes, the same growth cone was
imaged s20s later (Figure 3 i,j). Figure 3 k,l shows
another example of a growth cone demonstrating
that the height distributions can vary in different
neuronal processes.
Taken together, we present a multi-wavelength
extension of RICM: MIRM. By applying different
wavelengths for illumination, we can reconstruct the
refractive index corrected 3-D shape of the cellular
membrane.
5 CONCLUSIONS
Here we have described different ways to measure
membrane topography presenting the advantages
and limitations of several methodologies. We
highlight the benefits of label free interferometric
measurements, which can measure over a longer
range then TIRF, SPR, FLIC and FRET
measurements. Different then AFM interferometric
methods can probe the cell membrane, where the
adhesion sites are located. For imaging without gaps
the PSF based techniques require dense labeling, but
need to be read out in a non-overlapping way. This
requires a single molecule approach, which entails
the acquisition of much more images as compared to
our method. Another advantage of interferometric
methods is that they can be designed to be
compatible with labeling techniques and thus allow
for a higher degree of multiplexing. So far the
labeling independent interferometric methods have
suffered from ambiguity due to changes in the
refractive index. Here we show that when corrected
for differences in refractive index, unambiguous
imaging of membrane topologies can be achieved on
a widefield system. In comparison to the earlier
described method of (Schilling et al., 2004), the
method we propose has the advantage that
differences in the refractive index of the membrane
can be cancelled out. This effect can be seen in the
comparison of Figure 3 g and h and in the fact that a
clear relationship only becomes visible when
differences in the refractive index are cancelled out,
emphasizing that the differences in the refractive
index are not only drastic but can also be corrected.
Furthermore, the framework presented here can
easily be expanded to longer distances by applying
more wavelengths and using different wavelength
triplets for correction.
We have noticed that the method is sensitive to
Figure 3: Testing multi-wavelength interference
microscopy for mapping height profiles in a refractive
index free manner on cellular processes. (a-c)
interferometric images of a neuronal growth cone using
light of 540nm; 600nm and 685nm wavelength. (d-f)
depicts the calculated quotients Q’1-Q’3 based on (a-c).
(g) correlation of the normalized intensities of (a) and (b)
of the region indicated by the blue rectangle in (a). Theory
in black. (h) correlation of Q’1 and Q’2 like in (g). Theory
in black. (i) phase contrast picture of a neuronal process.
(j) is a reconstruction of the membrane topology of the
cellular process in (i). (k) the same growth cone as in (i)
20 seconds later. (l) 3-D topographical map of the growth
cone in (k). (m) another example of a neuronal growth
cone in phase contrast. (n) 3-D topographical map of the
growth cone in (m).
For the reconstruction the relation between Q’
1
and Q’
3
with the wavelength triplet 540/600/685 nm has been
used.
Scale bars = 5 µm color/height range in (j,l and n) from
purple = zero to peaks in red = 200 nm.
background disturbances. Therefore, subtraction and
the relative normalization of the individual
wavelengths are critical for correct calculation.
Here the corrected membrane topography has
been reconstructed with an unprecedented ~30 nm
MappingMembraneTopologyLabelFreeandCorrectedforChangesintheRefractiveIndexoftheMembraneona
NanometerScale
37

resolution (Fig. 3). Theoretically, a much better
resolution in z-direction is possible than shown in
Figure 3. The limited resolution here is mainly due
to the use of the look up table. That relative
differences of ~5 nm can be practically be achieved
using interference measurements has been
demonstrated earlier (Llobet et al., 2003). The
achievable practical resolution depends on the
sensitivity of the detector and the wavelengths used.
Due to the nonlinearity in the obtained relation after
correction for the refractive index, the achievable
resolution cannot be equal at all distances. Like in
the PSF based methods, our implementation leaves
gaps; however these could be improved when the
measurements are fitted to the quotients instead of
using a look-up table.
It should to be emphasized that correction for
differences in height is needed for single particle
tracking. Simple arithmetic indicates that the error
calculated for a movement in the membrane is about
12%, e.g .if a height change of 150 nm is ignored
over a 300 nm distance. We believe an independent
measurement, undisturbed from refractive index
changes, is achievable with a label free technique
and is a good alternative to the currently used
methods for the correction (Kao and Verkman, 1994,
Toprak et al., 2007).
One of the advantages of the described method is
its speed. The three wavelengths for reflective
imaging can easily be acquired in the millisecond
range. The analysis can be implemented for almost
instantaneous results (see as well (Contreras-Naranjo
and Ugaz, 2013)). The fact that the method is label
free means that it is relatively cheap and is making it
attractive for large scale quantitative analysis and
screening tasks. One potential application we see is
screening for the transition between mesenchymal
and amoeboid modes of migration of tumor cell
upon drug treatment. This transition is relevant for
potential treatment as it has been put in the context
of tumor invasiveness and aggressiveness (Kosla et
al., 2013, Pankova et al., 2010). Another application
field is neuroscience as exemplified here. Neuronal
growth cones are the growing tips of neurons. These
exhibit fast remodeling of the cytoskeleton and the
membrane when growing towards their targets. The
dynamic of this remodeling is demonstrated by
Figure 3 i-l. Moreover, that fact that there are
different states of height maps is emphasized when
comparing Figure 3i-l with Figure 3 m and n.
Overall, we have only started to understand how
cells move and migrate; therefore it is important to
look at all processes and not only at the points of
contact. With topographical maps, the overall
remodeling of the cellular envelope with respect to
their movement and interaction with the substrate
can be observed. This aspect of the remodeling of
membrane has been neglected so far, potentially due
to the lack of good methods. However we believe it
poses an important aspect of the cell and the
migration process. Considering migration and
focusing on the adhesion sites would be like looking
solely at the feet when trying to figure out how a
human walks.
The analysis of the topography of the cell
membrane provides information on membrane
trafficking and the remodeling of the underlying
cytoskeleton as one complex that is remodeled
during cellular movement. We believe that the tool
presented here is a useful extension of the standard
repertoire to investigate adhesion and migration and
will contribute toward the illumination of these
processes in the future.
REFERENCES
Atilgan, E. & Ovryn, B. 2011. Reflectivity and topography
of cells grown on glass-coverslips measured with
phase-shifted laser feedback interference microscopy.
Biomed Opt Express, 2, 2417-37.
Axelrod, D., Burghardt, T. P. & Thompson, N. L. 1984.
Total internal reflection fluorescence. Annu Rev
Biophys Bioeng, 13, 247-68.
Bolte, S. & Cordelieres, F. P. 2006. A guided tour into
subcellular colocalization analysis in light microscopy.
J Microsc, 224, 213-32.
Cabodi, S., Del Pilar Camacho-Leal, M., Di Stefano, P. &
Defilippi, P. 2010. Integrin signalling adaptors: not
only figurants in the cancer story. Nat Rev Cancer, 10,
858-70.
Contreras-Naranjo, J. C. & Ugaz, V. M. 2013. A
nanometre-scale resolution interference-based probe of
interfacial phenomena between microscopic objects
and surfaces. Nat Commun, 4, 1919.
Duman, M., Pfleger, M., Zhu, R., Rankl, C., Chtcheglova,
L. A., Neundlinger, I., Bozna, B. L., Mayer, B., Salio,
M., Shepherd, D., Polzella, P., Moertelmaier, M.,
Kada, G., Ebner, A., Dieudonne, M., Schutz, G. J.,
Cerundolo, V., Kienberger, F. & Hinterdorfer, P. 2010.
Improved localization of cellular membrane receptors
using combined fluorescence microscopy and
simultaneous topography and recognition imaging.
Nanotechnology, 21, 115504.
Fang, N., Zhu, A., Chan-Park, M. B. & Chan, V. 2005.
Adhesion contact dynamics of fibroblasts on
biomacromolecular surfaces. Macromol Biosci, 5,
1022-1031.
Galbraith, C. G. & Galbraith, J. A. 2011. Super-resolution
microscopy at a glance. J Cell Sci, 124, 1607-11.
BIOIMAGING2014-InternationalConferenceonBioimaging
38

Giebel, K., Bechinger, C., Herminghaus, S., Riedel, M.,
Leiderer, P., Weiland, U. & Bastmeyer, M. 1999.
Imaging of cell/substrate contacts of living cells with
surface plasmon resonance microscopy. Biophys J, 76,
509-16.
Harwood, A. & Coates, J. C. 2004. A prehistory of cell
adhesion. Current Opinion in Cell Biology, 16, 470-
476.
Hecht, E. 2002. Optics, Reading, Mass., Addison-Wesley.
Huang, B., Wang, W., Bates, M. & Zhuang, X. 2008.
Three-dimensional super-resolution imaging by
stochastic optical reconstruction microscopy. Science,
319, 810-3.
Iwanaga, Y., Braun, D. & Fromherz, P. 2001. No
correlation of focal contacts and close adhesion by
comparing GFP-vinculin and fluorescence interference
of Dil. European Biophysics Journal: EBJ, 30, 17-26.
Juette, M. F., Gould, T. J., Lessard, M. D., Mlodzianoski,
M. J., Nagpure, B. S., Bennett, B. T., Hess, S. T. &
Bewersdorf, J. 2008. Three-dimensional sub-100 nm
resolution fluorescence microscopy of thick samples.
Nat Methods, 5, 527-9.
Kao, H. P. & Verkman, A. S. 1994. Tracking of single
fluorescent particles in three dimensions: use of
cylindrical optics to encode particle position. Biophys
J, 67, 1291-300.
Knudsen, B. S. & Miranti, C. K. 2006. The impact of cell
adhesion changes on proliferation and survival during
prostate cancer development and progression. J Cell
Biochem, 99, 345-61.
Kosla, J., Pankova, D., Plachy, J., Tolde, O., Bicanova, K.,
Dvorak, M., Rosel, D. & Brabek, J. 2013. Metastasis
of aggressive amoeboid sarcoma cells is dependent on
Rho/ROCK/MLC signaling. Cell Commun Signal, 11,
51.
Lambacher, A. & Fromherz, P. 1996. Fluorescence
interference-contrast microscopy on oxidized silicon
using a monomolecular dye layer Applied Physics A:
Materials Science & Processing, 63, 207-216.
Limozin, L. & Sengupta, K. 2009. Quantitative reflection
interference contrast microscopy (RICM) in soft matter
and cell adhesion. Chemphyschem, 10, 2752-68.
Lingwood, D. & Simons, K. 2010. Lipid rafts as a
membrane-organizing principle. Science, 327, 46-50.
Llobet, A., Beaumont, V. & Lagnado, L. 2003. Real-Time
Measurement of Exocytosis and Endocytosis Using
Interference of Light. Neuron, 40, 1075-1086.
Mattheyses, A. L. & Axelrod, D. 2006. Direct
measurement of the evanescent field profile produced
by objective-based total internal reflection
fluorescence. J Biomed Opt, 11, 014006.
Monzel, C., Fenz, S. F., Merkel, R. & Sengupta, K. 2009.
Probing biomembrane dynamics by dual-wavelength
reflection interference contrast microscopy.
Chemphyschem, 10, 2828-38.
Mundinger, T. A., Sommerfeld, A., Reinehr, R., Spatz, J.
P., Haussinger, D. & Boehm, H. 2012. Investigating
cell-ECM contact changes in response to hypoosmotic
stimulation of hepatocytes in vivo with DW-RICM.
PLoS One, 7, e48100.
Olson, E. C. & Walsh, C. A. 2002. Smooth, rough and
upside-down neocortical development. Current
Opinion In Genetics & Development, 12, 320-327.
Pankova, K., Rosel, D., Novotny, M. & Brabek, J. 2010.
The molecular mechanisms of transition between
mesenchymal and amoeboid invasiveness in tumor
cells. Cell Mol Life Sci, 67, 63-71.
Parthasarathy, R. & Groves, J. T. 2004. Optical techniques
for imaging membrane topography. Cell Biochemistry
And Biophysics, 41, 391-414.
Pierres, A., Eymeric, P., Baloche, E., Touchard, D.,
Benoliel, A.-M. & Bongrand, P. 2003. Cell membrane
alignment along adhesive surfaces: contribution of
active and passive cell processes. Biophysical Journal,
84, 2058-2070.
Reichert, W. M. & Truskey, G. A. 1990. Total internal
reflection fluorescence (TIRF) microscopy. I.
Modelling cell contact region fluorescence. J Cell Sci,
96 ( Pt 2), 219-30.
Ritchie, K., Iino, R., Fujiwara, T., Murase, K. & Kusumi,
A. 2003. The fence and picket structure of the plasma
membrane of live cells as revealed by single molecule
techniques (Review). Mol Membr Biol, 20, 13-8.
Ryzhkov, P., Prass, M., Gummich, M., Jac-Simon K¨Uhn,
J.-S., C., O. & D¨Obereiner, H.-G. 2010. Adhesion
patterns in early cell spreading. J. Phys.: Condens.
Matter, 194106 (8pp).
Schermelleh, L., Heintzmann, R. & Leonhardt, H. 2010. A
guide to super-resolution fluorescence microscopy. J
Cell Biol, 190,
165-75.
Schilling, J., Sengupta, K., Goennenwein, S., Bausch, A.
R. & Sackmann, E. 2004. Absolute interfacial distance
measurements by dual-wavelength reflection
interference contrast microscopy. Physical Review. E,
Statistical, Nonlinear, And Soft Matter Physics, 69,
021901.
Schindelin, J., Arganda-Carreras, I., Frise, E., Kaynig, V.,
Longair, M., Pietzsch, T., Preibisch, S., Rueden, C.,
Saalfeld, S., Schmid, B., Tinevez, J. Y., White, D. J.,
Hartenstein, V., Eliceiri, K., Tomancak, P. & Cardona,
A. 2012. Fiji: an open-source platform for biological-
image analysis. Nat Methods, 9, 676-82.
Schubert, D., Heinemann, S., Carlisle, W., Tarikas, H.,
Kimes, B., Patrick, J., Steinbach, J. H., Culp, W. &
Brandt, B. L. 1974. Clonal cell lines from the rat
central nervous system. Nature, 249, 224-227.
Snijder-Van As, M. I., Rieger, B., Joosten, B.,
Subramaniam, V., Figdor, C. G. & Kanger, J. S. 2009.
A hybrid total internal reflection fluorescence and
optical tweezers microscope to study cell adhesion and
membrane protein dynamics of single living cells. J
Microsc, 233, 84-92.
Spiller, D. G., Wood, C. D., Rand, D. A. & White, M. R.
2010. Measurement of single-cell dynamics. Nature,
465, 736-45.
Sugiyama, N., Asai, Y., Yamauchi, T., Kataoka, T., Ikeda,
T., Iwai, H., Sakurai, T. & Mizuguchi, Y. 2012. Label-
free characterization of living human induced
pluripotent stem cells by subcellular topographic
imaging technique using full-field quantitative phase
MappingMembraneTopologyLabelFreeandCorrectedforChangesintheRefractiveIndexoftheMembraneona
NanometerScale
39

microscopy coupled with interference reflection
microscopy. Biomed Opt Express, 3, 2175-83.
Toprak, E., Balci, H., Blehm, B. H. & Selvin, P. R. 2007.
Three-dimensional particle tracking via bifocal
imaging. Nano Lett, 7, 2043-5.
Weber, I. 2003. Reflection interference contrast
microscopy In: PARKER, G. M. A. I. (ed.) Methods in
Enzymology. ed.: Academic Press.
Zhang, Y., Hu, X., Sun, J., Shen, Y., Hu, J., Xu, X. &
Shao, Z. 2010. High-resolution imaging and nano-
manipulation of biological structures on surface.
Microsc Res Tech.
Zheng, J., Buxbaum, R. E. & Heidemann, S. R. 1994.
Measurements of growth cone adhesion to culture
surfaces by micromanipulation. The Journal Of Cell
Biology, 127, 2049-2060.
BIOIMAGING2014-InternationalConferenceonBioimaging
40
