
Increasing Self-consumption of Photovoltaic Electricity by Storing
Energy in Electric Vehicle using Smart Grid Technology in the
Residential Sector
A Model for Simulating Different Smart Grid Programs
M. J. van der Kam and W. G. J. H. M. van Sark
Copernicus Institute of Sustainable Development, Utrecht University, Utrecht, The Netherlands
Keywords: Smart Grid, Photovoltaic Electricity, Self-consumption, Electric Vehicle, Energy Storage.
Abstract: In this paper a model has been developed which intends to simulate the increase of self-consumption of
photovoltaic (PV)-power by storing energy in electric vehicle (EV) using smart grid technology in the
residential sector. Three different possible smart grid control algorithms for a micro-grid consisting of solar
panels, a household and an EV are presented that manage the (dis-)charging profile of an EV, either in real-
time or using linear optimization using predictions for PV-power and electricity demand. The different
control algorithms are simulated for a year using data for PV-power and electricity demand from the
Netherlands and one specific EV. Preliminary results of the model are presented, showing that all control
algorithms could significantly increase self-consumption and reduce peaks in electricity demand from the
main grid. Although the difference in performance of the control algorithms for self-consumption is
marginal, we find that linear optimization works better than the real-time algorithms for peak reduction.
1 INTRODUCTION
The worldwide increase of electricity demand poses
major challenges in the energy sector. Since 1971,
the final consumption of electricity has increased
four-fold to 60 PJ in 2010 (IEA, 2012) and is
expected to further increase due to growing global
population and welfare. Issues related to this
development include availability, cost and
environmental issues such as global warming and
depletion of resources. While the industrial sector
has the highest demand for electricity, demand in the
residential sector shows the highest increase in
Europe (Bertoldi and Atanusiu, 2008) and is
therefore an important sector for changes in
electricity provision and distribution.
Another important sector contributing to global
warming is the transport sector. Globally the
contributions of the transport sector to greenhouse
gas (GHG)-emissions amounted to nearly 20% in
2009 (Hoen et al., 2009). According to the European
Federation for Transport and Environment (2011)
CO
2
emissions from the European transport sector
have increased by 29% since 1990.
Electric vehicles (EVs) are a promising
technology for reducing the environmental burden of
road transport (Essen, et al. 2011). If EV sales
increase it can be beneficial for reducing GHG-
emissions, but it also creates another issue;
electricity demand will increase even further. Also,
the typical charging pattern of EVs without a control
system coincides roughly with that of households
(E-laad, 2012), which is high in the morning and the
evening and low in the afternoon; it thus contributes
to existing peaks in electricity demand in the
residential sector.
PV technology can be part of the solution to
problems relating with electricity and transport,
since there are no emissions of greenhouse gasses
during electricity production. If PV electricity is
used to power EV’s, transport with EV will cause
even less or zero GHG emissions. An important
advantage of PV for the residential sector is its
scalability; even single households can use this
technology.
However, the mismatched production and load
curve for PV for domestic use poses a challenge. PV
installations produce most electricity around noon,
when solar insulation is high, while electricity
demand is usually low then. In addition, solar power
supply may be variable due to variations in cloud
coverage.
14
J. van der Kam M. and G. J. H. M. van Sark W..
Increasing Self-consumption of Photovoltaic Electricity by Storing Energy in Electric Vehicle using Smart Grid Technology in the Residential Sector - A
Model for Simulating Different Smart Grid Programs.
DOI: 10.5220/0004763000140020
In Proceedings of the 3rd International Conference on Smart Grids and Green IT Systems (SMARTGREENS-2014), pages 14-20
ISBN: 978-989-758-025-3
Copyright
c
2014 SCITEPRESS (Science and Technology Publications, Lda.)

Strategies to deal with these issues are for
instance demand response (DR) and electricity
storage (Castillo-Cagigal et al., 2011): in their paper
DR is defined as shifting load demand in order to
optimize electricity demand. Optimization goals are
for instance peak-shifting (flattening load demand
curve) or increasing self consumption (consumption
of locally produced electricity behind the meter) .
Smart grid technology combines the traditional
electricity grid or microgrid (a local, low-voltage
distritibution system) with information and
communication technologies in order to add
‘intelligence’ to the grid (Verbong et al., 2012). DR
is an essential aspect of smart grids, and is achieved
by turning appliances on and off within a certain
timeframe.
The main power grid can be used as virtual
storage for electricity. When supply is higher than
demand, electricity can be fed back and sold to the
grid and vice versa. This is an interesting option,
because in that case an expensive battery is not
needed. However, with increasing numbers of PV-
installations this strategy can become problematic,
because of the increased power transport over the
electricity grid. This will cause the need for more
investments in the grid in order to prevent overloads.
In response to this threat, several countries in Europe
have started implementing policies to stimulate self-
consumption (Castillo-Cagigal et al., 2011).
PV electricity could also be stored in EV
batteries. This way EVs can help increase self-
consumption. Furthermore, by using PV electricity
to power EVs GHG emissions for personal
transportation are reduced.
In this paper the potential of combining smart
grid technology with electricity storage in EVs for
increasing self-consumption in the residential sector
is investigated. This is done by creating a model of a
microgrid containing a household, solar panels and
an EV and simulating the effect on self-consumption
of PV-power of the system using smart grid
technology. The baseline for the potential is the
absence of a smart grid and is called “Uncontrolled
Charging”. The strategies investigated are “Real-
time Controlled Charging”, “Real-time Controlled
Charging and Discharging”, and “Linear
Programming”.
In section 2 the methodology is presented: it
includes the structure of the microgrid (2.1), the
proposed smart grid systems (2.2) and evaluation
method (2.3). In section 3 the first simulation results
are presented, analyzed and compared. Section 4
concludes the paper.
2 METHODOLOGY
The potential of increasing self-consumption by
storing PV energy in EVs is investigated by
performing computer simulations and evaluating the
results on performance indicators for self-
consumption and peak-reduction.
The basic input for the model is the total
electricity demand of households per time-step, the
supplied PV power per time-step and the technical
specifications and planned use (average trip
duration, distance and number of trips per week) of
the EVs. Based on these inputs the electricity
distribution for each time-step t is decided.
2.1 Micro-grid Model
The micro-grid contains a PV-installation, a
household with electricity demand, an EV and a
connection to the main grid; all elements are
connected. The PV-power and household electricity
demand are considered uncontrollable, Demand Side
Management is not taken into account here, while
the EV loading pattern is partly controllable and
partly uncontrollable (when energy is needed for
trips).
2.1.1 PV and Electricity Demand
The PV-installation provides electricity to the
microgrid. Data for PV-power profiles per time-step
is provided by Robin Berg from the company
LomboXnet. The dataset relates to a PV-installation
of 10 kWp in Utrecht, the Netherlands and is
available at hourly time resolution from July 6
th
2011 to December 31
st
2012. For this paper it is
assumed that the simulated household has 8 panels
of 250 Wp available, which leads to an estimated
annual yield of 1700 kWh assuming an annual yield
of 850 kWh/kWp, typical for the Netherlands.
The household has a certain electricity demand
profile that must be met at all times. Data for
household electricity demand is provided by Felix
Claessen and is based on measurements by Liander
(Claessen, 2012). The dataset relates to 400
households in the Netherlands and is available per
15 minutes for a week in February 2008. The weekly
data is repeated for a year multiplied by a factor per
week based on measurements from Liander in 2007.
In this research only the households are selected that
use 3500 20% kWh per year.
IncreasingSelf-consumptionofPhotovoltaicElectricitybyStoringEnergyinElectricVehicleusingSmartGrid
TechnologyintheResidentialSector-AModelforSimulatingDifferentSmartGridPrograms
15

2.1.2 Electric Vehicle
The battery of the EV is used as storage for excess
PV-power and energy can be extracted from it when
there is shortage of PV-power. The EV is also used
to make trips; energy needed to make trips is
considered inelastic demand and must be met at all
times. When an EV is on a trip it is not available to
exchange energy with the micro-grid. It is assumed
that on average three trips per week are made with
the EV, lasting between 4 and 8 hours, taking place
between 8:00 and 22:00 and using between 20% and
80% of the battery capacity.
Without a smart grid program, the EV, if
connected, will always charge until its full. This
strategie is called “Uncontrolled Charging” and is
represented by equation (1).
If E
EV
t 1
C
EV
t t
l
P
EV ,in
t
P
EV ,in,max
(1)
With E
EV
(t) the energy contained in EV-battery,
C
EV
the battery capacity, t
l
the time-steps for which
the EV is at the loading station, P
EV,in
(t) the EV
charging power and P
EV,in,max
(t) the maximum EV
charging power.
One EV is simulated, with technical
specifications based on Tesla Model S (Tesla, 2013).
The technical specifications are presented in table 1.
With E
EV,min
the minimum energy in EV-battery,
P
EV,out,max
(t) the maximum EV discharging power
and η
EV,in
and η
EV,out
the
(dis-)charging efficiency.
Table 1: Technical specifications of simulated EV.
C
EV
(kWh) 85
E
E
V
,
min
20% C
EV
Energy consumption (kWh/km) 0.2
Typical range (km) 340
P
E
V
,
in
,
max
and P
E
V
,
out
,
max
(kW) 22
E
V
,
in
and
E
V
,
out
80%
2.2 Smart Grid Programs
In this section several control algorithms for
electricity distribution within the micro-grid are
proposed. All control algorithms require trips to be
planned in advance. The minimum amount of energy
in the battery is 20% allowing for short emergency
trips.
2.2.1 Real-time Controlled Charging
“Real-time controlled charging” uses the difference
between P
PV
and P
load
for every time-step t. Based
on the energy content of the EV the loading pattern
is decided. In this algorithm, it is not possible to
extract energy from the EV in order to cover
electricity demand of the households.
First E
EV,req
, the minimum amount of energy in
the EV taking into account energy needed for trips
and maximum charging power, is defined in
equation (2).
If t t
E
EV ,trip
P
EV ,in,max
,t
trip
E
EV ,req
E
EV ,trip
P
EV ,in, max
t
trip
t
E
EV,min
If t t
E
EV ,trip
P
EV ,in,max
,t
trip
E
EV ,req
E
EV,min
(2)
With E
EV,trip
the total energy used for the trip and
t
trip
the start-time of the trip.
The loading pattern is then defined by equations
(3), (4), (5) and (6).
P
EV ,in
t
P
EV ,in,PV
t
P
EV ,in ,grid
t
(3)
If P
load
t
P
PV
t
E
EV
t 1
C
EV
t t
l
P
EV ,in,PV
t
EV ,in
P
PV
t
P
load
t
(4)
If E
EV
t
1
P
EV ,in,PV
t
E
EV ,req
t
t t
l
P
EV,grid
t
E
EV,req
t
E
EV
t 1
P
EV ,in,PV
t
(5)
P
EV ,in
t
P
EV ,in,max
(6)
With P
EV,in,PV
(t) the PV-power used for charging
the EV, P
EV,in,grid
(t) the power from the main grid
used for charging the EV, P
PV
(t) the available PV-
power and P
load
(t) the total load demand of the
household.
Equation (3) denotes that the EV is charged with
power from the PV-installations and from the grid. If
there is more PV-power than electricity demand, the
EV starts to charge until it is full or until there is no
more excess PV-power, see equation (4). The EV
only extracts energy from the grid when there is
shortage of PV-power in order to make a trip, see
equation (5). Finally, equation (6) makes sure the
total power into the EV cannot exceed the maximum
charging power.
2.2.2 Real-time Controlled Charging and
Discharging
This program uses the same equations as “real-time
controlled charging”, but is also able to extract
energy from the EV in order to cover electricity
demand of households. The additional equations are
presented in (7) and (8).
SMARTGREENS2014-3rdInternationalConferenceonSmartGridsandGreenITSystems
16

If P
load
t
P
PV
t
E
EV
t
1
E
EV ,req
t
t t
l
P
EV ,out
t
EV ,out
1
P
load
t
P
PV
t
(7)
P
EV ,out
t
P
EV ,out ,max
(8)
2.2.3 Linear Programming
Increasing self-consumption of PV-power by
controlling the loading pattern of an EV can be
described as a linear optimization problem and
solved by using linear programming. Linear
programming is a method to solve constrained
optimization problems. Constrained optimization is
a technique used often in research on smart grids.
Recent examples are Guo et al. (2012), Silva et al.
(2012), Tanaka et al. (2011), González Vayá and
Andersson (2012).
The variables used in the linear program are
P
EV,in,PV
(t), P
EV,grid
(t), P
EV,out
(t), for every time-step t.
In order to maximize self-consumption, the PV-
power used to charge the EV is maximized. This
results in the following problem:
max P
EV ,in ,PV
t
t
(9)
subject to the following constraints:
,, ,, ,,
,
E
VinPV EVingrid EVinmax l
PtP tP tt
(10)
,,,
,
E
V out EV out max l
P
tP tt
(11)
EV ,in
P
EV ,in,PV
t'
P
EV ,in,grid
t'
t' 1
t
EV ,out
1
P
EV ,out
t'
t' 1
t
E
EV ,req
t
E
EV ,trip
t
E
EV
0
, t t
l
(12)
EV ,in
P
EV ,in,PV
t'
P
EV ,in,grid
t'
t' 1
t
EV ,out
1
P
EV ,out
t'
t' 1
t
C
EV
t
E
EV ,trip
t
E
EV
0
, t t
l
(13)
P
EV ,in,PV
t
P
PV
t
P
load
t
, t t
l
(14)
P
EV
i
,out
P
load
t
P
PV
t
, t t
l
(15)
With dummy variable t’. Constraints (10) and
(11) ensure that the maximum (dis-)charging power
is not exceeded. Constraints (12) and (13) ensure
that the energy in the EV is sufficient for trips and
does not exceed the battery capacity. Constraints
(14) and (15) ensure that not more energy is (dis-
)charged then there is excess or shortage of PV-
power (when there is not enough PV-power for trips
energy is extracted from the grid). Furthermore, all
variables are non-negative.
Contrary to the real-time programs linear
programming is based on perfect information; all the
constraints are known for all time-steps t. However,
PV-supply and electricity demand are not known
exactly in advance. In order to provide realistic
prediction of how effective this program would be in
reality, some assumptions have been made. In this
paper, the method is called “realistic linear
programming”.
It is assumed that the calculations are made at
midnight and are based on the load pattern from the
previous day. An exception is made for weekends,
since weekend load demand differs significantly
from weekdays. However, the data is only available
for a week. Because of this predictions for Saturdays
will be based on data for Sundays and vice-versa.
The input for PV is based on PV-power predictions.
It is assumed that prediction deviates from the real
value with a standard deviation of 10%. This
results in the following equations:
P
load , prediction
t
P
load ,real
t 24h
(16)
P
PV,prediction
t
P
PV,real
t
10%
(17)
The linear program is then executed with the
predicted values, while it is evaluated with the real
values.
2.3 Evaluation
All programs are simulated for each month of the
year. Based on the simulations the potential of
increasing self-consumption (SC) is calculated.
Self-consumption is defined as the relative amount
of PV-power for period T, with starting point T0,
used by either the households or the EV, see
equation (18).
SC T
min P
PV
t
,P
load
t
P
EV
t
P
PV
t
t T0
T
(18)
A second indicator, relative peak reduction (RPR) is
also used for evaluation. RPR compares the
deviation from the average of the load demand for
the main grid P
grid,tot
(t), defined in equation (19),
with a control algorithm, denoted as P
grid,tot,control
(t),
to “uncontrolled charging”, denoted as P
grid,tot,no
control
(t), and is defined in equation (20):
IncreasingSelf-consumptionofPhotovoltaicElectricitybyStoringEnergyinElectricVehicleusingSmartGrid
TechnologyintheResidentialSector-AModelforSimulatingDifferentSmartGridPrograms
17
P
grid,tot
t
P
load
t
P
EV
t
P
PV
t
(19)
RPR T
P
grid ,tot,control
t
P
grid,tot,control
t
t T0
T
P
grid ,tot,no control
t
P
grid,tot,no control
t
t T0
T
(20)
So for example, an RPR-score of 1 indicates no
relative peak reduction compared to “uncontrolled
charging”, a RPR-score of 0 means load demand is
totally flat for that day and a RPR-score above 1
would mean that there are higher peaks compared to
“uncontrolled charging”.
3 RESULTS
In this section, the first results from simulations are
shown. The results are based on 20 simulations per
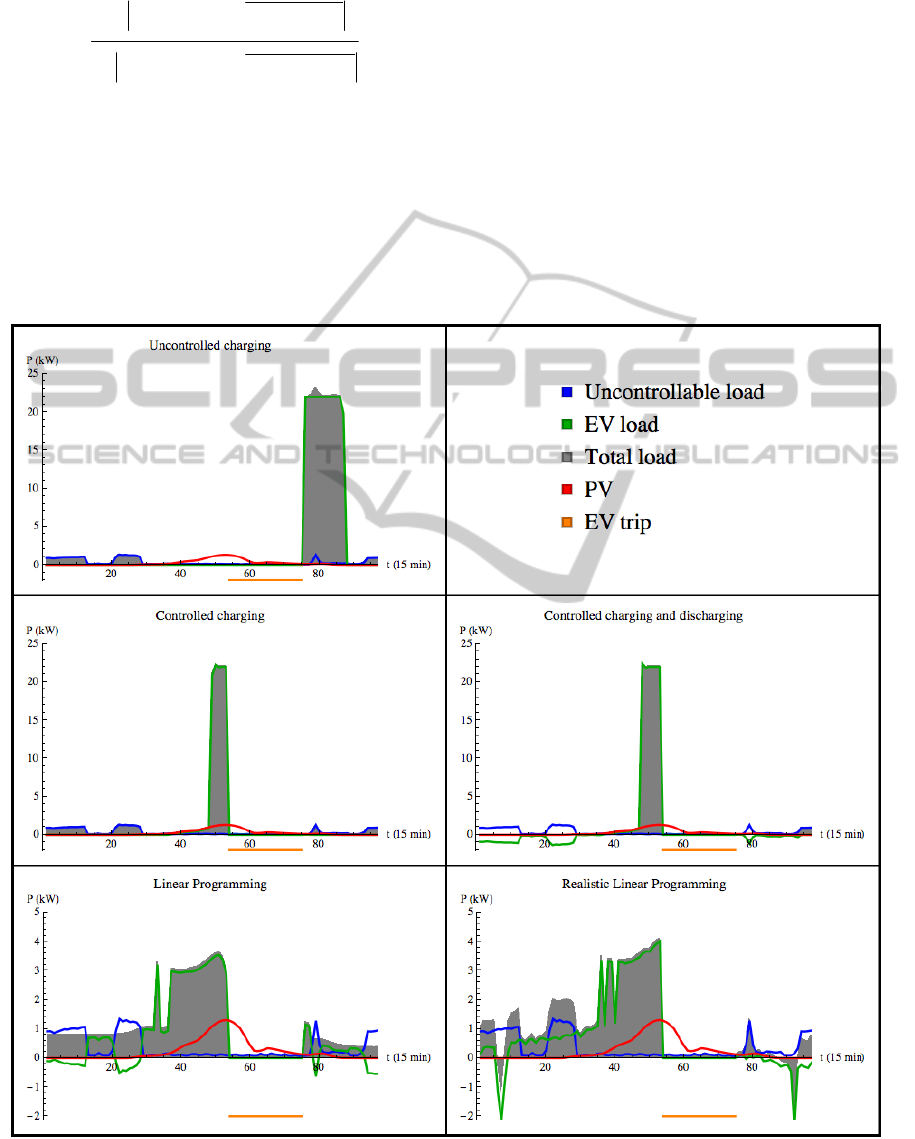
month for each smart grid program. In figure 1,
examples of individual runs for each program are
given. They are based on the same load and PV
profile and EV-trip.
In the case of “uncontrolled charging”, the EV
arrives home in the evening and starts charging
when there is no PV-power available. In the cases of
“Controlled charging” and “Controlled charging and
discharging” the EV only loads in times of excess
PV-power, but there is still a large peak in the
charging profile, since the EV needs to load much
Figure 1: Results of an individual full day run for each control algorithm. The orange bar shows the period during which the
EV is being used for a trip.
SMARTGREENS2014-3rdInternationalConferenceonSmartGridsandGreenITSystems
18
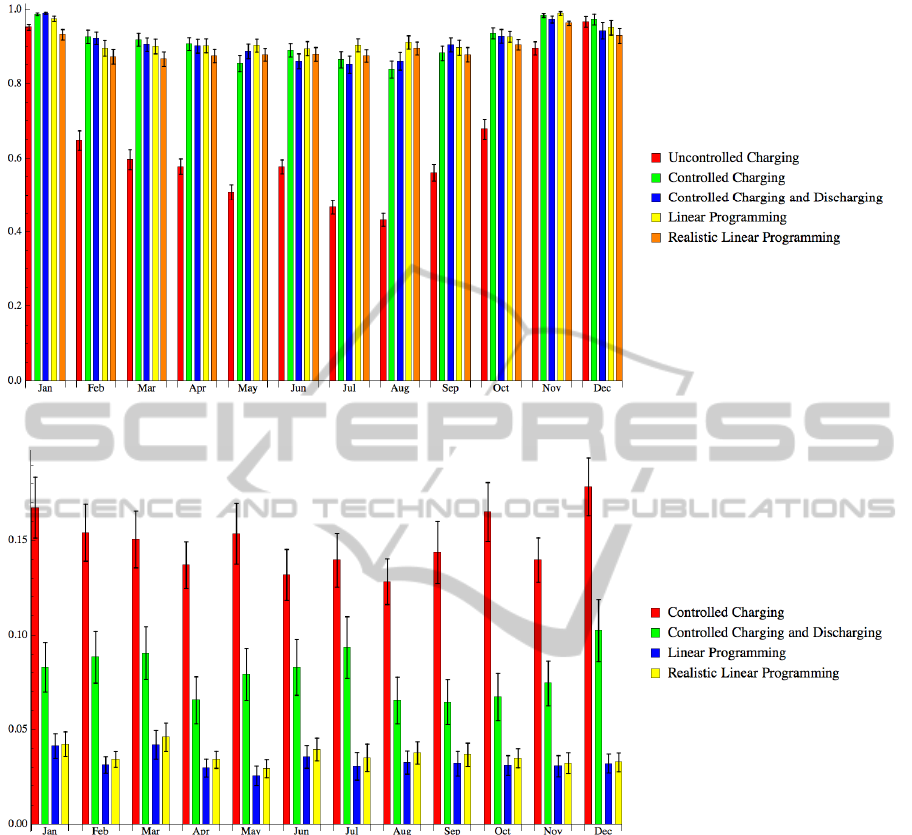
Figure 2: Mean self-consumption and standard deviation of 100 simulations of each control algorithm for each month.
Figure 3: Mean peak reduction and standard deviation of 100 simulations of each control algorithm for each month.
more than there is PV-power available. Note that the
latter total load is very small outside the peak.
For both programs using linear optimization the
peaks in energy use are much smaller than for the
other programs, since the EV never charges at full
power, but at 20-25%. Because the requirements for
the trip are still exactly planned in the realistic case,
there are no problems for EV-use. However, it does
not perform as well as the idealistic case, since
electricity is fed back to the grid when it could by
used to cover load demand.
In figure 2, results from 100 24 hour simulations
per month for each program evaluated for self-
consumption are shown. It can be seen that even
though all systems perform much better than a
system without a smart grid, it is difficult to tell
which system performs best for self-consumption.
The differences between the programs are large
when compared for peak reduction (figure 3),
showing that “linear programming” flattens the load
demand for the main grid significantly better than
the real-time algorithms.
4 CONCLUSIONS
In this paper several control algorithms for
increasing self-consumption of PV-power in the
residential sector, using smart grid technology and
electricity storage in an EV, were proposed. The first
simulations show that all proposed systems could
IncreasingSelf-consumptionofPhotovoltaicElectricitybyStoringEnergyinElectricVehicleusingSmartGrid
TechnologyintheResidentialSector-AModelforSimulatingDifferentSmartGridPrograms
19

significantly increase self-consumption. Though the
systems have distinctive characteristics for the
resulting EV charging profile, it is unclear which
system performs best based on the proposed
indicator for self-consumption. In order to
investigate this issue, more simulations must be
carried out.
However, when evaluated on peak reduction, the
differences are much more clear. “Linear
programming” is superior to the real-time algorithms
for peak reduction.
As a follow-up of this paper, an extensive
sensitivity analysis will be performed for the
following parameters: (a) amount of solar panels
(kWp), (b) average yearly household electricity use,
(c) technical specifications of the EV, (d) EV trips,
and (e) the standard deviation in PV-power
predictions. Nevertheless, based on our preliminary
results, it is shown that a microgrid using smart grid
technology and electricity storage in an EV could
significantly increase self-consumption of PV-power
in the residential sector.
ACKNOWLEDGEMENTS
The authors would like to thank Robin Berg and
Floris Bruning from LomboXnet for providing the
data used for the PV- installations and Felix
Claessen for providing the electricity demand data
for households.
REFERENCES
Bertoldi, P., Atanasiu, B., 2008. Electricity consumption
and efficiency trends in the enlarged European Union;
Status Report 2006, Institute for Environment and
Sustainability.
Castillo-Cagigal, M., Caamaño-Martín, E., Matallans, E.,
Masa-Bote, D., Gutiérrez, A., Monasterio-Huelin, F.,
Jiménez-Leube, J., 2011. PV self-consumption
optimization with storage and Active DSM, for the
residential sector, Solar Energy, Vol. 85, pp 2338-
2348.
Claessen, F. N., 2012. Smart grid control; An analysis of
control systems within a Dutch residential microgrid
incorporating decentralised renewable energy
resources, M.Sc. Thesis, Universiteit Utrecht.
E-laad, 2012. Belastingprofiel van het net bij
laadtransacties op laadpalen van stiching e-laad;
periode: oktober 2011 t/m December 2011, graphic,
retrieved 11-9-2013 from.
http://www.e-laad.nl/uploads/files/nieuws-
2012/Oktober/grafiek2.jpg.
Essen, H. van, and Kampman, B., 2011. Impacts of
Electric Vehicles – Summary report, Delft: CE Delft.
González Vayá, M., Andersson, G., (2012), Centralized
and decentralized approaches to smart charging of
plug-in vehicles, IEEE.
Guo, Y., Pan, M., Fang, Y., (2012), Optimal power
management of residential customers in the smart
gird, IEEE, Transactions on Parallel and Distributed
Systems, Vol. 23, No. 9.
Hoen A., 2009. CO
2
emission reduction in transport:
Confronting medium-term and long-term options for
achieving climate targets in the Netherlands, The
Hague, Environmental Assessment Agency.
International Energy Agency, 2012. Key World Energy
Statistics, retrieved 27-2-2013 from http://www.iea.org/
publications/freepublications/publication/kwes.pdf.
Silva, M., Morais, H., Vale, Z., (2012), An integrated
approach for distributed energy resource short-term
scheduling in smart grids considering realistic power
system simulation, Energy Conversion and
Management, Vol. 64, pp 273-288.
Tanaka, K., Yoza, A., Ogimi, K., Yona, A., Snjyu, T.,
Funabashi, T., Kim, C., (2012), Optimal operation of
DC smart house system by controllable loads based on
smart grid topology, Renewable Energy, Vol. 39, pp
132-139.
Tesla, 2013. Tesla Model S technical specifications,
retrieved 5-3-2013 from www.teslamotors.com.
Verbong, G. P. J., Beemsterboer, S., Sengers, F., 2012.
Smart grids of smart users? Involving users in
developing a low carbon electricity economy, Energy
Policy, Vol. 52, pp 117-125.
SMARTGREENS2014-3rdInternationalConferenceonSmartGridsandGreenITSystems
20
