
Emotional Valence Detection based on a Novel Wavelet Feature
Extraction Strategy using EEG Signals
Hao Zhang
1
, Shin’ichi Warisawa
1,2
and Ichiro Yamada
1,2
1
School of Engineering, The University of Tokyo, 7-3-1 Hongo, Bunkyo-ku, Tokyo, Japan
2
Graduate School of Frontier Science, The University of Tokyo, 5-1-5 Kashiwanoha, Kashiwa, Chiba, Japan
Keywords:
Emotion Assessment, Valence Detection, Brain-Computer Interface (BCI), EEG, Wavelet Feature, Probabilis-
tic Neural Network (PNN), Genetic Algorithm (GA).
Abstract:
This paper presents a novel feature extraction strategy in the time-frequency domain using discrete wavelet
transform (DWT) for valence level detection using electroencephalography (EEG) signals. Signals from dif-
ferent EEG electrodes are considered independently for the first time in order to find an optimum combination
through different levels of wavelet coefficients based on the genetic algorithm (GA). Thus, we take into consid-
eration useful information obtained from different frequency bands of brain activity along the scalp in valence
level detection, and we introduce a new set of features named the cross-level wavelet feature group (CLWF).
The effectiveness of this approach is strongly supported by the analytical results of experiments in which EEG
signals with valence level labels were collected from 50 healthy subjects. High accuracy was achieved for both
2-level (98%) and 3-level valence detection (90%) by applying leave-one-out cross validation using a proba-
bilistic neural network (PNN). In addition, light-weighted sets with less than half EEG recording electrodes are
proposed, which can achieve a high accuracy (86% for 3-level valence detection) with offering convenience
of users and reducing computational complexity.
1 INTRODUCTION
Emotion assessment is essential for gaining a deeper
understanding of human beings and preventing
lifestyle diseases. A large body of literature indicates
that negative emotions have harmful effects on peo-
ple’s health (Sirois, 2003), whereas positive emotions
foster good physical health (Salovey and Rothman,
2000).
Several emotion modeling approaches have been
proposed in the existing literature, including discrete
models (Darwin, 1872), appraisal models (Arnold,
1950), and dimensional models (Wundt, 1905). We
adopt a category of dimensional models that consider
multidimensional space, where each dimension repre-
sents a fundamental property shared among all emo-
tions in this study. Many researchers (Constantinou
et al., 2013) agree that emotions have at least two
indexes, including valence and arousal, and emotion
can therefore be represented through complex inter-
actions related to valence and arousal. In the emotion
model proposed by Russell (Russell, 1980), arousal
represents a quantity that varies from calm to ex-
citement, whereas valence represents a quantity that
varies from positive to negative.
In previous studies, the voice signal has been con-
sidered to be an effective signal for emotion related
analysis. An emotional valence detection system was
designed by using speech features with about 50%
accuracy (Tahon et al., 2012). A large number of
researchers have adopted physiological signals for
evaluating different levels of valence. Picard et al.
proposed a method for positive and negative classi-
fication with 87% accuracy using electromyography
(EMG), galvanic skin response (GSR), respiration,
blood volume pulse (BVP), and electrocardiogram
(ECG) signals (Picard et al., 2001). In this research,
we study the valence dimension of the emotion model
proposed by Russell, which is related to positive ver-
sus negative affect.
The interest in using electroencephalography
(EEG) for valence detection has increased recently
because of the latest significant developments in
brain-computer-interface (BCI) research. The fact is
that ignoring a user’s emotional state with any inter-
face dramatically impedes the performance and leads
to a bad user experience. BCI systems are now be-
ing developed for a wide range of applications in ar-
52
Zhang H., Warisawa S. and Yamada I..
Emotional Valence Detection based on a Novel Wavelet Feature Extraction Strategy using EEG Signals.
DOI: 10.5220/0004764600520059
In Proceedings of the International Conference on Health Informatics (HEALTHINF-2014), pages 52-59
ISBN: 978-989-758-010-9
Copyright
c
2014 SCITEPRESS (Science and Technology Publications, Lda.)

eas such as healthcare, gaming, security, and mar-
keting. These applications can benefit largely from
knowing and adapting their operations according to
users’ emotional states. This emotion information can
then be utilized to provide a better user experience by
controlling the BCI through affect. It has been shown
that a correlation exists between emotions and brain
activity (Nardi, 2011), especially in the prefrontal
cortex and the amygdala (Adolphs et al., 2003). A
small amount of research on emotion related classi-
fication is based on EEG, and most of this research
has not been able to obtain good results compared
with the performance using other physiological sig-
nals. Based on the asymmetry represented by EEG
signals, the mean accuracy for three valence classes
(negative, neutral, and positive) of picture stimula-
tions was reported to be 44% based on frequency do-
main features and 49% based on combining time and
frequency domain EEG features(Schaaff and Schultz,
2009). By combining EEG and some physiological
signals (heart rate and pulse), Takahashi and Tsuk-
aguchi achieved a recognition rate of 62.3% with a
neural network (NN) classifier and 59.7% with a sup-
port vector machine (SVM) for classifying pleasure
and displeasure (Takahashi and Tsukaguchi, 2003).
Hosseini adopted entropy analysis of EEG signals and
achieved pleasure and displeasure classification with
an accuracy of 72.35% using SVM (Hosseini, 2011).
The objective of this study was to find effective
features and to formulate a robust method that can
distinguish between different valence levels with high
accuracy from EEG signals. Affective pictures were
adopted in this research to elicit different valence lev-
els. In section II, the experimental design and record-
ing protocol are introduced. In section III and IV, the
analytical model including feature extraction and op-
timization is described. The results are discussed in
section V, and finally, in section VI, conclusions that
have been drawn based on the proposed research and
perspectives are discussed.
2 EXPERIMENTAL DESIGN
2.1 Valence Elicitation
Three levels of valence have been defined based
on arousal-valence space based on the emotion
model proposed by Russell (Russell, 1980). The
most widely adopted emotion elicitation technique
is to use pictures to evoke various emotion states
based on valence-arousal space (Katsis et al., 2011).
We adopted a very popular picture-based, emotion-
evoking database called the International Affective
Picture System (IAPS) (Lang et al., 2008), which
contains pictures labeled with values of valence and
arousal. We chose pictures with a small range of va-
lence values but a large variance of arousal values in
order to collect data that would ensure a robust model
of valence detection. The IAPS labels respective pic-
tures for males and females, so we selected differ-
ent pictures for male and female subjects in order to
achieve the same valence level elicitation. The posi-
tioning in terms of valence and arousal of the pictures
selected for the three levels of valence is illustrated
in Fig. 1 against all pictures for males and females,
respectively.
Valence
Valence
Arousal
Arousal
Group 1
Group 2
Figure 1: Two groups of pictures selected from IAPS for va-
lence stimulation for Females (Group 1) and Males (Group
2). The red dots represent the pictures selected from IAPS
among all pictures, shown as gray dots.
2.2 Experimental Protocols
The experiments were designed to stimulate a certain
level of valence from viewing multiple pictures from
the IAPS database. The subjects were required to sit
in a dark room and look at the pictures that appeared
on a screen. The protocol of the stimulation proce-
dure used with each subject is illustrated in Fig. 2.
We collected EEG signals from 50 healthy Japanese
subjects (35 males and 15 females). The ages of the
subjects ranged from the 20s to the 70s. The EEG
signals were recorded by a Nihon kohden EEG-1200
using electrodes placed according to the international
10-20 system; the sampling rate of EEG signal acqui-
sition was 1000 Hz. This experiment was conducted
with the permission from Research Ethics and Safety
committee of The University of Tokyo.
2.3 EEG Dataset
EEG signals are affected by noise such as pulses, line
noise, and artifacts. The noise generated from eye
blinks is the most difficult type to deal with by using
signal processing techniques such as wavelet analy-
sis. For this reason, the subjects were asked to refrain
from blinking their eyes during the experiments. A fil-
ter was applied to delete the line noise at 50 Hz. Previ-
ous research (Murugappan et al., 2010) shows that the
EmotionalValenceDetectionbasedonaNovelWaveletFeatureExtractionStrategyusingEEGSignals
53
Pic1
Pic2
Pic10Pic3
10 s per picture
Pic11
Pic12
Pic20Pic13
10 s per picture
Pic21
Pic22
Pic30Pic23
10 s per picture
3 min. rest
3 min. rest
Level 1
s!mula!on
Level 2
s!mula!on
Level 3
s!mula!on
Figure 2: Valence stimulation procedure.
emotions are not only correlated to the brain activity
recorded in the frontal area but also to that recorded
in other areas, and therefore, higher accuracy was ob-
tained by using EEG electrodes along all the scalp.
We used 16 channels (Fp1, Fp2, F3, F4, C3, C4, P3,
P4, O1, O2, F7, F8, T3, T4, T5, T6) for analysis based
on the International 10-20 system. On the basis of
the correlation theory of brain activity asymmetry and
emotions (Alves et al., 2008), our approach is to com-
pare the frontal area, the posterior area, and the en-
tire area of brain activity with electrodes on both left
and right brain hemispheres, and this approach gains
a better understanding of how emotion states can be
interpreted using EEG signals in different areas. The
test cases using different combinations of EEG elec-
trodes are illustrated in Fig. 3.
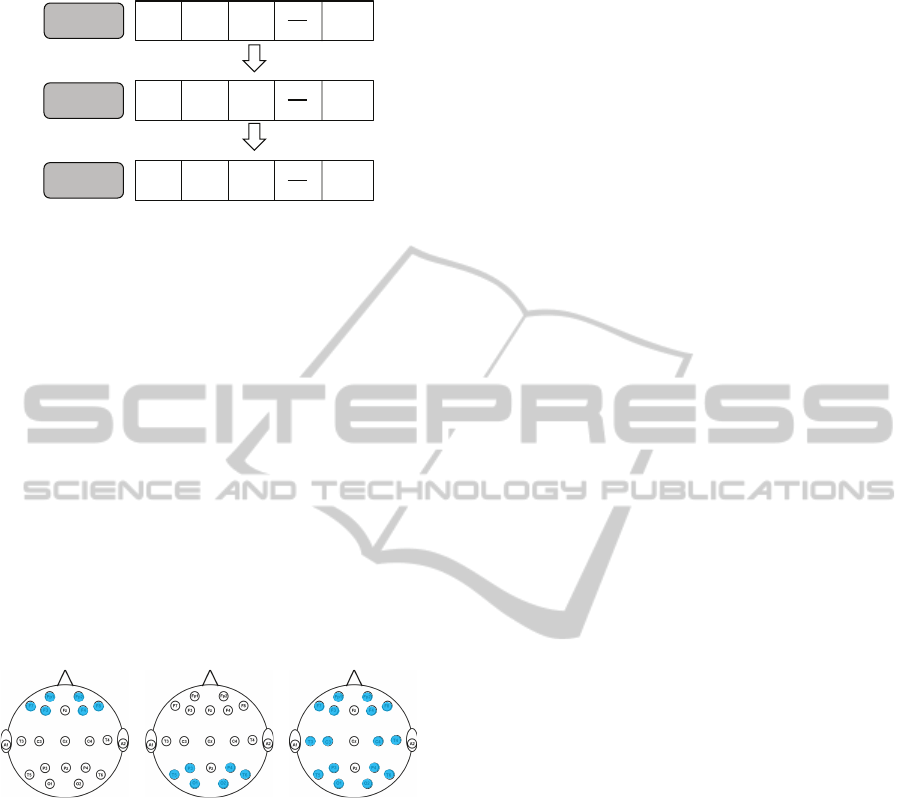
Frontal Area (FA) Posterior Area (PA) Entire Area (EA)
Figure 3: Test cases of brain activity in different areas.
3 METHODS
3.1 Wavelet Analysis
We adopted discrete wavelet decomposition (Morlet,
1984) to better understand the frequency and location
information of the EEG signals. The discrete wavelet
decomposition definition is expressed as
T
m,n
=
Z
∞
−∞
f (t)ψ
m,n
(t)dt, (1)
ψ
m,n
(t) = a
−m/2
0
ψ(a
−m
0
t − nb
0
), (2)
where ψ
m,n
(t) is a wavelet mother function, the in-
teger m controls wavelet dilation, and n controls trans-
lation. Here, a
0
is a specified fixed dilation setup
parameter set at a value greater than 1, and b
0
is
the location parameter, which must be greater than 0.
Also, T
m,n
are the discrete wavelet values given on a
scale-location grid of index m,n, which are known as
wavelet coefficients or detail coefficients.
Wavelet analysis has been successfully used for
feature extraction and for many classification tasks
based on EEG (Sherwood, 2009). No objective
method for mother wavelet selection has been devel-
oped so far for classification, and the methods are
mostly empirical. We selected Daubechies 5 wavelet
(Db5) since it has been adopted successfully for mod-
eling complex signals such as EEG signals (Liu and
Xu, 2010), and we applied seven levels of wavelet de-
composition, which is determined by taking the EEG
frequency bands into consideration.
3.2 Statistical Parameters
Statistical parameters shows effectiveness on demon-
strating affective states from physiological signals
(Van den Broek and Westerink, 2009). Several statis-
tical parameters including mean, standard deviation
(std), skewness, and kurtosis are used in this study to
demonstrate the characteristics of transformed EEG
signals using discrete wavelet decomposition.
3.3 Genetic Algorithm (GA)
We adopted a genetic algorithm (Holland, 1975) for
feature selection. The GA mimics the process of nat-
ural evolution to find beneficial adaptations to a com-
plex environment. A chromosome in GA is an en-
coding that represents the decision variable of an op-
timization problem. A finite set of chromosomes in
GA is called a population. Each chromosome is rated
by the fitness function on its ‘fitness’, which deter-
mines how good it is in solving the optimization prob-
lem. Crossover refers to the generation of two new
offspring by mating two parental chromosomes. A
mutation simply flips randomly the binary value of
one or more bits. Crossover and mutation provide op-
portunities for chromosomes that have higher fitness
values to evolve.
The reasons why we adopt GA are shown in the
following. According to previous studies, the corre-
lation theory of brain activities asymmetry and emo-
tions were proved by researchers (Alves et al., 2008).
GA allows us to realize our proposal to select ap-
propriate information from each EEG electrode and
eventually obtain the overall pattern of brain activ-
ities monitored by multiple EEG electrodes. Other
data-driven feature selection approaches cannot give
attention to the overall pattern of brain activities. The
HEALTHINF2014-InternationalConferenceonHealthInformatics
54

selected features can be only extracted from one or
several EEG electrodes so that it fails to demonstrate
the whole brain activities asymmetry since there is
no priori biological knowledge applied on those al-
gorithms. These considerations are supported by a re-
cent paper proposed in a similar application concern-
ing neuroimaging (Chu et al., 2012), as they have two
findings related to feature selection including data-
driven feature selection was no better than adopting
whole data and a priori biological knowledge was ef-
fective to guide feature selection. As for the imple-
mentation of GA with proposed features, we general-
ized our problem of wavelet level selection according
to different EEG positions to an optimization issue of
minimizing the fitness function.
3.4 Principal Component Analysis
(PCA)
PCA (Jolliffe, 2002) is a common visualization
method that is applied through dimensionality reduc-
tion by performing a covariance analysis between fac-
tors. Technically, a principal component can be de-
fined as a linear combination of optimally weighted
observed variables, the first k principal components
capture the greatest variance in the data among all k-
dimensional orthonormal linear combinations of the
original variables. In our case, PCA was used for fea-
ture space visualization to observe the separability of
different valence levels by specific features.
3.5 Probabilistic Neural Network (PNN)
Artificial neural networks are effective when used
with such signals as EEG since they are very robust in
dealing with non-linear and complex signals. More-
over, the fault tolerance of artificial neural networks
is necessary in order to reduce the influence of noise.
PNN (Specht, 1990) is one kind of artificial neural
network that has been proven to be suitable for clas-
sification tasks by many researchers (Sivakumar and
.Kannan, 2009). The operations are designed into a
multi-layered feed-forward network with four layers.
In this work, PNN is adopted considering its charac-
teristics of fast training process and additional train-
ing samples can be added without extensive retrain-
ing, which make it practical for model improvement
when we have large training database. The inputs of
PNN were the optimized features, and the output was
the predicted valence level.
4 IMPLEMENTATION
4.1 Cross-level Wavelet Feature
Extraction
The statistical parameters have been shown to be use-
ful for extracting features from raw or processed EEG
signals. Although time or frequency domain features
from EEG signals failed to provide good accuracy
for valence detection (Schaaff and Schultz, 2009),
(Takahashi and Tsukaguchi, 2003), (Hosseini, 2011),
we explore new possibilities in time-frequency do-
main features. Murugappan et al. conducted a study
on clustering different emotions by wavelet features
from EEG signals using 24 and 63 channels (Muru-
gappan et al., 2007) and represented the potential of
time-frequency features for identifying emotions. The
theory of wavelet decomposition can roughly takes
into consideration EEG frequency bands. The fre-
quency information of each decomposition level is
listed in Table 1.
Table 1: Frequency range of different wavelet decomposi-
tion levels with EEG frequency band information.
Decomposition Frequency EEG frequency
level range (Hz) band
A7 0-4 Delta
D7 4-8 Theta
D6 8-16 Alpha
D5 16-32 Beta
D4 32-63 Low gamma
D3 63-125 High gamma
D2 125-250 —
D1 250-500 —
Our strategy is to formulate a novel cross-level
wavelet feature group (CLWF) for valence detection
based on GA, as opposed to the strategy of extracting
a mono-level wavelet feature group (MLWF). EEG
consists of a multi-channel system that can record a
great deal of information with a lot of noise. Much
research has focused on how to omit a number of
electrodes and select the most useful ones in order
to achieve a moderate level of performance (Arvaneh
et al., 2011). The studies that have adopted wavelet
features have only considered a single decomposition
level or have combined levels from all EEG electrodes
(Sherwood, 2009). However, those studies ignore the
fact that useful information for classification may be
represented in different frequency ranges among dif-
ferent EEG electrodes. If we implement this idea
EmotionalValenceDetectionbasedonaNovelWaveletFeatureExtractionStrategyusingEEGSignals
55
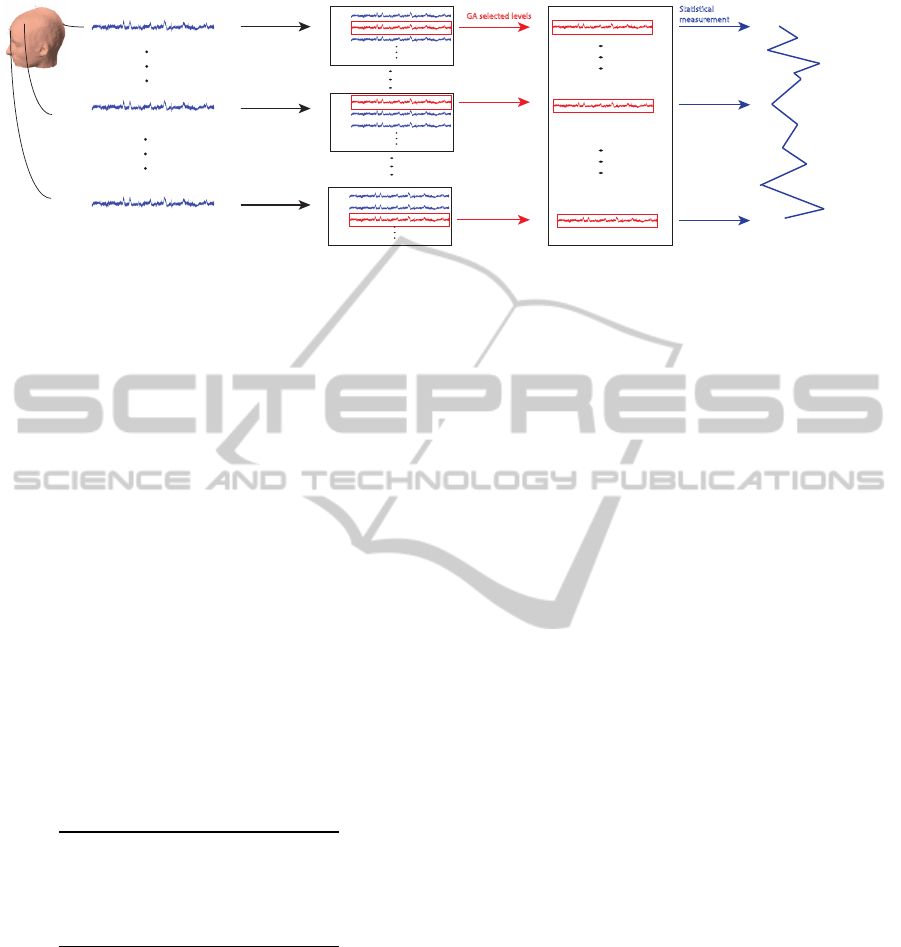
O2
EEG signals
F3
Fp1
Wavelet
Decomposed signals
D1
D2
D3
D1
D2
D3
D1
D2
D3
GA selected levels
Cross-level signals
D2 of EEG signal in O2
D1 of EEG signal in F3
D3 of EEG signal in Fp1
Statistical
measurement
Cross-level features
Figure 4: Schematic of cross-level wavelet feature estimation from EEG signals.
by a brute-force search, the order of magnitude for
the searching cases will be n
m
, where m is the num-
ber of EEG electrodes, and n represents the levels of
wavelet decomposition. For instance, there will be
152,587,890,625 cases with 16 EEG electrodes and 5
levels of wavelet decomposition, which makes it ex-
tremely difficult to find the optimized feature combi-
nations. Thus, GA is introduced in this step to solve
this optimization issue. The fitness function is de-
signed as Eq. 3.
Fitness = 1 −Accuracy (3)
Accuracy is calculated using the leave-one-out cross
validation (LOOCV) method based on PNN. The in-
put feature for GA is a matrix with n levels of wavelet
decomposition for all EEG electrodes. A chromo-
some is an array of numbers that represent levels of
wavelet coefficients related to EEG electrodes; the
GA will select one level from each electrode to formu-
late the optimized CLWF. GA parameters are given in
Table 2.
Table 2: GA parameters.
Population size 10 chromosomes
Elite count 2
Mutation rate 0.01
Crossover rate 0.8
A relatively limited population size and high mu-
tation rate as well as the LOOCV design in the fit-
ness function are for preventing overfitting in GA. A
schematic of the entire process of feature estimation is
illustrated in Fig. 4. In this figure, EEG signals from
positions O2, F3, and Fp1 are used as examples to il-
lustrate the feature extraction process. The best com-
bination of wavelet coefficients (those indicated in red
in Fig. 4) are selected based on GA from a huge num-
ber of combinations, and the statistical parameters are
calculated for a later classification process.
4.2 Reduced Set of EEG Electrodes
We explore different sets of EEG electrodes to fur-
ther understand the functional area for emotional ac-
tivities, and reduce the number of EEG electrodes for
the convenience of users and computational simplic-
ity. Besides two comparison sets of frontal and poste-
rior areas, the same GA approach is performed to find
another optimized set of EEG electrodes placement
for each subject. The input for GA is a matrix with
n levels of wavelet decomposition for all EEG elec-
trodes; the GA will select less than a certain number
of electrodes for the reduced set. Multiple electrodes
are needed to understand the difference of brain activ-
ities in different brain areas, we consider 6 electrodes
are appropriate based on preliminary attempts and for
comparisons with the other two sets using 6 electrodes
mentioned in Fig. 3.
4.3 Classification
Since each EEG record corresponds to a picture stim-
ulation from IAPS, it is easy to give labels to the clas-
sification tasks. The approach is to consider two test-
ing scenarios for each individual including two va-
lence levels (level 1: displeasure, level 3: pleasure)
and three valence levels (level 1: displeasure, level 2:
neutral, level 3: pleasure) for model validation by cal-
culating the accuracy based on LOOCV using PNN.
5 RESULTS AND DISCUSSION
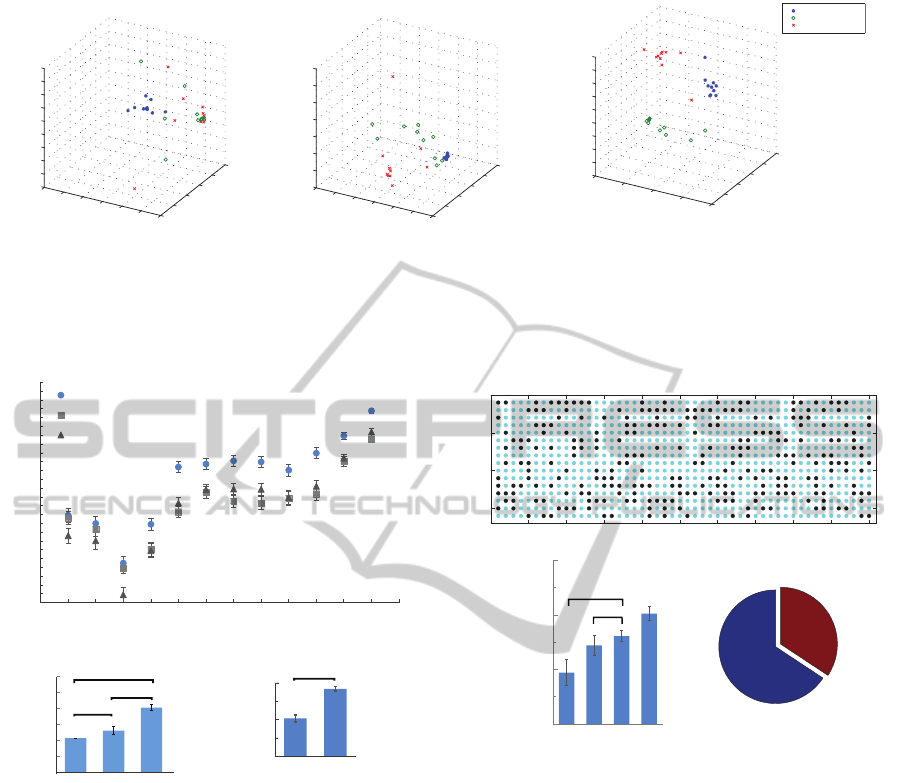
Our goal was to formulate robust features for valence
detection using EEG signals, so the discernibility of
different valence levels achieved by the proposed fea-
tures was visualized using PCA. From the PCA re-
sults shown in Fig. 5, we cannot observe any dis-
tinct structures in feature space by using statistical
HEALTHINF2014-InternationalConferenceonHealthInformatics
56
−1
−0.5
0
0.5
1
1.5
2
−0.5
0
0.5
1
1.5
2
−0.8
−0.6
−0.4
−0.2
0
0.2
0.4
0.6
0.8
1
1st princ
ipal co
mponent
3rd principal component
2nd principal c
omponent
1st princ
ipal co
mponent
3rd principal component
−1
−0.5
0
0.5
1
1.5
2
−1.5
−1
−0.5
0
0.5
1
−0.4
−0.2
0
0.2
0.4
0.6
0.8
1
−1
−0.5
0
0.5
1
−0.6
−0.4
−0.2
0
0.2
0.4
−0.3
−0.25
−0.2
−0.15
−0.1
−0.05
0
0.05
0.1
0.15
Valence level 1
Valence level 2
Valence level 3
2nd principal component
1st princ
ipal co
mponent
3rd principal component
2nd principal component
2nd principal component
1st princ
ipal co
mponent
3rd principal component
a b c
Figure 5: Visualization of feature space using PCA. a, First 3 principal components of features (std) calculated from raw
EEG signals. b, First 3 principal components of MLWF, which were the std calculated using the best performance level
after wavelet decomposition. c, First 3 principal components of CLWF, which were the std calculated using the cross-level
decomposed signals from discrete wavelet decomposition selected using GA.
1 2 3
****
*****
*****
Frontal
P
o
sterior
E
n
tire
Average accuracy (%)
1 2
*****
Average accuracy (%)
3-level
2-level
b
c
0 1 2 3 4 5 6 7 8 9 10 11 12 13
Entire
Posterior
Frontal
Raw
A
7
D7
D6
D5
D4
D3
D2
D1
D1-D5
MLWF
CLWF
Average accuracy (%)
Feature groups
EEG sets
No. of levels
a
Figure 6: Average results for valence detection on 50
participants using different feature groups and EEG sets.
a, Average accuracy for 3-level valence detection using
12 different feature groups (mean ± s.e.m). b, Com-
parisons of effectiveness for 3-level valence detection us-
ing EEG signals in different brain areas by proposed fea-
tures (CLWF); ****p<0.00001, *****p<0.000001 by ana-
ysis of variance (ANOVA) plus Tukey’s Honestly Signifi-
cant Difference (HSD) test. c, Comparison of 2-level (L1:
98.4% and L3: 97.8% respectively) and 3-level (L1: 94.0%,
L2: 86.6%, and L3: 90.2% respectively) overall valence
classification accuracy using proposed features (CLWF);
*****p<0.000001 by paired t-test.
measurements such as mean, kurtosis, and skewness
based on raw EEG signals, but a clearer structure
can be observed using statistical measurement std, al-
though there are also overlaps between different va-
lence levels (Fig. 5a). We confirmed from the test
0 5 10 15 20 25 30 35 40 45 50
0
5
10
15
EEG electrode no.
Subject no.
Frontal electrodes 65.7%
Posterior electrodes 34.3%
1 2 3 4
****
****
Frontal
Posterior
Entire
GA-reduced
Average accuracy (%)
a
b c
Figure 7: GA based EEG electrodes reduction. a, GA-
reduced EEG electrodes distribution; no. 1-16: Fp1,
Fp2, F3, F4, C3, C4, P3, P4, O1, O2, F7, F8, T3, T4,
T5, T6. b, Comparison results of GA-reduced EEG sets;
****p<0.00001 by ANOVA plus Tukey’s HSD throughout
the figure. c, Selected electrodes’ brain area summary.
results on the simplest two-level valence detection,
80% accuracy was obtained by using std, while near
or slightly better than chance accuracy (ranging from
50% to 60%) was obtained by using the other three
statistical measurements.
Based on these facts, std was selected for fur-
ther analysis in order to develop our new strategy
for feature extraction. After applying wavelet de-
composition, we tested the performance using PNN
by LOOCV and selected the optimum performance
wavelet decomposed level. Then the features were vi-
sualized using PCA (Fig. 5b), which indicates that the
discernibility was further improved compared to the
original features extracted based on raw EEG signals.
EmotionalValenceDetectionbasedonaNovelWaveletFeatureExtractionStrategyusingEEGSignals
57

Fig. 5c illustrates the proposed cross-level wavelet
features in this work. We obtained clearer clusters
by plotting them using the first three principal com-
ponents, which proves the robustness of the proposed
strategy to extract features. Fig. 6a shows the aver-
age accuracy by adopting different groups of features
for three valence levels classification. To study the re-
sults illustrated by Fig. 6a, we firstly apply analysis of
variance (ANOVA) to check if the means representing
average accuracy are unequal. It turns out that at lease
one mean is different by p<0.000001, and then we
apply Tukey’s Honestly Significant Difference (HSD)
test to find which means are unequal. We found that
every pair of means including proposed feature group
are significantly different by p<0.000001. Some pairs
of means are not significantly different by the condi-
tion of p>0.05, they are A7 and D6, Raw and D6,
Raw and A7, pairs between D1, D2, D3, D4, and D5.
Generally, the EEG signals from the frontal area
are more effective for valence detection than the ones
from the posterior area. However, just as in the re-
search results demonstrated by Murugappan et al.
(Murugappan et al., 2007), (Murugappan et al., 2010),
our classification results also indicate that the accu-
racy can be improved by covering the entire area
with more EEG electrodes. Fig. 6b shows compar-
isons using data from frontal area, posterior area, and
entire area of EEG signals with p<0.00001 for all
pairwise comparisons by ANOVA plus Tukey’s HSD.
Our findings are also consistent with the emotion the-
ory proposed by Heller, which argues that the frontal
and parieto-temporal regions are involved in emotion
(Heller, 1993).
Our proposed cross-level wavelet feature group
(CLWF) that is searched from D1 − D5 (higher EEG
frequency bands that can produce much better av-
erage accuracy from different EEG electrodes based
on GA can largely improve the classification perfor-
mance to an accuracy of 98% with two-level and 90%
with three-level valence detection. Fig. 6c illus-
trates the comparison of 2-level and 3-level valence
detection using proposed features with p<0.000001
by paired t-test. In contrast, the accuracy can be im-
proved very much comparing to simply combining
all the levels from D1 − D5 shown in Fig. 6a. The
results demonstrate the importance and practicability
of the cross-level strategy for extracting features in
the time-frequency domain for valence level detection
using EEG signals. Our analytical results that pro-
vide higher accuracy by using EEG signals collected
from the entire area are consistent with an important
statement in Borod’s emotion model (Borod, 1992),
in which emotions are represented in cortico-limbic
networks rather than in particular areas of the brain.
Electrodes selected by GA for each subject are il-
lustrated in Fig. 7a in which a blue dot indicates “a se-
lected electrode” and the results using the reduced set
of EEG electrodes for 3-level emotional valence de-
tection are illustrated in Fig. 7b for comparisons with
other set of electrodes. As we can see, a better accu-
racy (86.1%) can be achieved using the reduced set of
EEG electrodes compared with frontal and posterior
area EEG electrodes. Another finding shown in Fig.
7c from statistical summarization of the electrodes se-
lected from 50 subjects shows that more frontal area
electrodes (65.7%) are selected compared with pos-
terior area electrodes (34.3%), which is also consis-
tent with the viewpoint that frontal area brain activi-
ties can better demonstrate emotion (Heller, 1993).
6 CONCLUSIONS AND FUTURE
WORK
We proposed a new strategy to extract time-frequency
domain features from EEG signals in cross levels
of wavelet decomposition coefficients with different
EEG electrodes for valence level detection. The pro-
posed features (CLWF) substantially increase the ac-
curacy compared to conventional features extracted
directly from EEG signals or from transformed sig-
nals in the time-frequency domain. We achieved 83%
accuracy using 6 EEG electrodes and 90% accuracy
using 16 EEG electrodes for three-level valence de-
tection, and 97% accuracy using 6 electrodes and 98%
accuracy using 16 electrodes for two-level valence de-
tection by using the proposed features.
The results show the importance of taking into
consideration information in different frequency
bands with different EEG electrodes, as it results in
higher accuracy than that achieved when only con-
sidering a single level or combined levels of wavelet
decomposed signals from different EEG electrodes.
A GA-reduced light-weight set of EEG electrodes is
also proposed with competitive accuracy (86%) for
3-level valence detection for increasing usability and
further reducing computational complexity. Future
work on interpreting the physiological meanings will
be necessary and a user-independent model will be
proposed based on EEG for valence detection.
The results achieved in this research would be in-
terests of practitioners in a number of related field
such as health informatics and BCI. This work gives
hints of many paths for future model development.
We emphasize a work with more comprehensive
study of applying different machine learning tech-
nologies on our new proposed features.
HEALTHINF2014-InternationalConferenceonHealthInformatics
58

REFERENCES
Adolphs, R., Tranel, D., and Damasio, A. R. (2003). Disso-
ciable neural systems for recognizing emotions. Brain
and Cognition, 52(1):61–69.
Alves, N. T., Fukusima, S. S., and Aznar-Casanova, J. A.
(2008). Models of brain asymmetry in emotional pro-
cessing. Psychology & Neuroscience, 1(1):63–66.
Arnold, M. (1950). An Excitatory Theory of Emotion.
McGraw-Hill, New York, xxiii edition.
Arvaneh, M., Guan, C., Ang, K. K., and Quek, C. (2011).
Optimizing the channel selection and classification
accuracy in eeg-based bci. IEEE Transactions on
Biomedical Engineering, 58(6):1865–1873.
Borod, J. C. (1992). Interhemispheric and intrahemispheric
control of emotion: a focus on unilateral brain dam-
age. J Consult Clin Psychol, 60(3):339–348.
Chu, C., Hsu, A.-l., Chou, K.-h., Bandettini, P., and Lin, C.
(2012). NeuroImage Does feature selection improve
classification accuracy? Impact of sample size and
feature selection on classification using anatomical
magnetic resonance images. NeuroImage, 60(1):59–
70.
Constantinou, E., Bogaerts, K., Diest, L. V., and den Bergh,
O. V. (2013). Inducing symptoms in high symptom re-
porters via emotional pictures: The interactive effects
of valence and arousal. Journal of Psychosomatic Re-
search, 74(3):191–196.
Darwin, C. (1872). The Expression of the Emotions in Man
and Animals, with an Introduction, Afterword, and
Commentaries by Paul Ekman. Oxford Univ Press,
Oxford, 3rd edition.
Heller, W. (1993). Neuropsychological mechanisms of
individual differences in emotion, personality, and
arousal. Neuropsychology, 7,:476–489.
Holland, J. H. (1975). Adaptation in Neural and Artificial
Systems. University of Michigan Press, Ann Arbor,
Michigan, 1st edition.
Hosseini, S. A. (2011). Emotion recognition method using
entropy analysis of eeg signals. International Journal
of Images, Graphics, and Signal Processing, 3(5):30–
36.
Jolliffe, I. T. (2002). Principal Component Analysis.
Springer,, 2nd edition.
Katsis, C., Katertsidis, N., and Fotiadis, D. (2011). An in-
tegrated system based on physiological signals for the
assessment of affective states in patients with anxiety
disorders. Biomedical Signal Processing and Control,
6:261–268.
Lang, P. J., Bradley, M. M., and Cuthbert, B. N. (2008). In-
ternational affective picture system (iaps): Technical
manual and affective ratings. Technical Report A-8.
Liu, J. and Xu, J. (2010). Compared study of the analyzing
methods for eeg data. In Proc. of 3rd IEEE Interna-
tional Conference on Computer Science and Informa-
tion Technology, volume 9, pages 445–448.
Morlet, J. (1984). Decomposition of hardy functions into
square integrable wavelets of constant shape. SIAM.
Math. Anal, 15(4):723–736.
Murugappan, M., Ramachandran, N., and Sazali, Y. (2010).
Classification of human emotion from eeg using dis-
crete wavelet transform. Journal of Biomedical Sci-
ence and Engineering, 3:390–396.
Murugappan, M., Rizon, M., Nagarajan, R., Yaacob, S., Zu-
naidi, I., and Hazry, D. (2007). Eeg feature extraction
for classifying emotions using fcm and fkm. Inter-
national Journal of Computers and Communications,
1(2):299–304.
Nardi, D. (2011). Neuroscience of Personality: Brain Savvy
Insights for All Types of People. Radiance House, 1.0
edition.
Picard, R. W., Vyzas, E., and Healey, J. (2001). Toward
machine emotional intelligence: analysis of affective
physiological state. IEEE Transactions on Pattern
Analysis and Machine Intelligence, 23(1):1175–1191.
Russell, J. (1980). A circumplex model of affect. Journal of
Personality and Social Psychology, 39(6):1161–1178.
Salovey, P. and Rothman, A. J. (2000). Emotional states
and physical health. The American psychologist,
55(1):110–121.
Schaaff, K. and Schultz, T. (2009). Towards emotion recog-
nition from electroencephalography signals. In 3rd
International Conference on Affective Computing and
Intelligent Interaction. Institute of Electrical and Elec-
tronics Engineers.
Sherwood, J. (2009). On classifiability of wavelet fea-
tures for eeg-based brain-computer interfaces. In Pro-
ceedings of International Joint Conference on Neural
Networks. Institute of Electrical and Electronics Engi-
neers.
Sirois, B. C. (2003.). Negative emotion and coronary heart
disease. Behavior Modification, 27(1):83–102.
Sivakumar, A. and .Kannan, K. (2009). A novel feature
selection technique for number classification problem
using pnn - a plausible scheme for boiler flue gas anal-
ysis. Sensors and Actuators B: Chemical, 139:280–
286.
Specht, D. F. (1990). Probabilistic neural networks. Neural
Networks, 3:110–118.
Tahon, M., Degottex, G., and Devillers, L. (2012). Usual
voice quality features and glottal features for emo-
tional valence detection. In the 6th International Con-
ference of Speech Prosody. Tongji University Press.
Takahashi, K. and Tsukaguchi, A. (2003). Remarks on emo-
tion recognition from multi-modal bio-potential sig-
nals. In Proc. of IEEE International Conference on
Systems, Man, and Cybernetics. Institute of Electrical
and Electronics Engineers.
Van den Broek, E. L. and Westerink, J. H. D. M. (2009).
Considerations for emotion-aware consumer products.
Applied ergonomics, 40(6):1055–64.
Wundt, W. (1905). Grundriss der Psychologie [Fundamen-
tals of Psychology]. Engelman, Leipzig, 7th edition.
EmotionalValenceDetectionbasedonaNovelWaveletFeatureExtractionStrategyusingEEGSignals
59
