
Analysis of Behaviors by Audience in Lectures by Using Time-series
Models
Eiji Watanabe
1
, Takashi Ozeki
2
and Takeshi Kohama
3
1
Faculty of Intelligence and Informatics, Konan University, 658–8501 Kobe, Japan
2
Faculty of Engineering, Fukuyama University, 729–0292 Fukuyama, Japan
3
School of Biology-Oriented Science and Technology, Kinki University, 649–6493 Kinokawa, Japan
Keywords:
Lecture, Speaker, Audience, Behavior, Time Series Model, Synchronization.
Abstract:
In this paper, the dominant behaviors defined by the face direction of the speaker and audience in lectures are
analyzed by using the time-series models. First, we detect the face region of the speaker and audience by the
image processing and we adopt the number of skin-colored pixels in face region as features for behaviors by
them. Next, we construct piecewise time series models for behaviors by the speaker and audience. Finally, we
analyze the synchronization phenomena in speaker and audience by comparing time series models. Concretely,
we show that the parameters in the time series models denote the dominant section in lectures. Moreover, we
discuss the relationships among notes, test and behaviors by audience.
1 INTRODUCTION
In diary life and education field, it is very important
for human conversation to analyze gaze points and
eye movements (Land and Taters, 2009). However,
speaker and teacher have to talk with many audience
and grasp their interests for given contents immedi-
ately in lectures. Specifically, in lectures and classes,
lecturing with monotonous speech and gestures lose
sometimes audience and audience interests for given
contents. Good teachers and speakers can judge how
audience and audience can understand and have in-
terests for given contents and speech based on their
expressions.
Experimentally, they focus on the eye movement
by audience and expressions for the purpose of judge-
ment of taking interests in the communication. More-
over, teachers and speakers can change the contents
and repeat the same contents with slower speed ac-
cording to the behaviors by students and audience. In
these cases, the lecturer and speaker move face around
and look at faces of audience for the purpose of evalu-
ation of understanding and interests by audience. On
the other hand, audience communicate their interests
to speaker by their eye contacts and expressions. It
is very important to analyze the interaction between
behaviors by both speaker and audience.
Iso has shown that gestures by speaker has strong
relations with the skill of speech (Iso, 2011). More-
over, it is shown that the frequency of gestures have
positive correlation with the skill of speech by the
speaker. On the other hand, Hatakeyama et al. have
discussed a case that speaker can not see the behav-
ior of audience (Hatakeyama and Mori, 2001). They
have investigated how this case influenced with the
speech and behaviors by the speaker. Therefore, from
the viewpoint of evaluation of the interest and the un-
derstanding of audience, it is very important to inves-
tigate the interaction between speaker and audience.
Moreover, Marutani et al. have proposed a method
for the detection of behavior by speaker by using mul-
tiple cameras in the lecture on-line (T. Marutani and
Minoh, 2007).
In this paper, the dominant behaviors define by
the face direction of the speaker and audience in
lectures are analyzed by using the time-series mod-
els. Here, the dominant section and model mean the
change of the contents by the speaker and interests
by the audience. The contents (words, images, fig-
ures and speech) and gestures by speaker are com-
municated to audience in lectures. The understanding
and interest by audience are transformed to behav-
iors by them and their behaviors are communicated to
speaker. Here, the interpersonal communication be-
tween the speaker and audience with speech and ges-
tures occurs. Authors have discussed the extraction
of relationships between them by using multi-layered
191
Watanabe E., Ozeki T. and Kohama T..
Analysis of Behaviors by Audience in Lectures by Using Time-series Models.
DOI: 10.5220/0004787801910196
In Proceedings of the 6th International Conference on Computer Supported Education (CSEDU-2014), pages 191-196
ISBN: 978-989-758-020-8
Copyright
c
2014 SCITEPRESS (Science and Technology Publications, Lda.)
neural networks (E. Watanabe and Kohama, 2011b).
This paper can be summarized as follows; First,
we detect the face region of the speaker and audience
by the image processing and we adopt the number of
skin-colored pixels in face region as features for be-
haviors by them. Next, we construct piecewise time
series models for behaviors by the speaker and audi-
ence. Finally, we analyze the synchronization phe-
nomena in speaker and audience by comparing with
piecewise time series models. Concretely, we show
that the parameters in the time series models denote
the dominant section in lectures. Moreover, we dis-
cuss the relationships among notes, test and behaviors
by audience.
2 ANALYSIS OF BEHAVIORS BY
SPEAKER AND AUDIENCE
The speaker can communicate a lot of contents to au-
dience by using words, figures, pictures, and speech
information in lectures. Moreover, audience are sen-
sitive to the behavior by the speaker including the
loudness of the speech, the face and hand movements.
On the other hand, the speaker can confirm the under-
standing and the interest of audience for given con-
tents by asking questions on audience.
We focus on the intrapersonal communication in
speaker and audience in this paper. The intrapersonal
communication in lectures shows the changes of the
face movement and the loudness of speech. There-
fore, we extract the dominant rules in the intraper-
sonal communication by using piecewise time-series
model.
Interpersonal Communication
Interpersonal Communication
Loudness of Speech
Face Movement
Hand Movement
Face Movement
Intrapersonal
Communication
Intrapersonal
Communication
Intrapersonal
Communication
Intrapersonal
Communication
Intrapersonal
Communication
Audience
Speaker
Figure 1: Interpersonal and intrapersonal communication
for speaker and audience in lectures.
From Figure 1, we can summarize the following
relations between behaviors by speaker and audience
as follows;
• The influence of the behavior x
S
(t) by speaker on
the p-th audience x
p
A
(t);
x
p
A
(t) = f
AS
(x
S
(t − i),x
p
A
(t − i)),
• The influence of the behavior x
p
A
(t) by p-th audi-
ence on audience x
S
(t);
x
S
(t) = f
SA
(x
S
(t − i),x
p
A
(t − i)),
• The intrapersonal communication in behavior
x
S
(t) by speaker;
x
S
(t) = f
S
(x
S
(t − i)),
• The intrapersonal communication in behaviors
x
p
A
(t) by the p-th audience;
x
p
A
(t) = f
A
(x
A
(t − i)).
In this paper, we treat the intrapersonal communica-
tion x
p
A
(t) = f
A
(x
A
(t − i)) in behaviors x
p
A
(t) by the
p-th audience.
2.1 Extraction of Features for Behaviors
by Speaker and Audience
For the detection of the relations between behaviors
by speaker and audience, we adopt the face movement
as a feature. This feature can be extracted by image
processing for images recorded by video camera.
Here, we detect the face region of the speaker and
audience based on the color information. Moreover,
the image for the face region has the skin-colored pix-
els. Therefore, we extract the skin-colored regions in-
cluding face and hands based on the detection of pix-
els { f
Red
(x,y), f
Green
(x, y), f
Blue
(x,y)} with the fol-
lowing conditions;
f
Red
(x,y) > ε
Red
,
f
Red
(x,y) > f
Green
(x, y) + ∆
Green
, (1)
f
Red
(x,y) > f
Blue
(x,y) + ∆
Blue
,
where ε
Red
denotes a threshold for the detection of
the red-colored pixel. Also, ∆
Green
and ∆
Blue
denote
thresholds for the evaluation of the objective pixel.
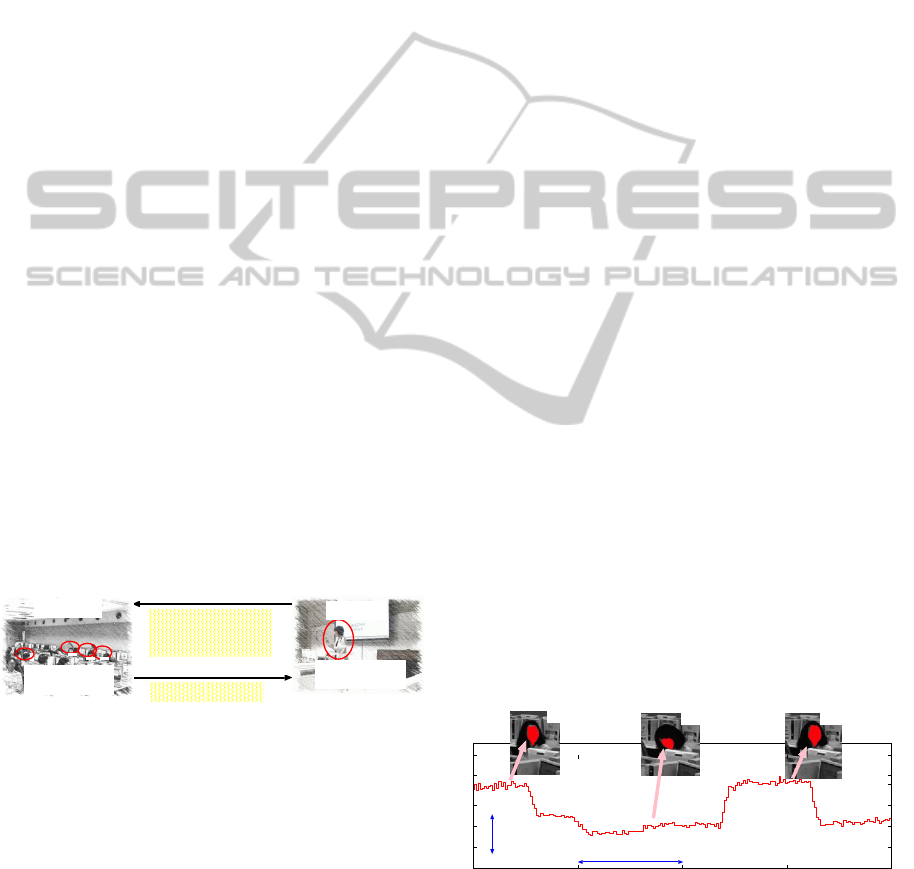
Figure 2 shows changes of the number of skin-
colored pixels in the face region detected by image
processing in a lecture. In this Figure, it is shown that
the number of skin-colored pixels changes according
to the position and direction of the face region.
800 850 900 950 1000
Number of Pixels in Face Region
Large
Small 5 [sec]
frame_no=950
frame_no=815
frame_no=885
Figure 2: Changes of the number of skin-colored pixels in
face region.
CSEDU2014-6thInternationalConferenceonComputerSupportedEducation
192

2.2 Analysis of Behaviors by Speaker
and Audience by using Time-series
Models
Features for the behavior by the speaker detected by
image processing method can be summarized as fol-
lows; (i) the loudness of speech by speaker, (ii) the
number of skin-colored pixels in the face region, and
the number of skin-colored pixels in the face region
of audience. In lectures, the speaker has to talk with
many audience and grasp their interests for given con-
tents immediately. Accordingly, they focus on the
face movement by the audience for the purpose of
judgement of taking interests in the lecture.
In this paper, we assume that the face direction by
speaker and audience show non-stationary character-
istics with the time. Namely, that characteristic of the
behavior by the audience changes with the time and
the content of the lecture. In this section, we pro-
pose an extraction method of “dominant section” and
model for speaker and audience based piecewise AR
(auto-regressive) modeling. Here, the “dominant sec-
tion” and model mean the change of the contents by
the speaker and interests by the audience. Therefore,
it is very important for the analysis of the objective
lecture to extract dominant section.
We assume that the face direction by speaker
and audience can be modeled by the following non-
stationary AR model with time varying parameters
a
i
(t); Let us consider the following non-stationary
AR model with time varying parameters a
i
(t);
x(t) +
p
∑
i=1
a
i
(t)x(t − i) = e(t), (2)
where p denotes the degree of the AR model, and a se-
quence {e(t)} of white noise has the following statis-
tics:
E[e(t)] = 0, E[e(t)e(τ)] = σ
2
δ
tτ
, (3)
where δ
tτ
denotes the Kronecker delta function.
When the Yule-Walker method is applied to non-
stationary time series data, we have to pay attention
to the following trade-off problems; (i) Too long lo-
cal section: While the reliability of the statistics be-
comes increased, it is difficult to grasp the changing
property of time varying parameters. As a result, the
estimation performance of such parameters becomes
worse. (ii) Too short local section: In the contrast,
while it is easy to grasp the changing property of time
varying parameters, the reliability of the statistics be-
comes decreased.
It is very important to develop a modeling method
by taking account of these non-stationary properties.
Figure 3: Observation section and local stationary section ∆
in the non-stationary time-series data.
From the viewpoint of the statistical approach, sev-
eral kinds of estimation methods of time varying pa-
rameters in AR model have been already discussed by
many researchers. They can be categorized into the
following two approaches: (i) Estimation method by
introducing the local stationary section (Y. Miyanaga
and Hatori, 1991), (Y. Miyoshi and Kakusho, 1987),
(ii) Estimation method by introducing the time vary-
ing parameters (E. Watanabe and Mitani, 1997). In
block-wise processing for the non-stationary time se-
ries data, it is necessary to consider three factors (i.e.,
the length of the local stationary section, the learning
ability of the local stationary model, and the structure
of the local stationary model). These factors are mu-
tually connected and it is very difficult to determine
appropriate values for such factors in prior.
In this paper, we propose a method for the extrac-
tion of “dominant section” and model for speaker and
audience based on time-series models. Authors have
already proposed an extraction method for the domi-
nant sections based on the prediction error (E. Watan-
abe and Kohama, 2011a). Here, the dominant section
and model mean the change of the contents by speaker
and interests by audience. In this paper, we propose
a new extraction method for the dominant sections
based on the change of estimated parameters. The
prediction value ˆx(t) in the k-th local stationary sec-
tion can be calculated by
ˆx(t) = −
p
∑
i=1
a
k
i
x(t − i), (4)
where a
k
i
denotes the estimated parameter in the k-th
section. Also, the prediction error E
k
P
in each section
can be calculated by
E
k
P
=
1
∆
(k+1))∆
∑
t=k∆
(x(t) − ˆx(t))
2
. (5)
AnalysisofBehaviorsbyAudienceinLecturesbyUsingTime-seriesModels
193
When the prediction errors E
k
P
in the k-th section
and E
ℓ
P
in the ℓ-the section are small and the estimated
parameters a
k
i
satisfy the following condition, the k-th
and ℓ-th sections can be modeled by the same time-
series model.
E
k,ℓ
a
=
1
P
p
∑
i=1
( ˆa
k
i
− ˆa
ℓ
i
)
2
≤ ε
a
, (6)
where ε
a
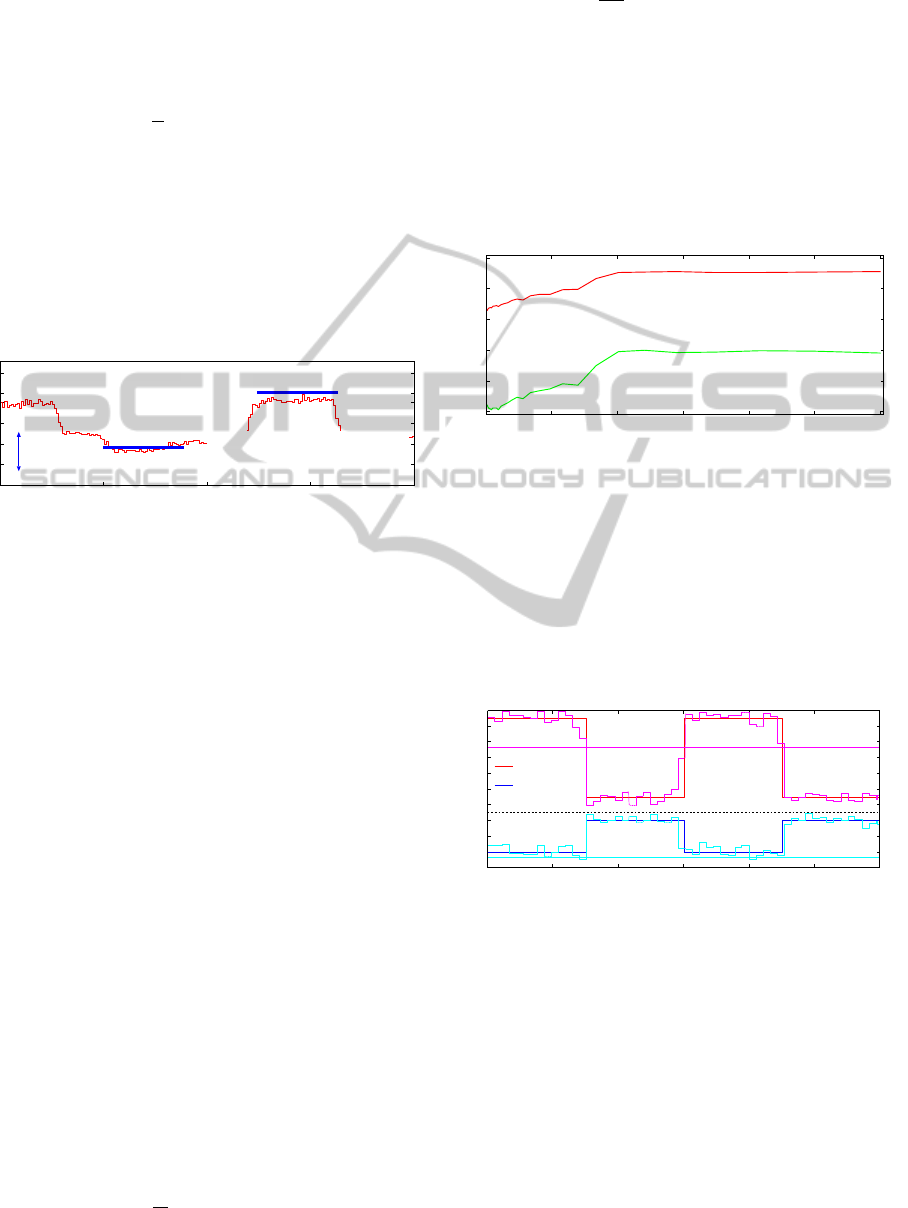
denotes the threshold value. As shown in
Figure 4, if the k-th and ℓ-th section have the same
characteristics, that is, the behaviors by the speaker
and audience, we can model the above two sections
with same time-series model. Therefore, the behav-
iors by the speaker and the audience in the k-th and
ℓ-th sections can be modeled by the same time-series
model.
800 850 900 950 1000
Number of Pixels in Face Region
Large
Small
ℓ-th section
k-th section
then k-th and ℓ-th sections
can modeled by the same model.
If E
k,ℓ
a
≤ ε
a
,
Figure 4: Observation section and local stationary section ∆
in the non-stationary time-series data.
On the other hand, if E
k,ℓ
a
is greater than ε, the k-
th and ℓ-th sections can not be modeled by the same
time-series model. When the number of local sections
are large, the objective local sections can be modeled
by a dominant time-series model.
3 ANALYSIS RESULTS
3.1 For Artificial Data
First, we consider the following non-stationary AR
model with time-varying parameters a
i
(t):
x(t) +
2
∑
i=1
a
i
(t)x(t − i) = e(t). (7)
We assume that time-varying parameters a
i
(t)
changes with time t as follows:
a
1
(t) = 0.5,a
2
(t) = −0.2,
(1 ≤ t ≤ 150, 301 ≤ t ≤ 450),
a
1
(t) = −0.5,a
2
(t) = 0.2,(otherwise).
(8)
Here, the prediction error E
P
and the estimated error
E
a
for time-varying parameters can be evaluated by
the following equations;
E
P
=
1
N
N
∑
t=1
(x(t) − ˆx(t))
2
,
E
a
=
1
2N
N
∑
t=1
2
∑
i=1
(a
i
(t) − ˆa
i
(t))
2
,
where ˆx(t) and ˆa
i
(t) denote the predicted value and
the estimated parameter respectively. Figure 5 shows
the prediction error E
P
and the estimated error E
a
for
time-varying parameters with various ∆ for artificial
time-series data. As shown in Figure 5, when ∆ be-
comes smaller, the prediction error E
P
and the esti-
mated error E
a
for time-varying parameters can be
improved.
0
0.2
0.4
0.6
0.8
1
0 100 200 300 400 500 600
∆
E
P
E
a
Figure 5: Prediction error E
P
and estimated error E
a
for
time-varying parameters with various ∆ for artificial time-
series data.
Moreover, Figure 6 shows the estimated parame-
ters { ˆa
i
(t)} for ∆ = 10, 600. In case of ∆ = 10, the
estimated parameters
{
ˆ
a
i
(
t
)
}
can catch up the char-
acteristic for parameters {a
i
(t)}. Therefore, we adopt
the shorter local section ∆ as modeling the time-series
model with time-varying parameters.
-0.2
0
0.2
-0.6
-0.4
-0.2
0
0.2
0.4
0.6
0 100 200 300 400 500 600
Time [sec.]
a
1
(t)
a
2
(t)
ˆa
1
(t)(∆ = 10)
ˆa
1
(t)(∆ = 600)
ˆa
2
(t)(∆ = 600)
ˆa
2
(t)(∆ = 10)
Figure 6: Estimated parameters { ˆa
i
(t)} for ∆ = 10, 600.
3.2 For Real Data
We have recorded images and speech for speaker and
audience in a lecture concerning on “C language”.
In this lecture, the speaker explained “the role of the
pointer” during about 20 [min].
As shown in Figure 7, four audience (21-22 years
old) had this lecture and the images for speaker and
audience were recorded by digital video cameras.
These images were recorded by the rate 10 [fps] and
the size of 640×360 [pixels].
CSEDU2014-6thInternationalConferenceonComputerSupportedEducation
194
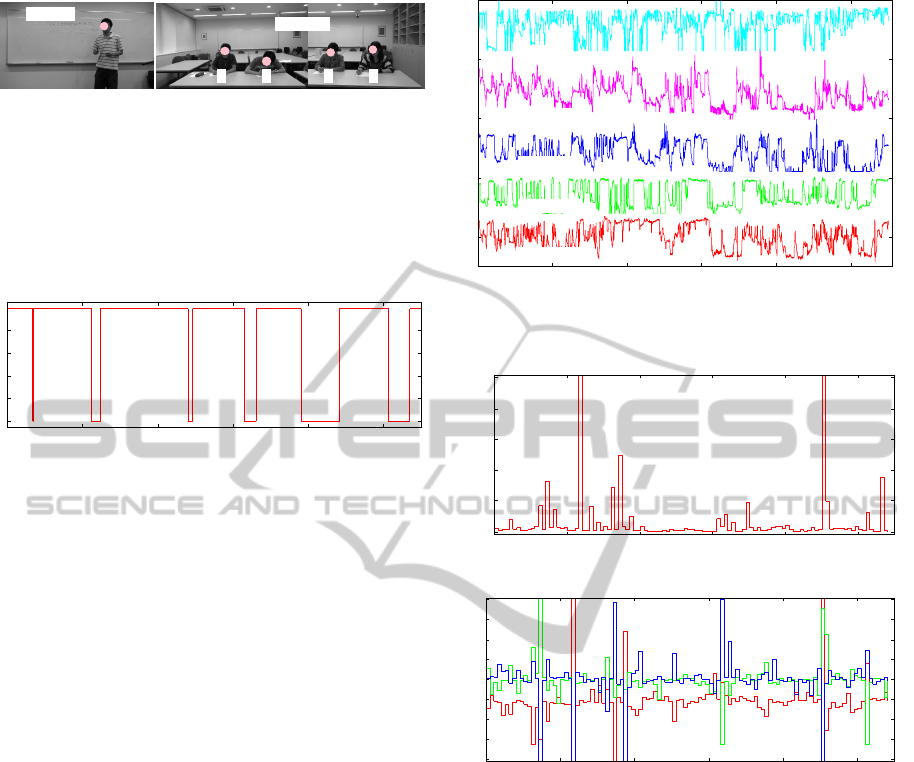
Audience
Speaker
A B C D
Figure 7: Speaker and audience recorded by digital video
cameras.
Moreover, in Figure 8, the transition of behaviors
(speaking and silent) by speaker is shown. In “Silent”
phase, the speaker is waiting for finishing of taking
notes by audience.
0 200 400 600 800 1000
Time [sec]
Speaking
Silent
Figure 8: Behaviors (speaking and silent) by speaker.
3.2.1 Features by Speaker and Audience
In this paper, we adopt the number of skin-colored
pixels in the face region as the feature for the behav-
iors by speaker and audience. Figure 9 shows the
numbers of skin-colored pixels in speaker and audi-
ence.
When the value by the speaker is small, the
speaker is writing the content on the whiteboard. On
the other hand, when the value by the speaker is large,
the speaker is turning the face to audience. When the
value by audience is small, the audience is writing
the content on the note. Furthermore, when the value
by audience is large, the audience is turning the face
to the speaker. From Figure 9, we can see that the
behaviors by audience-C and audience-D have high
correlation each other.
3.2.2 Prediction Error and Estimated
Parameters
Figure 10 shows the prediction error E
P
and estimated
parameters { ˆa
i
(t)} in each section for audience-A.
Here, the length ∆ of the local stationary section is
set as 10 [sec].
In Figure 10 (a), we have the sections with large
prediction error at 230, 340, 900 and 1,070 [sec].
On the other hand, prediction errors in other sections
are smaller than 0.1. Therefore, we can confirm that
the behaviors by audience-A can be modeled by the
piecewise auto regressive models with adequate pre-
0 200 400 600 800 1000
Time [sec]
Lecturer
Audience-D
Audience-C
Audience-B
Audience-A
Figure 9: The numbers of skin-colored pixels in speaker and
audience.
0
0.1
0.2
0.3
0.4
0.5
0 200 400 600 800 1000
Prediction Error
Time [sec]
(a) Prediction Error E
P
-4
-3
-2
-1
0
1
2
3
4
0 200 400 600 800 1000
Time [sec]
(b) Estimated Parameters { ˆa
i
(t)}
Figure 10: Prediction error E
P
and estimated parameters
{ ˆa
i
(t)} in each section for audience-A.
cision. Moreover, Figure 10 (b) shows the estimated
parameters { ˆa
i
(t)} in each local section defined by ∆.
For example, the change of estimated parameters
is small in the section [780,820] and this section can
be classified to the same time-series model by the con-
dition Eq. (6).
3.2.3 Extraction of Dominant Time-series Model
Figure 11 shows the sections modeled by the domi-
nant time-series models for behaviors by speaker and
audience. Here, the value “1” denotes that the ob-
jective section defined by ∆ can be modeled by the
dominant time-series model.
In Figure 11 (a), we can see that the number of the
AnalysisofBehaviorsbyAudienceinLecturesbyUsingTime-seriesModels
195
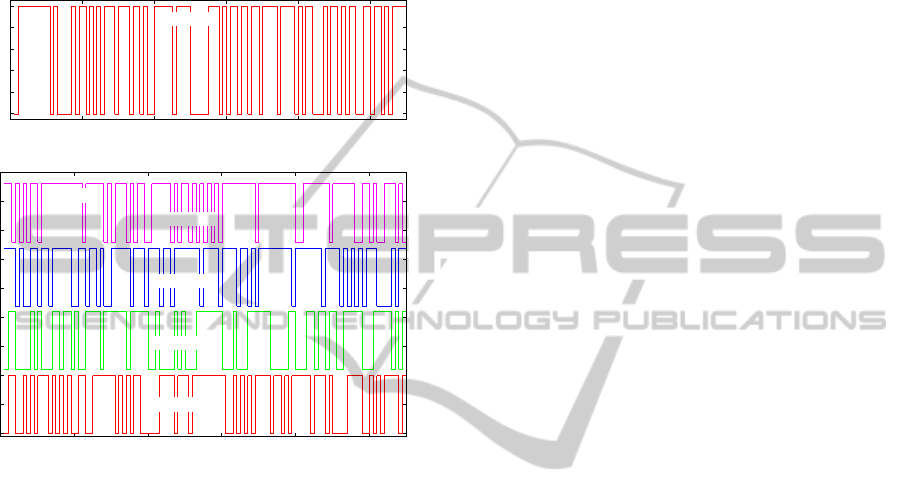
dominant time-series models by speaker is small. Be-
cause the speaker has to pay attention to all audience
and he often is turning the face here and there. On the
other hand, in Figure 11 (b), we can see that the num-
bers of the dominant time-series models by audience
are large. Especially, the changes by audience-C and
audience-D are very similar in the section [600,900].
0
1
0 200 400 600 800 1000
Time [sec]
Dominant
(a) For speaker
0 200 400 600 800 1000
Time [sec]
Audience-A
Audience-B
Audience-C
Audience-D
Dominant
(b) For audience
Figure 11: Changes of the dominant time-series models by
speaker and audience.
From this figure, we can see that the synchroniza-
tion phenomena occurs in audience-C and audience-
D by comparing time series models. Furthermore,
we evaluated hand-written notes by all audience af-
ter lecture and hand-written notes by audience-C and
audience-D had good contents compared with other
audience.
4 CONCLUSIONS
This paper have discussed the analysis of behaviors
by speaker and audience in lectures. First, we have
extracted the face direction as behaviors by speaker
and audience. Next, we have constructed piecewise
time-series models for their behaviors. Finally, we
have shown the estimated results of dominant sections
in a real lecture based on the piecewise time-series
models. From experimental results, we have shown
that the synchronization phenomena in two audience
as shown in Figure 11 and the hand-written notes by
the two audience had good contents compared with
other audience.
As future work, we would like to discuss many
cases with many audience and speakers. Moreover,
we would like to analyze the eye movement by the
speaker for the purpose of detection of the key person
in audience.
ACKNOWLEDGEMENT
This work has been partly supported by the Grant-
in-Aid for Scientific Research (C) from the Japan
Society for the Promotion of Science (Grant No.
25350308).
REFERENCES
E. Watanabe, N. N. and Mitani, Y. (1997). A prediction
method of non-stationary time series data by using a
modular structured neural network. In IEICE Trans.
Fundamentals, volume E80-A, pages 971–976.
E. Watanabe, T. O. and Kohama, T. (2011a). Analysis of
behaviors by lecturer and students in lectures based on
piecewise auto-regressive modeling. In Proc. of 2011
IEEE International Conference on Intelligent Com-
puter Communication and Processing, pages 385–
390.
E. Watanabe, T. O. and Kohama, T. (2011b). Extraction
of relations between lecturer and students by using
multi-layered neural networks. In Proc. of IMAGAPP
2011. SCITEPRESS.
Hatakeyama, M. and Mori, K. (2001). Interaction between
gesture and eye contact in communication – develop-
mental investigation of eye contact and gesture –. In
Memoirs of the College of Education, Akita Univer-
sity, volume 56, pages 69–75.
Iso, K. (2011). Effects of nonverbal behaviors on the per-
ception of “skillfulness of speech” – focusing on ges-
tures during speech –. In Japanese Journal of In-
terpersonal and Social Psychology, volume 4, pages
133–146.
Land, M. F. and Taters, B. W. (2009). Looking and Acting
– Vision and Eye Movements in Natural Behaviour –.
Oxford University Press.
T. Marutani, Y. Sugimoto, K. K. and Minoh, M. (2007).
Lecture context recognition base on statistical feature
of lecture action for automatic video recording. In IE-
ICE Trans. Information and Systems, volume 90-D,
pages 2775–2786.
Y. Miyanaga, N. Miki, N. N. and Hatori, K. (1991). Adap-
tive simultaneous estimation of time variable autore-
gressive and moving-average parameters. In IEICE
Trans. Fundamentals, volume J64–A, pages 308–315.
Y. Miyoshi, K. Yamamoto, M. Y. and Kakusho, O. (1987).
Analysis of speech signals of short pitch period by a
two-stage sample-selective linear prediction. In IEICE
Trans. Fundamentals, volume J70–A, pages 1146–
1156.
CSEDU2014-6thInternationalConferenceonComputerSupportedEducation
196
