
A Controlled Study for Measuring Stress Induced Changes of Physiologic
Tremor with a Wearable Activity Sensor
R
¨
udiger Zillmer, Brian Newby and Robert Treloar
Unilever R&D, Port Sunlight, Quarry Road East, Bebington CH63 3JW, U.K.
Keywords:
Activity Sensor, Accelerometer, Context Recognition, Emotional Stress, Tremor.
Abstract:
This work presents the results of a controlled study with the aim to quantify the effect of emotional stress
on physiologic tremor. A paced auditory addition test is utilized to induce emotional stress. The tremor is
measured by means of a wearable activity sensor (GENEA), were empirical mode decomposition is used to
extract the tremor signal. An autoregressive model and the fractal dimension of the signal are used to construct
tremor features. The result of an ANOVA test provides evidence that the stress condition increases the tremor
strength compared to the control. The observed changes of the spectral properties indicate that emotional stress
affects intentional tremor. These findings support the usage of wearable activity sensors for the investigation
of stress-related tremor changes and the evaluation of emotional context.
1 INTRODUCTION
At its simplest level, physiologic tremor can be said
to consist of two main components: mechanical and
centrally nervous driven (Elble, 1986; Hallet, 1998).
The contribution from each is still subject to de-
bate, and reported values in the literature concern-
ing this split may in part be due to the lack of stan-
dardization in experimental approach. Physiologic
tremor is present in everybody, but under particu-
lar conditions its amplitude may increase by over an
order of magnitude compared with standard physio-
logic tremor (Elble, 1986) which is referred to as en-
hanced physiologic tremor. Using an autoregressive
model and cross-spectral analysis it has been found
that enhanced tremor involves central structures (Tim-
mer et al., 2000). Factors which may instigate an
enhanced tremor state include fatigue, caffeine, and
stress.
Stress is an interesting context variable in the mea-
surement of human activity, as it affects the well-
being and the performance of the individual. Emo-
tional stress is usually assessed with the help of ques-
tionnaires. The quantification of stress levels using
methods such as galvanic skin response, however, is
still a challenging task which requires high expertise
from the data analyst. With the advent of ubiquitous
computing, digital approaches have been tested which
involve mobile phone use patterns and speech analy-
sis (Lu et al., 2012). These methods allow the iden-
tification of certain stress symptoms, while a quan-
tification of stress levels is still elusive. Tremor, on
the other hand, is relatively easy to measure, as it is
well separated from the spectrum of voluntary move-
ments. The most commonly used objective measure-
ment techniques are accelerometry and Electromyog-
raphy (EMG) - or a combination of the two (Timmer
et al., 2000; Mansur et al., 2007; Godfrey et al., 2008).
In this paper we measure hand tremor by means of a
wearable accelerometer, and study the impact of emo-
tional stress on the tremor features. By means of be-
spoke processing and analysis methods we show that
the measurement of physiologic tremor by means of
wearable sensors promises to be an efficient method
for the real-time assessment of emotional context.
2 THE STUDY
The most commonly used experimental approach to
measuring tremor is to record postural or resting
tremor using accelerometer sensors (Mansur et al.,
2007). This approach is adopted in the present study
which investigates the increase of the tremor ampli-
tude in healthy subjects exposed to emotional stress.
The study was designed as single blind study, ran-
domized with respect to a) the stress condition: a
paced auditory addition test (PASAT) (Tombaugh,
2006) and b) the control: listening to a piece of classi-
cal music (Rachmaninov adagios). The study design
178
Zillmer R., Newby B. and Treloar R..
A Controlled Study for Measuring Stress Induced Changes of Physiologic Tremor with a Wearable Activity Sensor.
DOI: 10.5220/0004789701780182
In Proceedings of the International Conference on Bio-inspired Systems and Signal Processing (BIOSIGNALS-2014), pages 178-182
ISBN: 978-989-758-011-6
Copyright
c
2014 SCITEPRESS (Science and Technology Publications, Lda.)

is summarized in Figure 1.
A total of 15 subjects (5 male and 10 female, age
25-35) with no pathologic tremor conditions were re-
cruited. All subjects were screened as per confiden-
tial medical questionnaire. During the test the pan-
ellist was seated, with the right arm placed on the
rest of their chair. The tremor response was mea-
sured by means of a 3-axis GENEA device attached
to the back of the subject’s hand. The GENEA is an
acceleration sensor developed by Unilever Discover
(Colworth, UK) which is now distributed by Activin-
sights Limited (Kimbolton, UK). The reliability and
performance of this sensor has been validated in sev-
eral studies (Esliger et al., 2011; Zhang et al., 2012).
The sensor is wireless, storing all measured data in a
flash memory. Data download and initialization of the
sensor is accomplished by means of a bespoke hub.
During the exploratory analysis it was found that one
panellist is a potential outlier. An inspection of the
study records revealed that this panellist did not fol-
low the PASAT protocol - thus this panellist has been
removed from the subsequent analysis, leaving data
from 14 subjects (8 control, 6 intervention).
3 SIGNAL PROCESSING AND
FEATURE EXTRACTION
The accelerations were recorded with a sampling rate
of 80 Hz. For the following only the vertical acceler-
ation of the hand, a
z
, is considered. After smoothing
the signal by means of a moving average, the empiri-
cal mode decomposition (EMD) is used to extract the
tremor signal (see (de Lima et al., 2006)). Because
EMD employs an adaptive process to compute the
signal envelope, it is appropriate for the analysis of
nonstationary signals such as tremor. It is not a priori
clear which intrinsic mode functions (IMF) contain
the tremor signal. An inspection of the resulting fre-
quency spectra was used as a guide, whereupon it was
decided to use the sum of the first two IMF as tremor
signal.
Typical tremor signals appear as noisy oscillations
with one or two dominating frequencies (see Fig. 2).
Such time series s(t) can be modelled by a damped
noise-driven oscillator model (Timmer et al., 2000).
To accomodate spectra with two peaks we adopt a 4th
order autoregressive model as follows:
s(t) = a
1
s(t − 1) + a
2
s(t − 2) + a
3
s(t − 3)
+a
4
s(t − 4) + ξ(t) ;
(1)
where ξ(t) is the driving noise. A test using the partial
autocorrelation of the signals confirmed the validity
of this model. The coefficients a
i
reflect mechanical
properties of the hand and attached muscles, which is
not of interest here. The strength of the driving noise,
however, defines the amplitude of the tremorous oscil-
lations, which suggests to use the variance as measure
of the tremor strength:
SD = Var (ξ) . (2)
The noise variance is estimated by standard statistical
methods.
To measure changes of the tremor signal structure,
the fractal dimension FD for one dimensional time se-
ries can be used. This measure is related to the rough-
ness of the signal. The fractal dimension equals 1 for
smooth signals, however, for rough signals it takes
values between 1 and 2. It has been used success-
fully for the modelling and analysis of multi-scaled
random processes and ecological data (Halley et al.,
2004). A change of the fractal dimension may indi-
cate a change in the underlying mechanism of tremor
generation. For the computation of the fractal dimen-
sion we used the R package fractaldim, selecting the
madogram estimator (Gneiting et al., 2010).
4 RESULTS
Typical frequency (power) spectra of the tremor sig-
nal before and after the stress intervention are shown
in Figure 2 for the control and stress condition. The
effect of the the stress intervention is clearly visible,
resulting in an increase of the total power and an en-
hancement of lower frequencies around 6 Hz. In con-
trast, the control condition (listening to classical mu-
sic) leads to a reduction of the total power.
The effect of the stress intervention on the tremor
strength SD is compared with the control in the box-
plot Figure 3. Here SD
1
and SD
2
are the tremor
strength before (baseline) and after the intervention.
These results confirm that the stress condition in-
creases the magnitude of SD, in contrast to the
control condition that tends to decrease the tremor
strength. In order to validate the effect of stress on
the tremor strength SD, ANOVA (analysis of vari-
ance) is used to quantify the difference between the
log-ratios log(SD
2
/SD
1
) of the stress and the con-
trol condition. The ANOVA, based on 1 and 12 de-
grees of freedom and F
1,12
= 8.34, results in a p-
value of 0.014, i.e., good evidence that the stress con-
dition indeed increases the strength of tremor. We
now consider the fractal dimension FD. As shown
in Figure 4, the stress condition leads to a decrease
of FD. Because the distributions of FD are slightly
skewed and have different variance for stress and con-
trol, we first use the non-parametric Kruskal-Wallis
AControlledStudyforMeasuringStressInducedChangesofPhysiologicTremorwithaWearableActivitySensor
179
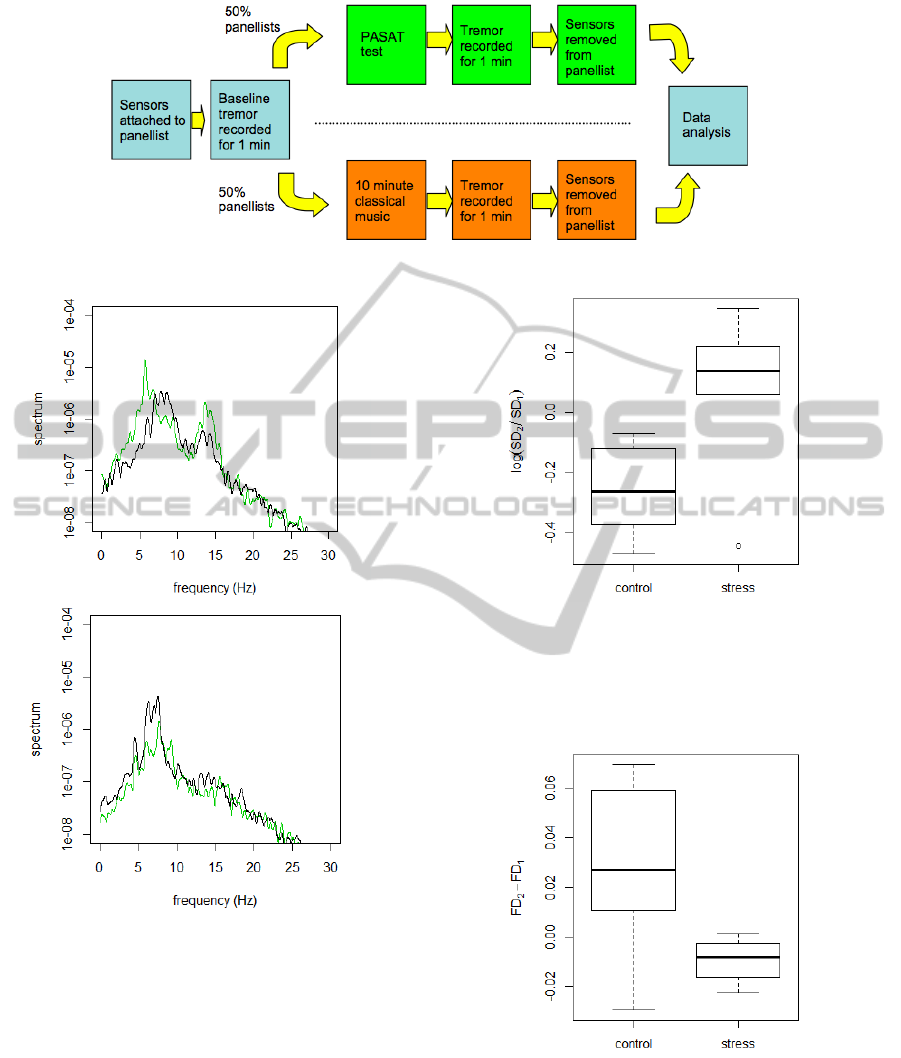
Figure 1: The design of the study to measure stress induced tremor.
Figure 2: The tremor frequency spectrum of a panellist who
was exposed to the stress (top panel) and control condition
(bottom panel). Shown is the spectrum before (black) and
after the intervention (green).
test (Kruskal and Wallis, 1952). The resulting statis-
tics are χ
2
= 4.82 on 1 degree of freedom and a p-
value of 0.028. Additionally we use Welch’s ANOVA
for unequal variances, which results in a p-value of
0.014. In summary, both methods give good evidence
that the stress condition decreases the roughness of
the tremor signal. It could be argued that the change
of the fractal dimension is related to changes of an
underlying low-dimensional dynamical system. In
order to test this hypothesis, signal surrogates were
Figure 3: Boxplot of the log-ratio, log(SD
2
/SD
1
), for the
control and stress (PASAT) condition. SD
1
and SD
2
are the
tremor strength before (baseline) and after the intervention.
The thick lines indicate the median while the lower and up-
per box edges indicate the 25th and the 75th percentile, re-
spectively.
Figure 4: Boxplot of the change of the fractal dimension for
the control and stress (PASAT) condition.
constructed by means of phase randomization. By
construction, the surrogates have the same frequency
spectrum as the original signal, while any dynamical
memory is removed by the randomisation step (Kantz
and Schreiber, 2005). The results for the surrogate
signals are shown in Figure 5. There is no significant
BIOSIGNALS2014-InternationalConferenceonBio-inspiredSystemsandSignalProcessing
180
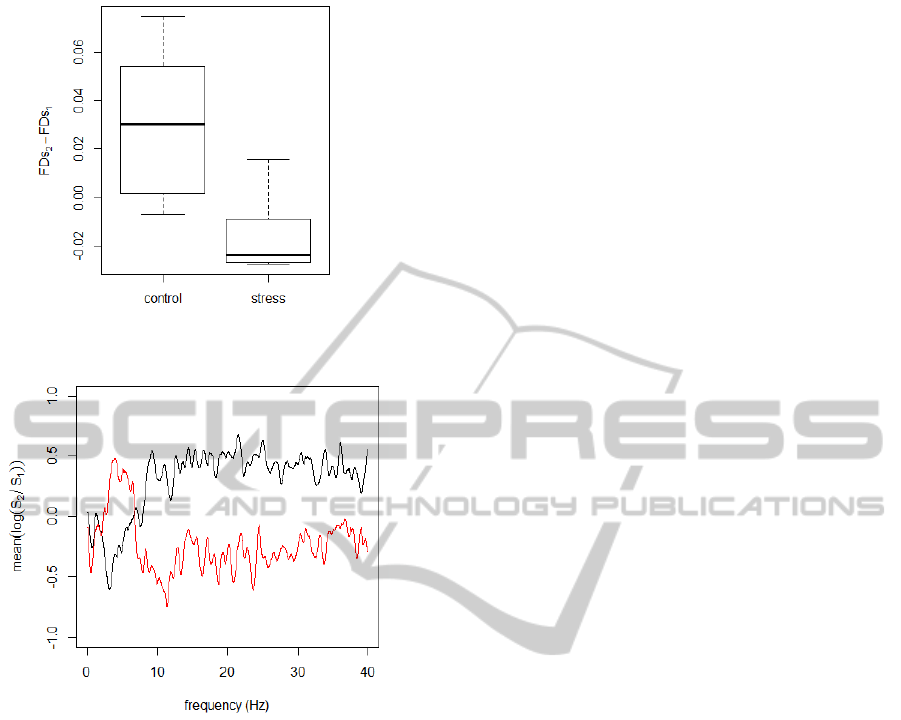
Figure 5: Boxplot of the change of the fractal dimension as
computed from surrogate signals.
Figure 6: The average change of the normalised spectrum
for the control (black) and stress group (red).
change compared to Figure 4, which indicates that the
change of the signal roughness is related to changes of
a linear stochastic process (as modelled by Eq. (1)).
The decrease of the signal roughness should be re-
flected in qualitative changes of the frequency spec-
tra. Indeed, as shown in Figure 2, the stress condition
leads to an increase of a low frequency peak around
6 Hz. To make this observation more precise, we
compute the average change of the spectrum as fol-
lows:
1. For each panellist compute the normalized spectra
S
1
and S
2
of the tremor signal before and after the
intervention, respectively.
2. Compute the average change of the log-spectrum,
mean[log(S
2
/S
1
)], for the control and the stress
group.
The result shown in Figure 6 confirms that the stress
condition enhances the power for low frequencies be-
tween 3-7 Hz.
5 CONCLUSIONS
We have presented the results of a controlled study
which investigates the change of physiologic tremor
as a result of emotional stress. Tremor was measured
by means of a wearable accelerometer attached to the
hand of the panellists. The stress group performed
an auditory addition test while the control group lis-
tened to classical music. To quantify the tremorous
oscillations we compute the strength of the driving
noise, estimated by an autoregressive model, and the
fractal dimension of the tremor signal. A comparison
of the signals recorded before and after the interven-
tion shows that stress leads to qualitative and quan-
titative changes of tremor. On the one hand, stress
increases the overall magnitude as measured by the
tremor strength. On the other, the fractal dimension
(roughness) of the signal decreases as a result of the
stress condition. Statistical tests confirm the validity
of the observed changes. A test with surrogate sig-
nals shows that the change of the roughness can be
explained by parameter changes of a linear stochastic
process. The inspection of the change in the average
spectra reveals that the reduction in roughness is re-
lated to an increse of spectral power of low frequen-
cies between 3-7 Hz. This indicates that emotional
stress increases the magnitude of intentional tremor,
which has been observed in the same frequency range
(McAuley and Marsden, 2000).
Our results show that physiologic tremor, as mea-
sured by an accelerometer, is a marker of emotional
stress. However, although we observe statistically
significant changes of mean quantities, there are con-
siderable variations between subjects. Thus, in order
to construct reliable stress scores based on accelerom-
eter data, the model has to be extended to allow for
additional factors such as age, gender and physiolog-
ical parameters. To this end, a larger study would be
required, which is beyond the scope of the pilot study
presented here.
Finally, the investigation was based on measure-
ments in a controlled lab environment. However, as
physiologic tremor occurs at relatively high frequen-
cies, its separation from voluntary activities appears
feasible even in real-life settings. Thus, the usage of
wearable activity sensors for the investigation of emo-
tional stress as well as for the evaluation of emotional
context is a promising topic for further research.
ACKNOWLEDGEMENTS
The authors are indebted to Sarah Paterson and Ian
Mahers who helped with the design and analysis of
AControlledStudyforMeasuringStressInducedChangesofPhysiologicTremorwithaWearableActivitySensor
181

the study.
REFERENCES
de Lima, E. R., Andrade, A., Pons, J., Kyberd, P., and Na-
suto, S. (2006). Empirical mode decomposition: a
novel technique for the study of tremor time series.
Med Bio Eng Comput., 44:569–582.
Elble, R. J. (1986). Physiologic and essential tremor. Neu-
rology, 36.
Esliger, D. W., Rowlands, A. V., Hurst, T. L., Catt, M.,
Murray, P., and Eston, R. G. (2011). Validation
of the genea accelerometer. Med Sci Sports Exerc.,
43(6):1085–1093.
Gneiting, T., Sevcikova, H., and Percival, D. (2010). Esti-
mators of fractal dimension: assessing the roughness
of times series and spatial data. Technical Report 577,
University of Washington, Department of Statistics,
University of Washington.
Godfrey, A., Conway, R., Meagher, D., and Olaighin, G.
(2008). Direct measurement of human movement by
accelerometry. Med Eng & Phys, 30:1364–1386.
Hallet, M. (1998). Overview of human tremor physiology.
Movement Disorders, 13:43–48.
Halley, J. M., Hartley, S., Kallimanis, A. S., Kunin, W. E.,
Lennon, J. J., and Sgardelis, S. P. (2004). Uses and
abuses of fractal methodology in ecology. Ecology
Letters, 7:254–271.
Kantz, H. and Schreiber, T. (2005). Nonlinear time series
analysis. Cambridge University Press, Cambridge,
2nd edition.
Kruskal, W. H. and Wallis, W. A. (1952). Use of ranks in
one-criterion variance analysis. Journal of the Ameri-
can Statistical Association, 47(260):583–621.
Lu, H., Frauendorfer, D., Rabbi, M., Mast, M. S., Chit-
taranjan, G. T., Campbell, A. T., Gatcia-Perez, D., and
Choudhury, T. (2012). Stresssense: detecting stress
in unconstrained acoustic environments using smart-
phones. In UbiComp 12, Proceedings of the 2012
ACM Conference on Ubiquitous Computing. ACM.
Mansur, P. H., Cury, L. K., Andrade, A. O., Pereira, A. A.,
Miotto, G. A., Soares, A. B., and Naves, E. L. (2007).
A review on techniques for tremor recording and
quantification. Crit Rev Biomed Eng., 35(5):343–362.
McAuley, J. and Marsden, C. (2000). Physiological and
pathological tremors and rhythmic central motor con-
trol. Brain, 123:1545–1567.
Timmer, J., Lauk, M., H
¨
außler, S., Radt, V., K
¨
oster, B.,
Hellwig, B., Guschlbauer, B., L
¨
ucking, C. H., Eichler,
M., and Deuschl, G. (2000). Cross-spectral analysis of
tremor time series. Int J Bif and Chaos, 10(11):2595–
2610.
Tombaugh, T. N. (2006). A comprehensive review of the
paced auditory serial addition test (pasat). Arch Clin
Neuropsychol., 21(1):53–76.
Zhang, S., Rowlands, A. V., Hurst, T. L., and Murray, P.
(2012). Physical activity classification using the ge-
nea wrist worn accelerometer. Med Sci Sports Exerc.,
44(4):742–748.
BIOSIGNALS2014-InternationalConferenceonBio-inspiredSystemsandSignalProcessing
182
