
Geometrical Improvement of a Noninvasive Core Temperature
Thermometer based on Numeric Modeling and Experiment
Validation
Ming Huang
1
, Toshiyo Tamura
2
, Wenxi Chen
3
, Kei-ichiro Kitamura
4
,
Tetsu Nemoto
4
and Shigehiko Kanaya
5
1
Computational Systems Biology Lab, Graduate School of Information Science,
Nara Institute of Science and Technology, 8916-5 Takayamacho, 630-0192, Ikoma, Nara, Japan
2
Department of Biological Engineering, Osaka Electro-Communication University, 18-8 Hatcho,
572-8530, Neyagawa, Osaka, Japan
3
Biomedical Information Technology Lab, the University of Aizu, Tsuruga, Ikki-machi,
965-8580, Aizu-wakamatsu, Fukushima, Japan
4
Department of Laboratory Science, Kanazawa University, 920-0942, Kanazawa Ishikawa, Japan
5
Computational Systems Biology Lab, Graduate School of Information Science,
Nara Institute of Science and Technology, 8916-5 Takayamacho, 630-0192, Ikoma, Nara, Japan
Keywords: Noninvasive Measurement, Long-term Measurement, Core Temperature, Dual-Heat-Flux Method, Numeric
Modeling, Experiment.
Abstract: This paper describes the improvement of a transcutaneous core temperature thermometer by modifying the
configuration, in terms of height and radius, of the thermometer using the so-called dual-heat-flux (DHF)
method. The motivation of these modifications is to decrease the volume of the thermometer so as to reduce
the transverse heat flow inside, in other words, to preserve the underlying assumption of the DHF method
that heat flows from the inner part of human body through skin onto the thermometer longitudinally. The
modification’s effect is evaluated by both numeric modeling based on finite element method and
experiment. The results of simulations and experiments show that a lower-in-height and larger-in-radius
configuration will improve the accuracy of the thermometer. Prototypes of 22.0 mm radius can attain
satisfactory accuracy with error less than 0.5 C when heights are 8.0 mm or less..
1 INTRODUCTION
Core temperature is one of the vital signs of human
body and its noninvasive monitoring is valuable in
both clinical aspect and daily healthcare aspect. In
order to lower the probability of developing
complications after surgeries, the National Institute
for Health and Clinical Excellence (NICE) has
issued guidance to the NHS in England and Wales to
prevent hypothermia during perioperative period
(NICE, 2008). However, it is acknowledged that the
three standard measurement sites of pulmonary
artery, nasopharynx and distal esophagus are
difficult to access during the perioperative period. A
clinical trial applying a transcutaneous thermometer
adopting the so-called double-sensor (DS) method as
an alternative to the invasive core temperature
monitoring has been carried out (Kimberger et al.,
2009).
As one of the major endogenous biorhythms, the
rhythm of core temperature plays a major role at the
treating of sleep disorder as an important criterion of
the circadian phase, because that the core
temperature rhythm and the sleep/wake rhythm are
closely related (Bjoryatn and Pallesen, 2009). Such
kind of studies will benefit a lot from a reliable
technique that is able to monitor the core
temperature continuously (Baehr et al., 2000).
To meet the requirement of long-term and
noninvasive measurement needs, tradeoff among the
measurement accuracy, response time and safety
should be made. This characteristic excludes the
means such as tympanic infrared thermometer or
magnetic resonance temperature mapping. A
feasible choice is to use the skin-contacting
temperature sensors and thermal physical principles
to estimate the core temperature, which the existing
23
Huang M., Tamura T., Chen W., Kitamura K., Nemoto T. and Kanaya S..
Geometrical Improvement of a Noninvasive Core Temperature Thermometer based on Numeric Modeling and Experiment Validation.
DOI: 10.5220/0004790000230027
In Proceedings of the International Conference on Biomedical Electronics and Devices (BIODEVICES-2014), pages 23-27
ISBN: 978-989-758-013-0
Copyright
c
2014 SCITEPRESS (Science and Technology Publications, Lda.)

zero-heat-flux (ZHF) method (Fox and Solman,
1971), DS method (Gunga et al., 2008) and the dual-
heat-flux (DHF) method (Kitamura et al., 2009) are
attributed to.
Of the three said methods , ZHF is greatly
limited by its adoption of heater. As for the other
two methods, we have to consider the blood
perfusion in the skin and subcutaneous tissue, which
makes the heat conductivity in the corresponding
tissues change greatly even for the same individual.
This problem is tactfully dodged by DHF method.
However, the underlying assumption of DHF
method that the heat flow from the inner body
through the skin and subcutaneous tissue onto the
thermometer longitudinally is somewhat diverging
from the practical situation. The thermometer is
conducting heat exchange with the ambient
environment through convection and radiation. The
effect of convection can be greatly moderated with
proper clothing during measurement whereas the
radiation can’t be ignored. The insulator, featured
with a relative higher emissivity, consists of the
peripheral boundary of the thermometer. Thus a
lower height and larger radius design may help to
suppress the transverse heat flow so as to improve
the accuracy.
In this study, we validated the geometrical
improvement through simulation, and the effect of
the geometrical modification by practical
experiments with our experimental system.
This paper can be divided into two parts. The
first part is to examine the effect of the geometrical
modification on a physiological significant
temperature range (36.0-38.0 °C) by a 3D modeling
based on finite element method (FEM). The second
part is to fabricate the thermometer’s prototypes
according to the simulation results, to construct the
experimental system and finally to validate the
effects of the geometrical improvement.
2 METHOD
2.1 The DHF Method
DHF method uses at least four temperature sensors
inlaid inside the DHF thermometer to calculate the
core temperature. Elucidation can be made based on
following formulas and Fig. 1.
There is temperature difference between the deep
body part and the skin surface. If we assume that the
inner boundary of skin is of the same temperature
with the deep body part, heat flow from inner part to
skin surface will arise and then stream into the
thermometer as shown in Figure 1. Considering that
heat flow from deep body part into the thermometer
is the same, two equations below can be acquired by
Fourier law.
/
/
,
(1)
and
/
/
,
(2)
where T
d
is the temperature of the inner boundary of
skin, i.e., the core temperature, while T
1
, T
2
is skin
temperature measured by cutaneous temperature
sensors inside the thermometer and T
3
, T
4
are the
temperature measured by the other two sensors. R
s
is
the heat resistance of the skin, R
1
and R
2
are the heat
resistance of the two heat path inside the
thermometer. According to (1), (2), T
d
then can be
expressed as
,
(3)
Where
/
and can be represented with the
ratio of length of the two concentric cylinders
constructing the thermometer.
2.2 3D Modeling based on FEM
In this paper, we only carried out the stationary
study of the 3D model, in other words, the whole
model was assumed to be at a heat equilibrium state.
It was used to mimicking the situation when the
reading of the thermometer becomes stable. We also
set the related thermophysical properties of each
component in the model to be isotropic.
Hence, the well-acknowledged mathematical
description of bioheat transfers: Pennes equation
could be simplified as (4), where
b
b
, c
b
, k, and q
m
are perfusion rate (m
3
/m
3
s), density (kg/m
3
) specific
heat (J/kg·C) of blood, thermal conductivity
(W/m·C), and rate of metabolic heat generation. T
is the local temperature and T
b
is the temperature of
blood. What is more, because we used this model to
simulate the situation when the thermometer was
applied to a rubber sheet that no extra heat generated
inside, the second and the third terms of the equation
could be eliminated.
0∙
.
(4)
The heat exchange between the
thermometer/tissues and the ambient environment
was described by radiation only because that the
effect of convection can be greatly mitigated by
proper clothing. Hence, the boundary condition of
the thermometer and the cutaneous surface is:
BIODEVICES2014-InternationalConferenceonBiomedicalElectronicsandDevices
24
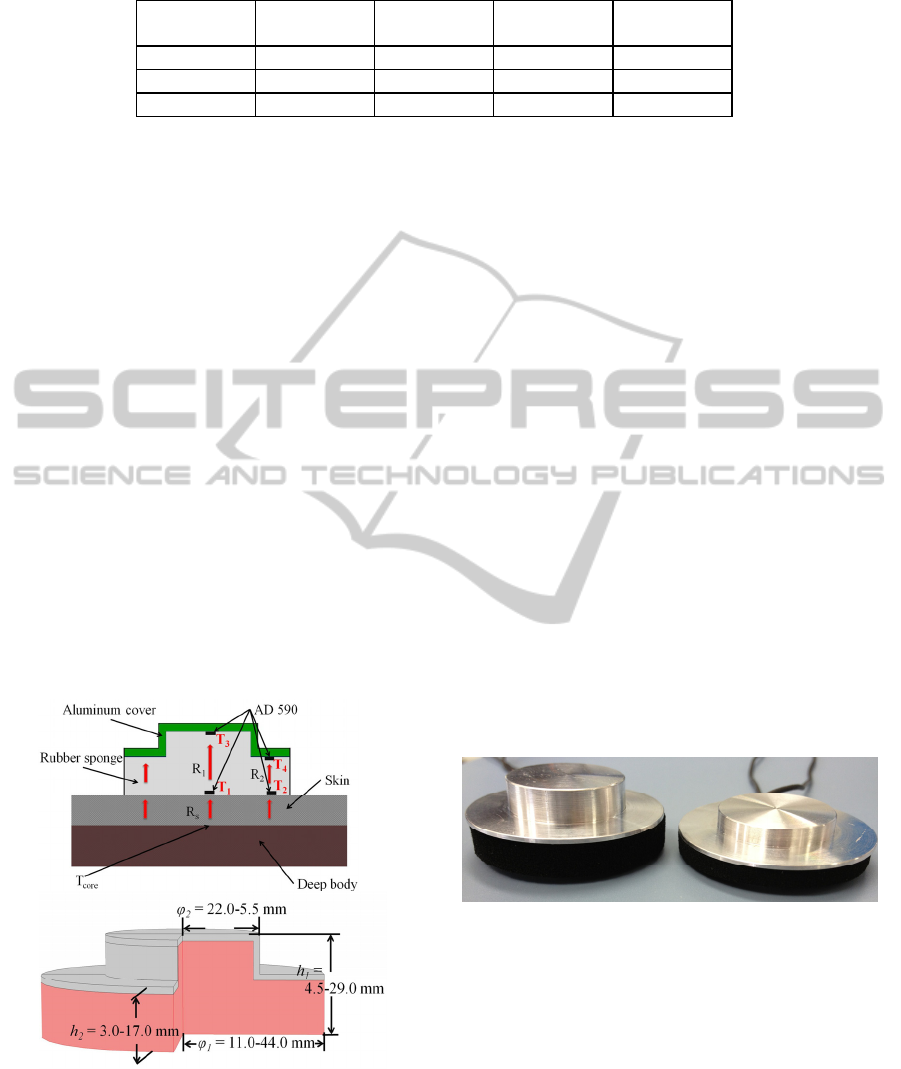
Table 1: Related thermophysical properties of the materials used in simulations.
Component
Conductivity
(W/m·C)
Density
(kg/m
3
)
Specific heat
(J/kg·C)
Emissivity
Skin 0.17 1100 3500 0.98
rubber 0.06 180 2010 0.95
aluminum 400
8700 385 0.05
∙
(5)
T
amb
and T
s
is the ambient temperature (°C) and
temperature on boundaries, respectively, is the
Stefan–Boltzmann constant, and is the emissivity
of material. FEM model was constructed and
analyzed by COMSOL Multiphysics software
(COMSOL Inc., Sweden). In this model, lower
boundary of skin was considered to be of the same
temperature as the core temperature, while the
peripheral boundary of the skin was assumed as heat
insulation. Details about this mathematical
description and the underlying deduction of the DHF
method can be found in (Huang and Chen, 2010)
and (Kitamura, et al., 2010).
In numeric study aspect, we constructed a series
of thermometer of 4 different heights ({h
1
, h
2
} =
{4.5, 3.0} {8.0, 5.0}, {15.0, 9.0}, {29.0, 17.0} mm)
and 4 different radii (
,
= {11.0, 5.5}, {22.0,
11.0}, {33.0, 16.5} {44.0, 22.0} mm}, thus a total of
16 combinations, that is 16 different configurations
were used. Cross-section view of the thermometer
and details of its configuration are illustrated in
Figure 1.
Figure 1: Upper: The illustration of the two-layer structure
and the arrangement of the four temperature sensors (AD
590, Analog, 2-pin style). It is supposed that the heat from
deep body part flows as the arrow’s indicating and no
transverse heat flow arises in the skin and the thermometer.
Lower: The cross-section view of the thermometer. The
thickness of the top aluminum cover is 1 mm.
With this model, we simulated the situation where
the thermometer is applied to skin surface when the
temperature at the bottom of skin (rubber sheet) is
36.0, 37.0 and 38.0 °C respectively, while the
ambient temperature is 28.0 °C.
2.3 Prototypes and Experimental
System
We fabricated a series of prototypes based on the
simulations results, whose heights are different
while radii are the same (22.0 mm). Because that
clumsy volume is a negative factor for the
universality for a transcutaneous thermometer, only
the height was changed. We would only consider
changing the radius of the thermometer if acceptable
accuracy can’t be obtained with present radius. In
this paper, we illustrate the results of two prototypes,
{8.0, 5.0} mm
and {15.0, 9.0} mm (Figure 2). The
higher one is of similar configuration with the initial
prototype proposed by Kitamura et al. while the
lower one is the thinnest one fabricated so far. It is
reported that a thicker geometry is a negative factor
for the accuracy (Huang et al., 2013). Hence, these
two kinds of prototype can show the improvement
based on height modification.
Figure 2: Front view of the two prototypes. Radii of the
two prototypes are 22.0 mm, while heights are {15.0, 9.0}
and {8.0, 5.0} mm, respectively.
The experimental system was constructed to
mimic the core temperature measurement carried out
on skin noninvasively, thereafter to acquire, store
and process the data of those experiments.
The body-mimicking module comprises of a
thermostatic water bath (± 0.1 °C systematic error)
stabilizing the temperature of water and a skin-
mimicking 10.0 mm neutral rubber sheet.
The data acquired by the 4 temperature sensors,
GeometricalImprovementofaNoninvasiveCoreTemperatureThermometerbasedonNumericModelingandExperiment
Validation
25
which were used to calculate the estimate of core
temperature, was streamed into PC for data
processing, visualizing and storage on LabVIEW
platform. The program of LabVIEW was organized
to suppress the measurement noise. As for the data
processing in the system, the DAQ sampled
temperature values from the 4 sensors, then a
median filter, which performs median filtering for
every 100 measurements for real-time data
acquisition, was adopted in LabVIEW platform (by
the function named PtByPt median filter) to acquire
measurements in real time with 1 Hz sampling rate
and write into a spreadsheet. This routine enables the
automatic and dynamic tracing of the thermal
physical evolution of the system.
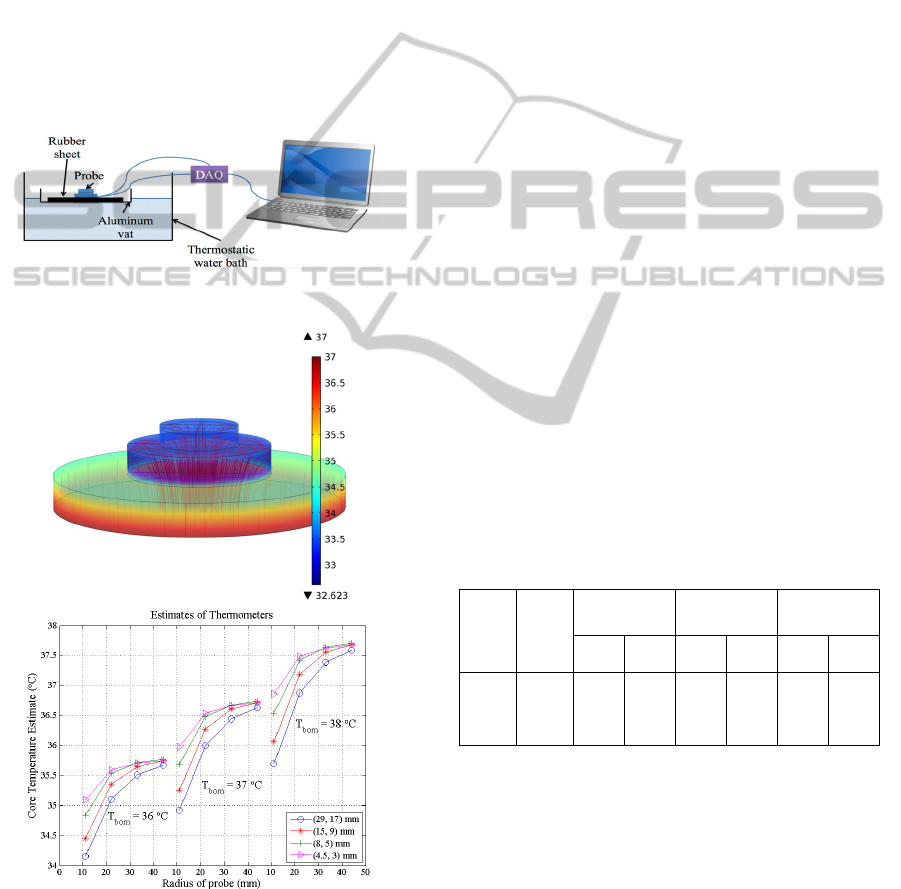
Figure 3: The schema of the experimental system.
Figure 4: Upper: An image of temperature distribution and
heat flow inside the prototype. Lower: Results of the
simulations. X-axis is the radius of the thermometer; Y-
axis is the estimates of thermometers.
With the said prototypes and experimental system,
we carried out experiments in a laboratory
environment, where the ambient temperature was
28.0 ± 0.5 °C. The prototypes went through tests 5
times for each condition that the bottom of the
rubber sheet was regulated at 36.0, 37.0 and 38.0 °C
respectively.
3 RESULTS
With the model of FEM, temperature distribution
and heat flow condition corresponding to specified
condition (upper figure in Figure 4) can be attained.
The results of the numerical study were summarized
into the lower figure in Figure 4. 3 clusters of curves
mark the estimates of each configuration under
different core temperature condition.
Each of the temperature situations shows similar
trend. We should also notice that the latitudinal
factor is more effective than the longitudinal factor
in terms of accuracy.
The results of the experiments are tabulated in
Table 1. In order to make an easier comparison, the
corresponding results of simulation are tabulated in
column 5 and 6. The measurements are stable under
the same environmental condition. Significant figure
is tenth here and standard deviation that marked as 0
represent highly stable experimental outcome.
However, additional digit is added to the Std
(standard deviation) for a better discrimination.
Table 2: Results of the experiments. Prot 1 denotes the
prototype of {15.0, 9.0} mm height, while Prot 2 the
prototype of {8.0, 5.0} mm height.
t
bom
(°C)
t
amb
(°C)
Mean (°C)
Simulation
result (°C)
Std (°C)
Prot
1
Prot
2
Prot
1
Prot
2
Prot
1
Prot
2
36.0 27.6 35.2 35.3 35.4 35.6 0.00 0.00
37.0 28.5 36.5 36.6 36.3 36.6 0.06 0.01
38.0 28.5 37.4 37.5 37.2 37.5 0.15 0.00
4 DISCUSSION
In the numeric study phase, mesh qualities and the
material values would affect the accuracy and
simulation result greatly. In this study, the quality of
mesh was guaranteed by the COMSOL Multiphysics
software and the related physical parameters were
extracted from the COMSOL material library.
However, these parameters may not match the real
BIODEVICES2014-InternationalConferenceonBiomedicalElectronicsandDevices
26

materials used perfectly, thus these differences could
be considered as a reason for the deviation between
simulations and experiments.
From the results of the simulations, two
considerations on the thermometer’s configuration
should be given. One is that the height could not be
decreased arbitrarily to ultra-thin level, says 1 mm,
which will be very difficult to fabricate. Another one
is the radius. We intend to maintain the miniature
configuration and try to attain equal accuracy by
reducing the height only. That is the reason why the
radius of prototypes is kept unchanged.
The experiments were carried out under the
laboratory environment, where the ambient
temperature was regulated by central-air
conditioning at about 28.0 °C. However, during the
experiment, the ambient temperature couldn’t be
regulated at a constant value, which is the major
limitation of these experiments. This limitation can
also be considered as another reason for the
deviation between simulations and experiments.
However, the insight that DHF thermometer will
benefit from a thinner design can be obtained. To
obtain a more precise comparison, the experiment
should be operated inside a thermostatic room,
because that the performance of the thermometer is
prone to be affected by the ambient temperature
according to (Huang and Chen, 2010). What is more,
in view of this disadvantage, an important direction
of the next step of improvement should be the
mitigation of the effect brought about by the
environment.
The geometrical parameters that we adopted to
fabricate here are only a subset of the parameters
used in the simulations. The thicker one is of the
similar configuration as the initial prototype of DHF
method, while the thinner one is a product balancing
the implementability and accuracy. To further
elevate its accuracy, consideration except for the
geometrical parameters should also be given, e.g.,
the arrangement of a urethane sponge to cover the
thermometer. Of course, we could try to enlarge the
radius to get a more satisfactory performance if only
its size cause no obstruction to practical application.
5 CONCLUSIONS
We constructed 3D finite element models to carry
out an overall numeric study of the geometrical
parameters’ effect on the performance of the DHF
thermometer. According to the numeric results, we
designed and fabricated prototypes and an
experimental system. Results from both numeric and
experiment studies show that to lower the height and
enlarger the radius of the thermometer will improve
its performance. Thermometer of 22.0 mm radius
can acquire satisfactory accuracy with error less than
0.5 °C when height is 8.0 mm or less.
ACKNOWLEDGEMENTS
This study was supported by the Keihanna Science
City Healthcare Project of Ministry of Education
Culture, Sports, Science and Technology, Japan.
REFERENCES
Baehr, E. K., Revelle, W., and Eastman, C. I., 2000.
Individual differences in the phase and amplitude of
the human circadian temperature rhythm: with an
emphasis on morningness-eveningness, Journal of
sleep research, 9(2), pp. 117-27.
Bjoryatn, B., and Pallesen, S., 2009. A practical approach
to circadian rhythm sleep disorders, Sleep medicine
reviews, 13(1), pp. 47-60.
Fox, R. H., and Solman, A. J., 1971. A new technique for
monitoring the deep body temperature in man from the
intact skin surface, J Physiol, 212, pp. 8-10.
Gunga, H. C., Sandsund, M., Reinertsen, R. E., Sattler, F.,
and Koch, J., 2008. A non-invasive device to
continuously determine heat strain in humans, Journal
of Thermal Biology, 33(5), pp. 297-307.
Huang, M., and Chen, W., 2010. Theoretical simulation of
the dual-heat-flux method in deep body temperature
measurements, Proceeding of IEEE EMBC 2010, 2010,
pp. 561-64.
Huang, M., Chen, W., Kitamura, K., Nemoto, T., and
Tamura, T., 2013. Improvement of the Dual-heat-flux
Method for Deep Body Temperature Measurement
Based on a Finite Element Model, Proceeding of IEEE
EMBC 2013, 2013, pp. 1202-05.
Kimberger, O., Thell, R., Schuh, M., Koch, J., Sessler, D.
I., and Kurz, A., 2009. Accuracy and precision of a
novel non-invasive core thermometer,” British journal
of anaesthesia. British journal of anaesthesia. 103(2),
pp. 226-31.
Kitamura, K., Zhu, X., Chen, W., and Nemoto, T., 2010.
Development of a new method for the noninvasive
measurement of deep body temperature without a
heater, Medical Engineering & Physics, 32(1), pp. 1-6.
NICE, 2008. http://www.nice.org.uk/CG065.
GeometricalImprovementofaNoninvasiveCoreTemperatureThermometerbasedonNumericModelingandExperiment
Validation
27
