
A Multitier Debugger for Web Applications
Manuel Serrano
Inria Sophia M
´
editerran
´
ee, 2004 route des Lucioles, F-06902 Sophia Antipolis, France
Keywords:
Web Debugging, Web Programming, Functional Programming.
Abstract:
Debugging Web applications is difficult because of their distributed nature but also because of the program-
ming languages and tools commonly used to develop them. Taking benefit of the multitier aspect of the Hop
programming language, we have built a new debugger for Web applications that copes with the server-side
and the client-side of the executions. Its advantage over most debuggers for the Web is that it reports the full
stack trace containing all the server-side and client-side frames that have conducted to an error. An error is
reported on its actual position on the source code, wherever it occurs on the server or on the client.
To help detecting errors as early as possible, the Hop debugger is accompanied with a debugging execution
mode where types are checked before data structures are accessed, argument numbers are verified before func-
tions are called, and array bounds are checked before vectors are accessed. Combining the debugger and the
debugging mode makes errors of Web applications easier to understand and easier to localize. Hopefully they
also become easier to fix.
1 INTRODUCTION
The distributed nature of Web applications makes de-
bugging difficult. The programming languages and
tools commonly used make it even more complex.
Generally the server-side and the client-side are im-
plemented in different settings and the debugging is
treated as two separated tasks: on the one hand, the
debugging of the server, on the other hand, the debug-
ging of the client. Most studies and tools focus on
this latter aspect. They concentrate on the debugging
of JavaScript in the browser. Although useful, this
only addresses one half of the problem. Considering
the debugging of Web applications as a whole raises
the following difficulties:
• As the server-side and the client-side are gener-
ally implemented in different languages, debug-
gers for the Web do not capture the whole execu-
tion of the application. Programming the server
and the client in the same language helps but is
not sufficient to let the debugger expose a coher-
ent view of the whole execution as this also de-
mands a runtime environment that enforces con-
sistent representations of data structures and exe-
cution traces.
• The JavaScript tolerant semantics tends to defer
errors raising. For instance, calling a function
with an insufficient number of arguments may
lead to filling a data structure with the unexpected
undefined value which, in turn, may raise a type
error when accessed. The distance between the
error and its actual cause may be arbitrarily long,
which can make the relation between the two dif-
ficult to establish.
• The JavaScript event loop used for the GUI splits
the execution into unrelated callback procedures
which get called upon event receipts. When an
error occurs, the active stack trace only contains
elements relative to the current callback invoca-
tion. It is oblivious of the context of the callback.
Understanding the cause of the error is then un-
easy.
Pursuing our research on multitier programming
for the Web, we have built a programming environ-
ment that eliminates most of these problems.
• When an error is raised, the full stack trace is re-
ported. This stack trace may contain server stack
frames, client stack frames, or both. We call this
a multitier stack trace.
• When an error occurs, either on the client or on
the server, its source location is reported by the
debugger.
• In debugging mode, types, arities, and array
bounds, are strictly enforced on the server and on
the client. Hence, when the execution of the pro-
5
Serrano M..
A Multitier Debugger for Web Applications.
DOI: 10.5220/0004790600050016
In Proceedings of the 10th International Conference on Web Information Systems and Technologies (WEBIST-2014), pages 5-16
ISBN: 978-989-758-023-9
Copyright
c
2014 SCITEPRESS (Science and Technology Publications, Lda.)

gram deviates from the formal semantics of the
language, an error is raised immediately.
This paper presents this debugger and exposes the
salient aspects of its implementation.
1.1 Debugging Web Applications
Most studies of the debugging of Web applications
consider the client-side of the applications. Beside
an early debugger for CGI applications by Vckovski
(Vckovski, 1998), most efforts concentrate on creat-
ing JavaScript debuggers for the Web browsers. Feld-
man and Sharma have both developed a remote de-
bugger for WebKit (Feldman, 2011; Sharma, 2012).
Mickens has developed a browser-agnostic JavaScript
debugger (Mickens, 2012). These tools offer facili-
ties for inspecting the JavaScript stack frame and for
breakpointing. They do not address the problem of
debugging Web applications globally. These studies
are complementary with our effort as Hop can use
them to step inside the client side execution, provided
they support the source map specification (Lenz and
Fitzgerald, 2011).
A previous study by E. Schrock (Schrock, 2009)
has identified many difficulties posed by JavaScript
when debugging Web applications. “In the early
days, the [JavaScript]’s ability to handle failure
silently was seen as a benefit. If an image rollover
failed, it was better to preserve a seamless Web ex-
perience than to present the user with unsightly error
dialogs.
This tolerance of failure has become a central de-
sign principle of modern browsers, where errors are
silently logged to a hidden error console... Now, at
best, script execution failure results in an awkward
experience. At worst, the application ceases to work
or corrupts server-side state. Tacitly accepting script
errors is no longer appropriate, nor is a one-line num-
ber and message sufficient to identify a failure in a
complex AJAX application. Accordingly, the lack of
robust error messages and native stack traces has be-
come one of the major difficulties with AJAX devel-
opment today... Ideally, we would like to be able to
obtain a complete dump of the JavaScript execution
context[.]”. This is exactly what Hop brings. In ad-
dition to offering multitier execution stacks that re-
flect the states of the server and the client, the Hop-
to-JavaScript compiler (Loitsch and Serrano, 2007)
generates codes which enable early error detection. It
also generates ECMA-262-5 strict mode (ECMA, 2009)
code which helps detecting undeclared variables and
functions that can be located inside JavaScript code
linked against Hop applications.
1.2 The Hop Programming Language
Hop has been presented in several publications (Ser-
rano et al., 2006; Boudol et al., 2012; Serrano and
Berry, 2012). We only remind its essential aspects
and show some examples that should be sufficient to
understand the rest of the paper.
Hop is a Scheme-based multitier functional lan-
guage. The application server-side and client-side
are both implemented within a single Hop program.
Client code is distinguished from server code by pre-
fixing it with the syntactic annotation ‘˜’. Server-side
values can be injected inside a client-side expression
using a second syntactic annotation: the ‘$’ mark. On
the server, the client-side code is extracted, compiled
on-the-fly into standard JavaScript, and shipped to the
client. This enables Hop clients to be executed by un-
modified Web browsers.
Except for multitier programming, the standard
Web programming model is used by Hop. A server-
side Hop program builds an HTML tree that creates
the GUI and embeds client-side code into scripts, then
ships it to the client. AJAX-like service-based pro-
gramming is made available by service definitions, a
service being a server-side function associated with a
URL. The with-hop form triggers execution of a ser-
vice. Communication between clients and servers is
automatically performed by the Hop runtime system,
with no additional user code needed.
The Hop Web application fib-html below con-
sists of a server-built Web page displaying a three-
rows table whose cells enumerate positive integers.
When a cell is clicked, the corresponding Fibonacci
value is computed on the client and displayed in a
popup window. Note the ‘˜’ signs used in lines 3,
8, 9, and 10 which mark client-side expressions.
1: (define-service (fib-html)
2: (<HTML>
3: ˜(define (fib x) ;; client code
4: (if (< x 2)
5: 1
6: (+ (fib (- x 1)) (fib (- x 2)))))
7: (<TABLE>
8: (<TR> (<TD> "fib(1)" :onclick ˜(alert (fib 1))))
9: (<TR> (<TD> "fib(2)" :onclick ˜(alert (fib 2))))
10: (<TR> (<TD> "fib(3)" :onclick ˜(alert (fib 3)))))))
11:
Let us modify the example to illustrate some Hop
niceties. Instead of building the rows by hand, we let
Hop compute them. The new Hop program uses the
(iota 3) expression (line 9) that evaluates to the list
(1, 2, 3) and the map functional operator that applies a
function to all the elements of a list. The $i expres-
sion (line 8) denotes the value of i on the server at
HTML document elaboration time.
WEBIST2014-InternationalConferenceonWebInformationSystemsandTechnologies
6

1: (define-service (fib-html)
2: (<HTML>
3: ˜(define (fib x) ...)
4: (<TABLE>
5: (map (lambda (i)
6: (<TR>
7: (<TD> "fib(" i ")"
8: :onclick ˜(alert (fib $i)))))
9: (iota 3)))))
Before delivery to a client, the server-side docu-
ment is compiled on the server into regular HTML
and JavaScript. This produces the following docu-
ment
1
:
1: <!DOCTYPE HTML>
2: <html>
3: <head> <meta ...>
4: <script src=’/usr/local/share/hop/hop s.js’>
5: </head>
6: <script>
7: function fib(x) {if(x<2) return 1; else ...}}
8: </script>
9: <table>
10: <tr><td onclick="alert(fib(1))">fib(1)</td></tr>
11: <tr><td onclick="alert(fib(2))">fib(2)</td></tr>
12: <tr><td onclick="alert(fib(3))">fib(3)</td></tr>
13: </table>
14: </html>
This program can then be executed by all standard
browsers.
If for some reason, the programmer wants the fib
calls to be evaluated on the server, three modifica-
tions are needed: i) a service must be defined as the
client cannot access directly server-side functions, ii)
the definition of the fib function must be migrated
to the server, and iii) a with-hop remote call must be
introduced:
1: (define-service (fib-html)
2: (<HTML>
3: (<TABLE>
4: (map (lambda (i)
5: (<TR>
6: (<TD> "fib(" i ")"
7: :onclick ˜(with-hop ($fib-svc $i)
8: alert))))
9: (iota 3)))))
10:
11: (define-service (fib-svc n)
12: (define (fib x) ...)
13: (fib n))
These examples illustrate the flavor of Web pro-
gramming with Hop. Many more are available on the
Hop web site
2
.
In debugging mode, Hop generates JavaScript
code that enforces types consistency, arity correct-
ness, and array bounds. In this mode, all functions
1
Some generated programs have been manually modi-
fied to fit the paper layout constraints.
2
http://hop.inria.fr
must be called with a number of arguments compat-
ible with their declaration, all accesses to the data
structures and to the arrays are verified by the runtime
system. By experience, we have found strict checking
an effective method for correcting errors that are oth-
erwise difficult to understand. Since preventing run-
time errors has a cost, Hop also supports a produc-
tion mode where types, arities, and bounds are not
enforced at runtime. This yields faster but unsafe
executions. In production mode, executions are not
guaranteed to comply with the Hop’s formal seman-
tics (Boudol et al., 2012).
1.3 Organization of the Paper
The paper is organized as follows. Section 2 presents
some debugging scenarios. Section 3 sketches the
implementation of the debugger and the debugging
mode. A comparison of the performance between the
debugging and production modes is then presented.
Section 4 presents the related work.
2 DEBUGGING SCENARIOS
In this section we show the error reports produced by
the Hop debugging mode in typical erroneous situa-
tions. The reports are accessible on the client, i.e., the
Web browser, and on the server, which prints them on
its console.
2.1 Client-side Error
Let us first consider a type error that involves client-
side and server-side computations. The server-side
program elaborates a single-button Web page which
invokes the client-side function my-callback when
clicked (line 10).
1: (module bug1 server
2: ˜(import bug1 client)
3: (export bug1-svc))
4:
5: (define-service (bug1)
6: (<HTML>
7: (<HEAD>
8: :jscript (service-resource bug1 "bug1.scm"))
9: (<BUTTON> :id "my-button"
10: :onclick ˜(my-callback)
11: "click me to raise the error")))
12:
13: (define-service (bug1-svc a b)
14: (vector a b))
The function my-callback is implemented in a sepa-
rate client-side module.
AMultitierDebuggerforWebApplications
7

1: (module bug1 client
2: $(import bug1 server)
3: (export (my-callback)))
4:
5: (define (my-callback)
6: (with-hop ($bug1-svc 11 12)
7: my-type-error))
8:
9: (define (my-type-error l)
10: (car l))
The client-side function my-callback (line 5) calls
the server service bug1-svc. When the service com-
pletes, the execution resumes on the client by in-
voking the function my-type-error. This function is
called with the vector its receives from the service.
This is wrong because its wants a pair. The vector/list
type mismatch is reported as:
File "bug1.scm", line 10, character 3:
# (car l))
# ˆ
*** CLIENT ERROR: http://localhost:8888/hop/bug1, car:
Type "pair" expected, "vector" provided -- #(11 12)
1. ˜my-type-error@bug1 client, bug1.scm:9
With-Hop trace:
2. ˜(with-hop (bug1-svc...) ...), bug1.scm:6
3. ˜my-callback@bug1 client, bug1.scm:5
4. ˜button#my-button.onclick, bug1.hop:10
The error report shows the position in the source
file of the error and the complete stack trace. Client-
side frames are prefixed with the ˜ sign. (Here, all
stack frames are client frames.) When the type error
is raised in the client-side function my-type-error the
active stack trace only contains one frame denoting
the invocation of the function my-type-error. How-
ever, the report also shows the context from which
my-type-error has been called. It shows that a click
on the button defined line 9 of bug1 server module
has called the client-side function my-callback which,
in turn, has invoked the remote service bug1-svc.
The call trace makes explicit the whole execution
flow which has conducted to the error on the client.
As it also makes explicit the network traversal (frame
#2) that took place before my-type-error is called,
it is easier to understand which actual computation
conducted to the type error.
This scenario also illustrates an important differ-
ence between Hop and JavaScript. In JavaScript a
function equivalent to my-type-error would silently
return the undefined value. In Hop debugging mode,
the type error is signaled as soon as the illegal access
gets executed.
2.2 Server-side Error
Let us modify the definition of the previous service to
introduce a server-side error:
13: (define-service (bug2-svc a b)
14: (vector (car a) b))
This is wrong as the service bug2-svg is passed an
integer for the argument a while it expects a pair. The
new error report is as follows:
File "bug2.hop", line 14, character 301:
# (vector (car a) b))
# ˆ
*** SERVER ERROR:car
Type "pair" expected, "int" provided -- 11
1. \@bug2-svc, bug2.hop:13
2. &pool-scheduler1965,
With-Hop trace:
3. ˜(with-hop (bug2-svc...) ...), bug2.scm:6
4. ˜my-callback@bug2 client, bug2.scm:5
5. ˜button#my-button.onclick, bug2.hop:10
The report locates the error inside the bug2-svc
service (services are prefixed with \@ to distinguish
them from regular functions). The stack trace shows
server-side stack frames and the client-side context
that has yielded the service invocation. This time
again the error is easy to follow and to understand as
the complete trace before the error is exposed. The
computation started with a user click on the client.
The click action has been followed by a service invo-
cation, which has raised the server-side error.
2.3 Putting Together
The Hop debugger keeps track of all the callbacks of
the client-side program. Let the callback be associ-
ated with a service invocation as seen before, with a
GUI event (mouse move, key press, ...), with a server
side event (a high level facility supported by Hop built
on top of websockets), or with a timer, Hop generates
a dedicated entry in the stack trace. Callback traces
can be combined without restriction. For instance,
suppose a service call wrapped in an after expression
(a mere JavaScript setInterval wrapper) as follows:
5: (define (my-callback)
6: (after 1000
7: (lambda ()
8: (with-hop ($bug2-svc 11 12)
9: my-type-error))))
The new error trace shows a with-hop trace preceded
by an after trace:
WEBIST2014-InternationalConferenceonWebInformationSystemsandTechnologies
8

File "bug2.hop", line 14, character 295:
# (vector (car a) b))
# ˆ
*** SERVER ERROR:car
Type "pair" expected, "bint" provided -- 11
1. \@bug2-svc, bug2.hop:13
2. &pool-scheduler1926,
With-Hop trace:
3. ˜(with-hop (bug2-svc...) ...), bug3.scm:8
4. ˜lambda, bug3.scm:7
After trace:
5. ˜after, /usr/local/share/hop/hop s.js:8254
6. ˜my-callback@bug3 client, bug3.scm:5
7. ˜button#my-button.onclick, bug2.hop:10
A Hop stack trace may also contain JavaScript
frames as JavaScript functions are treated as Hop
functions. This can be observed in the previous stack
trace with the after function (frame #5) which is
a plain JavaScript function implemented in the Hop
standard client library (the file hop s.js).
Beside full stack traces, the Hop debugger also
supports stepping. In the current version, the server-
side stepper and client-side stepper work separately
and only the client-side stepper is fully operational.
The server-side is in progress, being developed using
the techniques presented in (Kellom
¨
aki, 1993). The
implementation of the client-side stepper is briefly
discussed in Section 3.1.
3 IMPLEMENTATION
The Hop debugger relies on three elements: i) step-
per, ii) construction the stack traces, and iii) debug-
ging mode where types, array bounds, and function
arities are verified at runtime. These are presented in
this section.
3.1 Implementing the Stepper
The server-side stepper is currently being developed
using the techniques established for Lisp-like lan-
guages (Kellom
¨
aki, 1993). The client-side step-
per reuses the native stepper available in modern
browsers. The Hop-to-JavaScript compiler produces
Source Map tables (Lenz and Fitzgerald, 2011) that
let browsers step in the client side code using the
original Hop source code instead of the generated
JavaScript one.
3.2 Constructing Stack Traces
Hop client-side programs are compiled into natu-
ral JavaScript programs, namely, Hop functions are
mapped into JavaScript functions, and Hop variables
are mapped into JavaScript variables. Hence, obtain-
ing the client-side part of the Hop stack frames is
similar to obtaining a plain JavaScript stack frames,
whose technique is well known (Schrock, 2009;
Mickens, 2012; Sharma, 2012). It relies on two ob-
servations: first, JavaScript exception objects con-
tain stack information; second, there are four different
contexts in which codes get executed:
1. the global context while loading the page;
2. event listeners (GUI or server events);
3. timeouts and intervals;
4. remote service callbacks (XmlHTTPRequest).
To obtain a stack trace, the runtime environment
installs exception handlers on these four contexts, it
intercepts exceptions, and extracts their stack infor-
mation. Older techniques based on the two special
JavaScript variables caller and callee are now im-
practical as JavaScript strict mode used by Hop does
not support these variables.
3.2.1 Constructing Multitier Stack Traces
The multitier stack trace describes the current com-
putation and the context in which it has been initiated.
Contexts are computed as follows:
1. The context of a global top-level JavaScript eval-
uation is empty.
2. The context of a DOM listener specified as an at-
tribute of an HTML node consists of a description
of the node and a description of the event the lis-
tener is attached to.
3. The context of an event listener dynamically at-
tached to a DOM event consists of a description
of the DOM node plus the stack trace active at the
moment the listener is attached.
4. The context of a timeout consists of the concate-
nation of the context and the stack trace active
when the callback is registered, and a description
of the timeout itself.
5. The context of a service call (with-hop) consists
of the concatenation of the context and the stack
trace active when the remote call is spawn and a
description of the called service.
Hop stores the active context in the JavaScript
global variable hop
current stack context, which is
updated each time a new callback is registered. This
approach is correct because JavaScript execution is
single-threaded and because callbacks always run up
to completion (i.e., they are never preempted).
Let us illustrate the construction of the multitier
stack trace on two actual examples. First, let us show
AMultitierDebuggerforWebApplications
9

the compilation of an HTML button declaration as
found in the examples of section 2.1.
(<BUTTON> :id "my-button" :onclick ˜(my-callback)
"click me to raise the error")
The production mode compilation merely consists
in mangling the Hop identifier to map it into the
JavaScript identifiers space:
<button id=’my-button’
onclick=’BGl myzd2callbackzd2zzbug3 clientz00()’>
click me to raise the error
</button>
The possibility to change the compilation schema ac-
cording to external configuration is a benefit of the
Hop approach where the JavaScript code is generated
on demand by an on-the-fly compiler. Switching from
production mode to debugging mode and vice versa
merely requires switching on and off a Hop compiler
flag. In debugging mode, the compilation of the but-
ton is changed for:
1: <button id=’my-button’
2: onclick=’hop callback(
3: function () {BGl myzd2callbackzd2zzbug3 clientz00()},
4: hop callback html context handler(
5: "button#my-button.onclick", "bug2.hop", 205))
6: .call(this)’>
7: click me to raise the error
8: </button>
This code constructs an HTML context that stores
the source location of the button (line 4). It calls the
library the library function hop callback (line 2). The
wrapped callback returned from hop callback is then
called with the this parameter of the HTML state-
ment (line 6).
The hop callback function sets the global excep-
tion context (line 2) and it wraps the user callback
(proc) into a context aware callback (line 3). This
wrapped callback installs an error handler (line 4)
which signals potential errors in the context that was
active when the callback has been installed (the vari-
able ctx line 7).
1: function hop callback( proc, ctx ) {
2: hop current stack context = ctx;
3: return function() {
4: try {
5: return proc.apply( this, arguments );
6: } catch( e ) {
7: hop callback handler( e, ctx );
8: }
9: }
10: }
The function hop callback handler, which is in-
voked when an error is raised at execution time, sim-
ply extracts the stack trace it finds in the exception and
the stack trace is builds from the callback context:
1: function hop callback handler( e, ctx ) {
2: var estk = hop get exception stack( e );
3: var cstk = hop get context stack( ctx );
4: report stack frame( estck );
5: report stack frame( cstck );
6: }
To show how contexts are accumulated, let us
study the implementation of the Hop after function.
It works similarly to with-hop but it is simpler to un-
derstand as with-hop carries its own complexity inde-
pendently of stack contexts. The base implementation
of after is as follows:
function after( timeout, proc ) {
if( hop debug() >= 0 ) { /
*
debugging code
*
/ }
var i = setInterval(
function() { clearInterval( i ); proc() },
timeout );
}
When debugging is enabled (hop debug() >= 0 is
true), the extra following code is executed:
1: /
*
debugging code
*
/
2: if( !sc isNumber( timeout ) )
3: sc typeError( "after", "integer", timeout, 1 );
4: if( !("apply" in proc) )
5: sc typeError( "after", "procedure", proc, 1 );
6: try {
7: throw new Error( "after" );
8: } catch( e ) {
9: var ctx = sc cons( "After trace:",
10: hop append context(
11: hop get exception stack( e ),
12: hop current stack context ) );
13: proc = hop callback(hop arity check(proc, 0), ctx);
14: }
First, initial type tests (lines 2 and 4) are executed.
Then, before calling the setInterval JavaScript func-
tion, an exception is raised to capture the current exe-
cution trace (the function hop get exception stack.)
This stack trace is concatenated to the context active
when the function after is called. Line 13, the call to
the function hop arity check checks if the callback
provided on the call site has a correct arity. If not, it
throws an exception.
The proposed implementation of after breaks tail
recursions. Programming patterns as:
(let loop ()
(after delay
(lambda () ... (loop))))
blow the memory because the contextual stack is aug-
mented each time a new iteration of the loop is exe-
cuted. Several ad-hoc solutions are possible to work-
around this problem. The one implemented in Hop
consists in checking the top of the contextual stack.
If it is already an after frame, nothing is pushed on
the stack. Otherwise a new frame is pushed as al-
ready described. Although simplistic, we have found
WEBIST2014-InternationalConferenceonWebInformationSystemsandTechnologies
10

this solution sufficient and convenient to debug tail-
recursive programs. If needed in the future, smarter
solutions will be envisioned.
Handling the context stack on the server is sim-
pler. When a client invokes a service, it serializes
the context stack and ships it along the service argu-
ments. The server protects the execution of its service
with a handler that appends the execution trace of the
exception to the client-side context. This augmented
context is returned to the client if a server-side error
occurs.
3.2.2 Pretty-printing the Stack Trace
Pretty printing stack traces requires the debugger to
identify correctly Hop stack frames and to map the
actual locations of the generated JavaScript file into
the user source codes. In this process, a stack frame
such as:
at BGl myzd2callbackzd2zzbug1 clientz00 (bug1.js:4:60)
is translated into:
at my-callback@bug1 client, bug1.scm:10
The mapping of identifiers is straightforward. It
merely uses the standard Hop functions for man-
gling/demangling identifiers. The Hop mangling is
also used to separate stack frames corresponding to
Hop function calls and to JavaScript function calls.
Actual source locations are reconstructed by the
Hop client runtime system using the extra informa-
tions produced by the Hop-to-JavaScript compiler. It
relies on the source map tables (Lenz and Fitzger-
ald, 2011) the compiler generates for the JavaScript
steppers. These tables contain all the informations
needed to map JavaScript source positions into Hop
source positions. To make the source tables explicitly
available from standard JavaScript code, the Hop-to-
JavaScript compiler generates the extra call at the end
of each generated file:
hop source mapping url( "bug1.js", "bug1.js.map" );
This merely registers that a source map table is
available for the file bug1.js. When a stack frame
referring bug1.js has to be translated, the table is ac-
tually downloaded from the server, and a JavaScript
client library translates the JavaScript location trans-
lated into a Hop location.
3.3 Enforcing Types and Arity
JavaScript tolerates many user errors. A function can
be called with less or extra parameters than required.
An unbound variable can be set or an undeclared data
structure field accessed without raising errors. The
arithmetic operators never raise exceptions whatever
the type of the arguments they receive. Many other
examples can be found on the Web. As a conse-
quence of this tolerant semantics, Hop cannot dele-
gate to JavaScript the dynamic checking of the pro-
grams it compiles. Rather, it must checks types, func-
tion arities, and array bounds by itself.
Former studies of the compilation of strict func-
tional languages have shown that for Hop-like lan-
guages, despite functions being first class citizen, the
compiler knows the very function that is invoked on
most call sites (Shivers, 1988; Rozas, 1992). Hence,
most arity checks can be resolved statically by the
compiler. It is then sensible not to instrument the
function bodies which would penalize all the execu-
tions of the functions but to instrument only the calls
to unknown functions instead. For a call site such as:
(fun a0 a1)
when the compiler knows that fun is a function
waiting two parameters, it generates the following
JavaScript code:
fun( a0, a1 )
Otherwise, it generates:
hop check arity( fun, 2 )( a0, a1 )
The arity of the Hop compiled functions is
stored in a field called hop arity, the function
hop check arity merely compares the value of this
field to the actual number of arguments. For hand-
written JavaScript functions the field does not exist
and the test always succeeds. The library function
hop check arity is implemented as follows (for sim-
plicity only fixed arity functions are considered in the
paper):
function hop check arity( fun, arity ) {
if( "hop arity" in fun ) {
if( fun.hop arity == arity ) {
return fun;
} else {
throw new ArityError( fun, arity );
}
} else { /
*
a plain JavaScript function
*
/
return fun;
}
}
Checking the types and the array bounds is a dif-
ferent matter as in general actual types and array
bounds are unknown at compile-time. Hence, be-
fore accessing any data structure or any array, a check
must be executed. To avoid code size expansion of the
generated JavaScript codes, Hop instruments the get-
ters and setters defined in its standard library instead
of adding extra tests in the user code it generates.
Checking types at runtime slows down the execu-
tion for two reasons. First, it requires to fetch the dy-
namic types of the objects and compare them against
AMultitierDebuggerforWebApplications
11

global values. Second, it prevents the compiler from
inlining operators which contain type tests as it would
enlarge generated code size too much.
Fortunately, these costs can be significantly re-
duced using JavaScript dynamic properties which are
available since ECMAScript 5. A dynamic property is
syntactically used as a regular property but the actual
access goes through a user defined function. Let us
illustrate how Hop uses this feature with pairs objects
which are used to represent list elements. In produc-
tion mode, pairs are defined as:
function sc Pair(car, cdr) {
this. hop car = car;
this. hop cdr = cdr;
}
In debugging mode, the implementation is changed
for:
function sc Pair(car, cdr) {
this. safe hop car = car;
this. safe hop cdr = cdr;
}
Object.defineProperty( Object.prototype, " hop car", {
/
*
type errors for non pair objects
*
/
get: function() {typeError("car", "pair", this);},
set: function(v) {typeError("set-car!", "pair", this);}
} );
Object.defineProperty( sc Pair.prototype, " hop car", {
get: function() { return this. safe hop car; },
set: function(v) { this. safe hop car = v; }
} );
Using JavaScript getters lets the compiler gener-
ate the same inlined code for accessing the first and
second elements of pairs. In debugging mode, these
accesses now go through the JavaScript getters and
setters which transparently enforce type consistency.
This technique has several advantages over inserting
extra type checks in the generated code. First, the
code of the compiler is unchanged. Second, the gen-
erated code is no larger in debug mode than in produc-
tion mode. Third, even pairs accessed from JavaScript
are type checked.
We have evaluated the performance of this tech-
nique on four browsers: Firefox 23, Chromium 29,
Safari 7, and IE11. Firefox and Chromium have been
executed on the GNU-Linux 3.10.10 running on an
Intel Xeon E5-1660, 3.3GHz. Safari has been exe-
cuted on a 2.6GHz core i7 running MacOS 10.9.1,
and IE on a core 2.7GHz i5 running Windows 7. We
have compared the performance of unsafe access, ex-
plicitly type check, and property verified access
3
.
3
Note that it would make few sense to compare the raw
performances of the browsers as the hardware running them
differs.
unsafe check property
Chromium 44ms 209ms 44ms
Firefox 45ms 177ms 296ms
Safari 39ms 665ms 4678ms
IE 91ms 458ms 1305ms
This experiment shows a contradictory result. On
the one hand, there is a huge benefit in using dynamic
properties instead of using explicit type checks on
Chromium. On the other hand, there is a drawback
in using them on other browsers. As the techniques
for implementing properties efficiently is now well
known because published (Schneider, 2012), we fore-
see that all browsers will implement them efficiently
too in a close future. Since properties have the advan-
tages of their own mentioned earlier we have opted
for using them, although they currently penalize non
V8-based browsers.
Type checking numerical operators is also re-
quired in debugging mode as JavaScript replaces
silently all non numeral values with 0 or NaN. For that,
a prelude is added to each operation which enforces
the types of the arguments. For instance, the ‘-’ func-
tion is defined as:
function sc minux2( x, y ) {
if( typeof x !== "number" )
sc typeError( "-", "number", x, 3 );
if( typeof y !== "number" )
sc typeError( "-", "number", y, 3 );
return = x - y;
}
This slows down dramatically the performance be-
cause it adds two extra tests and it disables inlining
for avoiding code size explosion. We have tried to
improved the implementation by testing only the re-
sult of the operation as:
function sc minux2( x, y ) {
var res = x - y;
if( isNaN( res ) ) {
if( typeof x !== "number" )
sc typeError( "-", "number", x, 3 );
else
sc typeError( "-", "number", y, 3 );
}
return res;
}
The JavaScript function isNaN is a property of the
global object. It is then difficult for a compiler, to
implement it as efficiently as a simple operator. As
suggested by the ECMA-262-5 specification (ECMA,
2009) (see Section 15.1.2.4), calling isNaN(v) can be
replaced with the more efficient expression v!==v .
We have compared the three methods on the fib
benchmark which uses extensively additions, subtrac-
tions, and integer comparisons.
WEBIST2014-InternationalConferenceonWebInformationSystemsandTechnologies
12

type-based isNaN-based !==-based
Chromium 71ms 101ms 71ms
Firefox 19ms 101ms 54ms
Safari 48ms 100ms 55ms
IE 129ms 261ms 136ms
This experiment has contradicted our intuition as it
clearly shows the benefit of using the explicit type
checking approach on all browsers, even if it executes
more tests at runtime.
3.4 Global Performance Evaluation
For constructing the contextual stack, an exception is
raised each time a callback is registered. Whatever
the speed of raising and catching JavaScript excep-
tions, this has a minor impact on the overall perfor-
mance as callbacks are installed when pure JavaScript
performance does not matter: the network times dom-
inate the preparation of the evaluation of a with-hop
call; the setup time of a timeout is unimportant as its
purpose is to slow down the execution or to yield the
processor. The parsing of the string denoting the exe-
cution stack and the mapping the JavaScript source lo-
cations to the actual Hop source locations would have
a much significant impact as it allocates many tempo-
rary data structures. This takes time and this exercises
the garbage collector. Hopefully it can be delayed un-
til a stack must be actually displayed. In the fast path
where no error is raised, the parsing of the stack is
never executed.
Performance of arity checking and type checking
is a different matter as these require extra tests that get
executed frequently. We have measured their impact
on a set of representative benchmarks. As we have al-
ready established that the performances of Hop client-
side programs is on par with similar hand-written
JavaScript programs (Loitsch and Serrano, 2007), the
results presented here also give an intuition of how
JavaScript would be impacted if it was supporting an
equivalent debug mode.
For each benchmark, we have measured the raw
speed obtain in production mode, the speed of the in-
strumented version where only the arity is checked,
and the fully instrumented version where types are
also systematically checked. The results of this ex-
periment are presented Figure 1.
Measuring the performance of browser-hosted
JavaScript execution engines is not easy. Profiling
tools are unusable as they introduce a bias of their
own. Measuring the CPU or system time is impos-
sible as the JavaScript library lacks accesses to the
system information. The only possibility we have
consists in measuring the user observable execution
times. To make performance evaluation even more
complex, JavaScript usually stops programs that run
more than 5 seconds. We then have to measure short
lasting executions, which is subject to a lot of varia-
tions depending on the system state (cache, JIT infor-
mation, etc.). In this context, we have found relevant
to run a benchmark several times, collecting all the
execution times. When the sum of these times reaches
or exceeds 10 seconds, the benchmark is stopped and
the mean time is reported. This methodology is not
totally accurate but it gives a decently correct idea of
the actual raw speed of a benchmark.
The first observation is that degradation varies
significantly from one benchmark to another but
on Chromium and Firefox, the two most popular
portable browsers, we deem it acceptable. In general,
Chromium is the less impacted browser. This proba-
bly is a consequence of its dynamic properties imple-
mentation observed in Section 3.3 that lets it enforce
types efficiently.
The second observation is that degradations seem
not to depend on the benchmark themselves. For
instance, in debug mode, Fib behaves poorly on
Chromium and decently on Firefox. An opposite sit-
uation is observed for Earley. Probably, for a reason
or another, enforcing types on these benchmarks de-
feats the JIT compilers differently. As we consider
a worse ratio of 4 or 5 for debugging acceptable, we
have not investigated any further in order to minimize
the impact of type checking on performance.
The third observation is that arity checking is un-
noticeable but on the two benchmarks Beval and Con-
form. These two benchmarks use higher order func-
tions extensively. This programming style imposes
arity verification at runtime. The overhead is then ex-
pected.
4 RELATED WORK
Multitier programming for the Web has been pio-
neered by GWT from Google, Links from the Univer-
sity of Edinburgh (Cooper et al., 2006), and Hop. The
three languages have appeared almost simultaneously
in 2006. Other languages have then followed such as
Ocsigen (Vouillon and Balat, 2013), iTask3, or Opa
(Binsztok et al., 2013). Among the Hop competitors,
only GWT considers the problem of debugging Web
applications. GWT supports debugging of multitier
applications but cannot debug JavaScript components.
GWT has nothing similar to the Hop multitier stack.
Nodejs is a platform built on top of V8, the
JavaScript runtime used by Chrome. Nodejs is used
for building fast, scalable network applications, such
AMultitierDebuggerforWebApplications
13
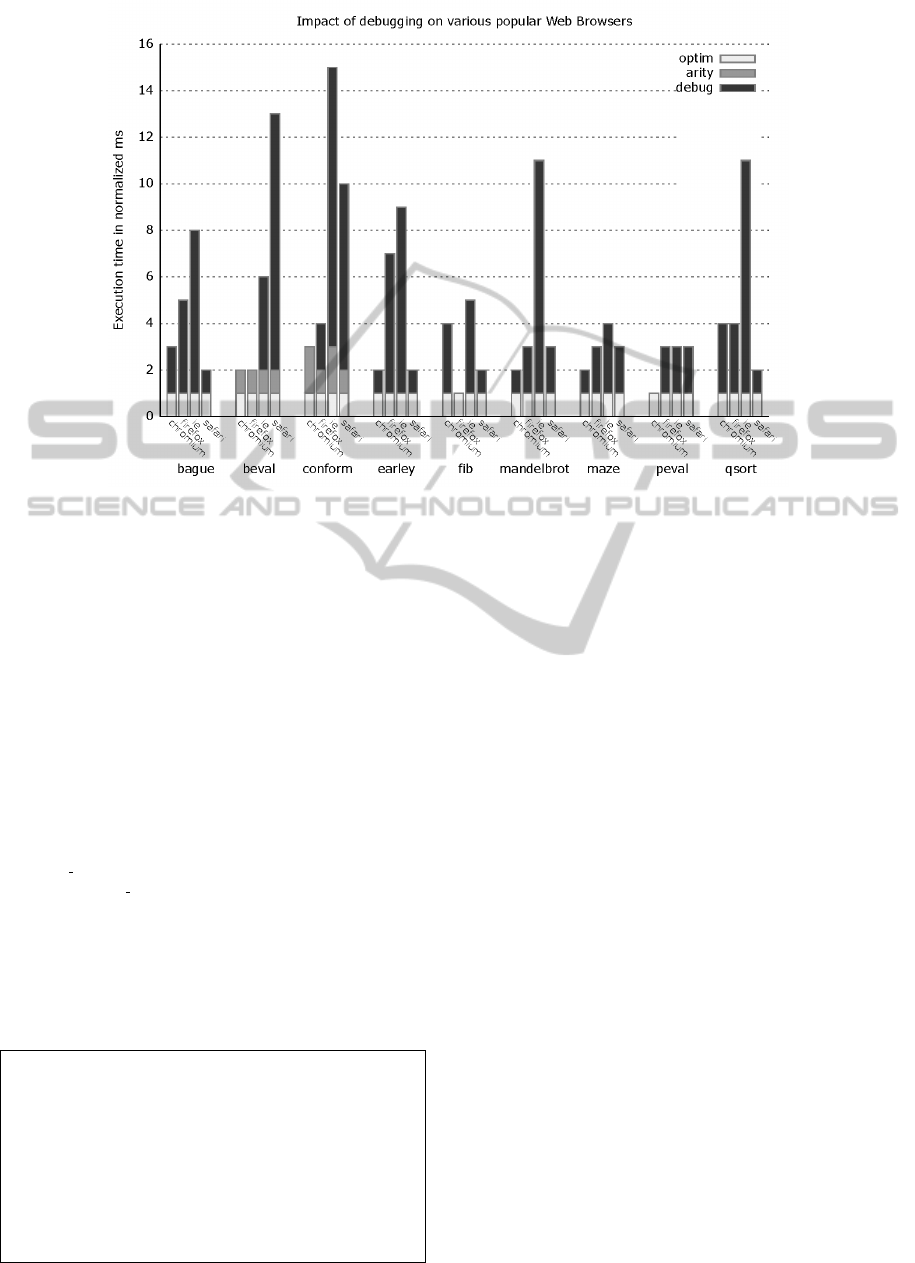
Figure 1: This experiment reports about the impact of debugging on client-side speed. For each benchmark and for each
browser, the optimized speed is used as a base value for that benchmark. The experiment presents the slowdowns imposed by
the debugging mode. For instance, on the Bague benchmark, arity checking incurs no performance penalty to Chromium and
Firefox but type checking slows down Chromium by a factor of 3 and Firefox by a factor of 5.
as Web servers. Nodejs is an effective way of support-
ing JavaScript on both ends of the application. How-
ever a Nodejs Web application is still conceived as
two separated software components and debugging is
also separated.
The following example mimics the server error
example of Section 2.2.
var http = require("http");
var url = require("url");
http.createServer(function(request, response) {
var url parts = url.parse(request.url, true);
var query = url parts.query;
response.writeHead(200, {"Content-Type": "text/html"});
response.write("<html>"+query["x"]["car"]+"</html>");
response.end();
}).listen(8888);
When executed, it produces the following trace.
node1.js:10
+ query["x"]["car"]
ˆ
TypeError: Cannot read property ’car’ of undefined
at Server.<anonymous> (node1.js:10:40)
at Server.EventEmitter.emit (events.js:98:17)
at HTTPParser.parser.onIncoming (http.js:2056:12)
at HTTPParser.parserOnHeadersComplete (http.js:120:23)
at Socket.socket.ondata (http.js:1946:22)
at TCP.onread (net.js:525:27)
The error is correctly located in the server source
file but the stack trace is oblivious of the client-side
execution that has preceded the server computation.
It merely reports that the error as occurred in the con-
text of answering an HTTP request but without much
details. Running Nodejs in debug mode could give
access to extra informations about the nature of the
HTTP request but it will still lack informations about
the client state. The techniques proposed in this paper
could improve this situation.
Popular modern JavaScript frameworks raise the
abstraction level of client-side programs by offering
facilities for generating client-side programs at run-
time and for communicating with the server more eas-
ily. This makes developing applications easier but
as of the current versions, it also makes debugging
more difficult because the code automatically gener-
ated by the runtime system shows up when an error is
raised. Let us illustrates this with the Google’s Angu-
larjs framework (Google, 2013). Let us consider the
tutorial available on the framework Web page which
illustrates Ajax programming with the following ex-
ample:
var catApp = angular.module(’catApp’, []);
catApp.controller(’PhoneListCtrl’, [’$scope’, ’$http’,
function ($scope, $http) {
$http.get(’phones.json’).success( function(data) {
$scope.phones = data; });
$scope.orderProp = ’age’; }]);
WEBIST2014-InternationalConferenceonWebInformationSystemsandTechnologies
14

Introducing a syntax error in phones.json produces:
SyntaxError: Unexpected token }
at Object.parse (native)
at fromJson (angular.js:1035:14)
at $HttpProvider.defaults.defaults.transformResponse
(angular.js:6926:18)
at angular.js:6901:12
at Array.forEach (native)
at forEach (angular.js:302:11)
at transformData (angular.js:6900:3)
at transformResponse (angular.js:7570:17)
at wrappedCallback (angular.js:10905:81)
at angular.js:10991:26
As it can be seen, the whole execution trace is only
populated with Angularjs entries which none is ex-
plicitly mentioned in the user program. Even more
important, the stack trace it totally silent about the
controller’s code and the HTTP request. The tech-
niques presented in this paper could help presenting
less obscure stack traces to the programmer.
The tolerant semantics of JavaScript makes it in-
convenient to be used as the target of the compiler of
another programming language. The checks executed
at runtime by JavaScript are likely to be either insuf-
ficient if the source language is safe, or superfluous
if the source language is unsafe. In Hop debugging
mode, each access is double-checked. Once by Hop
and once by JavaScript which ensures that the exe-
cution does not corrupt the memory. Of course, this
double checking slows down executions. In this re-
spect, the asm.js endeavor (Herman et al., 2013) is
promising. It could become an interesting target for
the Hop client-side compiler.
There is a whole line of research which consists
in typing JavaScript. Some focus on inferring static
types of JavaScript programs (Jensen et al., 2009),
some such as TypeScript (Microsoft, 2013) extend
the language to support type annotations. The shared
objective is to enable JavaScript errors detection at
compile-time. This is orthogonal to our effort as our
purpose is to detect unexpected behaviors at runtime.
5 CONCLUSIONS &
PERSPECTIVES
The lack of complete debugging information is ac-
knowledged as a major difficulty when developing
Web applications (Schrock, 2009). Using the Hop
multitier setting we have solved this problem by creat-
ing a debugger which reports full stack traces. When
an error is raised, the programmer is presented with
the complete execution trace composed of server-side
and client-side frames that have conducted to the er-
ror. The Hop runtime environment supports a debug-
ging mode where types, arity, and bounds are strictly
enforced. Combining the debugger and the debug
mode makes error easier to localize and to understand.
The presented debugger exposes a unified execu-
tion stack that reflects both ends of the application but
it uses two separate steppers that cannot collaborate.
In a further step, we will create a global stepper that
will be able to traverse the network. Stepping forward
seems easy to obtain because it will just require the
implementation of a collaboration layer between two
existing tools. Inspecting the execution stack back-
ward is more hypothetical since it requires to save ex-
ecution traces potentially infinitely.
The presented techniques rely on the multitier
paradigm to expose a global and coherent view of the
execution between the server and the client. They also
rely on code generation to instrument the code actu-
ally executed on the browser. In Hop this is imple-
mented in a single runtime environment whose main
element is a custom bootstrapped web server embed-
ding compilers for generating HTML and JavaScript
on-the-fly. In addition to supporting better debug-
ging, this approach also enables fast dynamic HTTP
responses servers (Serrano, 2009). This approach also
has drawbacks: as it is does not rely on mainstream
tools and techniques, it attracts few developers. In
consequence, Hop offers less libraries and support
than popular languages. Our response to this problem
consists in supporting a deep compatibility between
Hop and the standard Web technologies in order to
make HTML, CSS, third party JavaScript programs,
and Web services as easy to use in Hop as they are
in JavaScript, PHP, or any other standard tool (Ser-
rano and Berry, 2012). It remains that Hop relying on
the Scheme programming language, an academic pro-
gramming language, is unlikely to get massive adop-
tion. As this is our objective, we now consider a rad-
ical evolution. We are then considering transposing
the Hop principles to JavaScript. The recent evolu-
tions of JavaScript such as the EcmaScript 6 quasi-
literal extensions (ECMA, 2013) that offers a stan-
dard mean for expressing client- and server-side code
within a single JavaScript source file and the fast V8-
based server-side environments are paving the road
to new Web development environments for which the
contributions presented in this paper might be useful.
REFERENCES
Binsztok, H., Koprowski, A., and Swarczewskaja, I. (2013).
Opa: Up and Running. O’Reilly Media.
Boudol, G., Luo, Z., Rezk, T., and Serrano, M. (2012). Rea-
AMultitierDebuggerforWebApplications
15

soning about Web Applications: An Operational Se-
mantics for HOP. ACM Transactions on Programming
Languages and Systems (TOPLAS), 34(2).
Cooper, E., Lindley, S., Wadler, P., and Yallop, J. (2006).
Links: Web Programming Without Tiers. In 5th In-
ternational Symposium on Formal Methods for Com-
ponents and Objects (FMCO), pages 266–296, Ams-
terdam, The Netherlands.
ECMA (2009). Ecma-262: Ecmascript language specifica-
tion.
ECMA (2013). Ecma-262: Ecmascript quasi-literals
(ecma-262 edition 6, rev 21). http://wiki.ecmascript-
.org/doku.php?id=harmony:quasis.
Feldman, P. (2011). WebKit Remote Debugging.
http://www.webkit.org/blog/1620/webkit-remote-
debugging.
Google (2013). Angularjs. http://angularjs.org/.
Herman, D., Wagner, L., and Zakai, A. (2013). asm.js,
Working Draft - 17 march 2013. http://asmjs.org/spec-
/latest/.
Jensen, S., Møller, A., and Thiemann, P. (2009). Type anal-
ysis for javascript. In Proceedings of the 16th Inter-
national Symposium on Static Analysis (SAS), pages
238–255, Berlin, Heidelberg. Springer-Verlag.
Kellom
¨
aki, P. (1993). Psda portable scheme debugger. SIG-
PLAN Lisp Pointers, VI(1):15–23.
Lenz, J. and Fitzgerald, N. (2011). Source Map Revision 3
Proposal – better bidirectional mapping.
Loitsch, F. and Serrano, M. (2007). Hop Client-Side Com-
pilation. In Proceedings of the 8th Symposium on
Trends on Functional Languages (TFL), New York,
USA.
Mickens, J. (2012). Rivet: Browser-agnostic Remote De-
bugging for Web Applications. In Proceedings of
the Usenix Annual Technical Conference (ATC), pages
30–43, Boston, MA, USA.
Microsoft (2013). TypeSscript, Language Specification,
version 0.9.5.
Rozas, G. (1992). Taming the Y operator. In Confer-
ence Record of the 1982 ACM Symposium on Lisp and
Functional Programming (LFP), pages 226–234, San
Francisco, California, USA.
Schneider, F. (2012). High performance JavaScript with V8.
http://cs.au.dk/ jmi/VM/IC-V8.pdf.
Schrock, E. (2009). Debugging AJAX in Production. ACM
Queue, 7(1).
Serrano, M. (2009). HOP, a Fast Server for the Diffuse
Web. In proceedings of the 11th international con-
ference on Coordination Models and Languages (CO-
ORDINATION’09) (invited paper), Lisbon, Portugal.
Serrano, M. and Berry, G. (2012). Multitier Programming
in Hop - a first step toward programming 21st-century
applications. Communications of the ACM, 55(8):53–
59.
Serrano, M., Gallesio, E., and Loitsch, F. (2006). HOP,
a language for programming the Web 2.0. In Pro-
ceedings of the First Dynamic Languages Symposium
(DLS), Portland, Oregon, USA.
Sharma, A. J. (2012). Better Web Development with We-
bKit Remote Debugging. In Proceedings of the World
Wide Web Conference (WWW), Lyon, France.
Shivers, O. (1988). Control Flow Analysis in Scheme.
In Proceedings of the SIGPLAN ’88 ACM SIGPLAN
Int’l Conference on Programming Language Design
and Implementation (PLDI), pages 164–174, Atlanta,
Georgia, USA.
Vckovski, A. (1998). wshdbg - a Debugger for CGI Appli-
cations. In Proceedings of the 6th conference on An-
nual Tcl/Tk Workshop (TCLTK), pages 89–96, Berke-
ley, CA, USA.
Vouillon, J. and Balat, V. (2013). From bytecode to
Javascript: the Js of ocaml compiler. Software: Prac-
tice and Experience, doi: 10.1002/spe.2187.
WEBIST2014-InternationalConferenceonWebInformationSystemsandTechnologies
16
