
Mutation Detection System for Actualizing Traffic Sign Inventories
Lykele Hazelhoff, Ivo Creusen and Peter H. N. de With
CycloMedia Technology B.V, Zaltbommel, The Netherlands
Eindhoven University of Technology, Eindhoven, The Netherlands
Keywords:
Object Detection, Traffic Sign Recognition, Object Classification, Mutation Detection.
Abstract:
Road safety is influenced by the adequate placement of traffic signs. As the visibility of road signs degrades
over time due to e.g. aging, vandalism or vegetation coverage, sign maintenance is required to preserve a high
road safety. This is commonly performed based on inventories of traffic signs, which should be conducted
periodically, as road situations may change and the visibility of signs degrades over time. These inventories
are created efficiently from street-level images by (semi-)automatic road sign recognition systems, employing
computer vision techniques for sign detection and classification. Instead of periodically repeating the complete
surveying process, these automated sign recognition systems enable re-identification of the previously found
signs. This results in the highlighting of changed situations, enabling specific manual validation of these cases.
This paper presents a mutation detection approach for semi-automatic updating of traffic sign inventories,
together with a case study to assess the practical usability of such an approach. Our system re-identifies
94.8% of the unchanged signs, thereby resulting in a significant reduction of the manual effort required for
the semi-automated actualization of the inventory. As the amount of changes equals to 16.9% of the already
existing signs, this study also clearly shows the economic relevance and usefulness of periodic updating road
sign surveys.
1 INTRODUCTION
Road safety is influenced by the adequate placement
and optimal visibility of traffic signs, e.g. to warn
road users for upcoming dangerous situations, or to
inform drivers about speed limits or other restrictions.
As the visibility of traffic signs degrades over time,
e.g. due to vandalism, accidents, aging or vegetation
coverage, sign maintenance is required to preserve a
high road safety. This process is aided by accurate and
up-to-date inventories of traffic signs, which are used
by (governmental) instances tasked with road mainte-
nance. These inventories are traditionally performed
manually, where each road is tracked and the sign type
and location of all encountered signs are recorded.
The efficiency of this time-consuming process can be
improved by exploiting street-level (panoramic) im-
ages, which are nowadays captured in many coun-
tries by several private companies and provide a re-
cent and accurate overview of the road infrastruc-
ture. The usage of these images enables weather-
independent indoor surveys, where all images are in-
spected and all encountered road signs are annotated
by hand. The efficiency of this process can be further
improved by exploiting computer-vision techniques
for the (semi-)automatic creation of such inventories,
where object detection and classification techniques
are exploited for sign detection and sign type catego-
rization.
These surveys should be conducted periodically
(e.g. yearly) to preserve a high quality, as road sit-
uations are subject to continuous changes, e.g. due
to the above-mentioned factors, the addition of new
roads or the altering of existing roads (e.g. a crossing
changing from intersection to roundabout). As only a
small minority (e.g. 10%) of the signs change yearly,
the computer-vision based systems enable very ef-
ficient actualization of road sign inventories, since
they allow for the re-identification of the unchanged
signs, such that the encountered mutations are high-
lighted. This indication is also beneficial for the agen-
cies tasked with sign maintenance, as missing signs
can be easily noted. Besides maintaining a higher
road safety, the quality of existing road sign invento-
ries is preserved, which is also beneficial for usage in
navigation systems and emerging autonomously driv-
ing vehicles.
Although traffic signs have discriminative colors
and shapes to attract visual attention, recognition of
road signs from a driving vehicle is a challenging task
705
Hazelhoff L., Creusen I. and de With P..
Mutation Detection System for Actualizing Traffic Sign Inventories.
DOI: 10.5220/0004793707050713
In Proceedings of the 9th International Conference on Computer Vision Theory and Applications (PANORAMA-2014), pages 705-713
ISBN: 978-989-758-004-8
Copyright
c
2014 SCITEPRESS (Science and Technology Publications, Lda.)
(a) (b) (c)
(d) (e) (f)
(g) (h) (i)
(j) (k) (l)
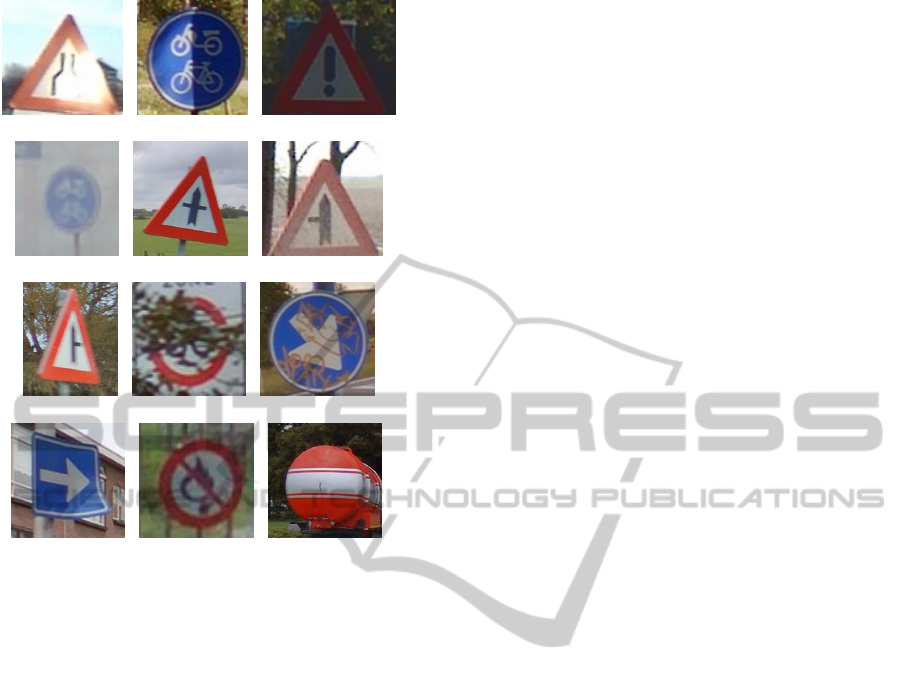
Figure 1: Illustration of challenges for traffic sign recog-
nition from driving vehicles. (a)-(d) signs captured under
challenging weather conditions. (e)-(g): sign types with
very small inter-type variations. (h)-(j): signs with lowered
visibility. (k)-(l): sign look-a-like objects.
for several reasons. At first, recording in outside en-
vironments implies that the capturings are taken un-
der a wide range of weather conditions. Furthermore,
capturing from a driving vehicle may result in mo-
tion blur or occlusions by e.g. other road users. Sec-
ond, a large variety of sign types exist, from which
some only vary in small details. Besides this, some
sign types are designed to contain custom texts and/or
symbols, leading to very large appearance differences
between instances of the same sign. Thirdly, the vis-
ibility of signs may be degraded, e.g. due to aging,
vandalism or vegetation coverage, complicating sign
detection. Fourth, there exist many sign look-a-like
objects, such as e.g. signs for restricting dog access or
directives to customer parking, which are not official
traffic signs. Examples of these challenging factors
are portrayed by Fig. 1.
1.1 Related Work
Despite these challenges, numerous systems for au-
tomated surveying of road signs from street-level im-
ages are described in literature. Most papers focus on
the detection of road signs within individual images.
For example, Overett and Petersson (Overett and Pe-
tersson, 2011) present a cascaded detector for speed
sign detection, based on Histogram of Oriented Gra-
dients (HOG) features, which attains a detection rate
of 98.8%. In (Bonaci et al., 2011), a system for de-
tection of triangular warning signs is presented, based
on prefiltering with a full-color version of the Viola-
Jones algorithm, followed by classification of HOG
features with a neural network. This results in the cor-
rect detection of 260 of the 265 present signs, where
241 signs are also correctly classified. The previous
approaches focus on the detection of a single sign ap-
pearance class, whereas others aim at the recognition
of multiple sign classes. For example, Maldonado-
Bascon et al. (Maldonado-Bascon et al., 2008) ap-
ply color segmentation to extract sign regions, af-
ter which the shape of the signs within the retrieved
blobs are extracted, followed by classification with a
Support Vector Machine (SVM). They report that 98
of the present 102 signs are detected at least once.
The above-mentioned systems focus on the recogni-
tion of road signs within single images. Other re-
searchers have extended this to multiple images, for
example by tracking the signs over consecutive im-
ages, thereby reducing the number of false detections,
as e.g. described in (Lafuente-Arroyo et al., 2007).
Besides this, some proposals describe complete sys-
tems for performing inventories of road signs, result-
ing in a list of road signs for a region, including both
sign types and positions. Such a system is described
in (Timofte et al., 2009),(Timofte et al., 2011), where
both single-image and multi-view analysis are em-
ployed, exploiting images captured from a van with 8
cameras. They are able to detect 95.3% and clas-
sify 97% of the signs, focusing on 62 different sign
types. A similar architecture is followed by Hazel-
hoff et al. (Hazelhoff et al., 2012b), based on street-
level panoramic images. Their system supports 92
different sign types. They report correct detection
and classification scores of 89.7% and 95.3%, respec-
tively, measured in a large-scale experiment covering
over 160 km of road.
1.2 Our Approach and Contributions
The above-mentioned systems for surveying road
signs from street-level images all focus on perform-
ing baseline inventories. In this paper, we extend
these approaches with a mutation detection compo-
nent. Based on an already existing, outdated, inven-
tory, this module aims at re-identifying the present
road signs in newly captured street-level images. This
enables (semi-)automatic updating of the existing in-
ventory using the found differences. Since the vast
VISAPP2014-InternationalConferenceonComputerVisionTheoryandApplications
706
Upside red triangular signs
Red triangular signs
Red circular signs
Red-white circular signs
Blue circular signs
Redblue circular signs
Yellow diamond signs
Red octogon signs
Blue rectangular signs
...
...
...
Yellow rectangular signs
White rectangular signs
...
White circular signs
...
Red arrow signs (left) Red arrow signs (right)
...
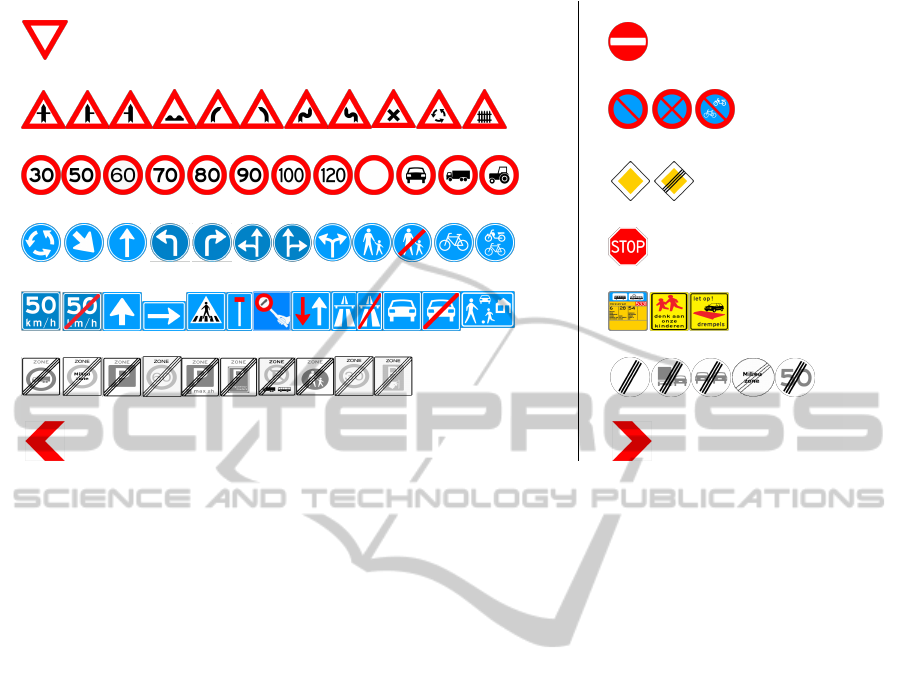
Figure 2: Overview of all sign classes supported by our road-sign inventory system, together with examples of sign types
contained within those classes.
majority of signs are unchanged, this leads to a large
efficiency gain for preserving a high inventory quality.
This mutation detection system can be designed in
multiple ways. In our case, we already have an exist-
ing complete road sign recognition system for (semi-
)automated surveying (Hazelhoff et al., 2012b). We
have therefore chosen to reuse this system, and tried
to design a mutation detection system that forms an
extension of the already existing system. As a con-
sequence, the proposed mutation signaling approach
has an architecture that first employs the existing in-
ventory system, followed by additional processing to
detect mutations.
Therefore, our mutation detection approach con-
sists of two stages. At first, we perform a new in-
ventory, using our existing road sign recognition sys-
tem (Hazelhoff et al., 2012b). This system operates
on street-level panoramic images, which are recorded
at each public road, using a capturing interval of 5 m.
The system starts with the identification of the road
signs present in the individual images, where we em-
ploy a family of independent detectors which all fo-
cus on a specific sign class (group of signs with a
similar shape, such as blue circular or red triangu-
lar). Afterwards, detections found in multiple images
are combined to retrieve the real-world positions (lat-
itude, longitude) of the signs, followed by a classifi-
cation stage to retrieve the sign type (e.g. warning,
sharp curve ahead) for each of the positioned signs.
This system employs the same generic and learning-
based techniques for all supported sign classes, based
on class-specific training data. It currently supports
14 different sign classes, involving over 150 different
sign types, as illustrated in Fig. 2. This system de-
tects 98.1% of the signs within at least a single image,
where over 93% of the road signs are successfully po-
sitioned, from which about 97.3% are correctly clas-
sified. In this paper, we will provide a brief overview
of the employed system. In the second stage, aim-
ing at mutation detection, we compare the resulting
inventory with an existing, high-quality, but outdated
survey, e.g. performed in a previous year. This com-
parison aims at the re-identification of all unchanged
signs, thereby highlighting changed situations. These
changes can be employed to update the existing in-
ventory, and as a bonus, are directly beneficial for
road maintenance, since the differences are immedi-
ately available.
Besides a description of the proposed mutation de-
tection approach, this paper also contains a case study
of the application of this system on a large geograph-
ical area, containing over 1, 500 km of road. Next to
numerical results and observations about the perfor-
mance, we also discuss the required manual interven-
tion to preserve a high inventory quality needed for
professional applications.
The remainder of this paper is organized as fol-
lows. Section 2 contains the system overview, fol-
lowed by a detailed description of the road sign
recognition and the mutation detection subsystems in
Sect. 3 and. 4, respectively. Afterwards, Sect. 5 de-
scribes the performed experiments and results, fol-
MutationDetectionSystemforActualizingTrafficSignInventories
707
Sign classification
detector for
red triangular signs
classifier for
red triangular signs
detector for
give-way signs
detector for
red circular signs
detector for
yellow diamond signs
classifier for
red circular signs
classifier for
yellow diamond signs
Single-image sign detection
Multi-view
3D sign
positioning
Single-image sign detection
Single-image sign detection
Road sign inventory system
Mutation detection system
List of newly placed signs List of removed signs
List of unchanged signs
Inventory result
Inventory result of previous year
Mutation detections
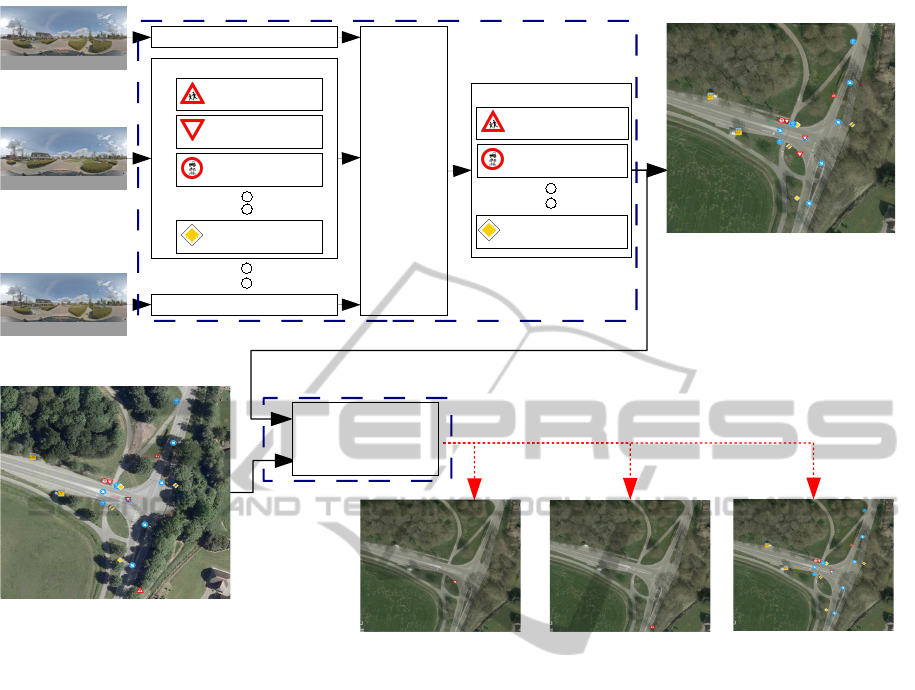
Figure 3: System overview of the mutation detection approach described in this paper. The two submodules, the road sign
inventory system and mutation detection system, are marked separately.
lowed by the conclusions in Sect. 6
2 SYSTEM OVERVIEW
The system architecture of the described mutation de-
tection approach is displayed in Fig. 3, and consists of
two stages. In the first stage, all road signs visible in
recently captured street-level images are identified by
a road sign inventory system (Hazelhoff et al., 2012b),
resulting in a complete inventory as described above.
The second stage consists of a comparison between
the resulting signs and the inventory of a previous
year. This results in a list of mutations, which can di-
rectly be categorized into newly placed, removed and
unchanged signs.
In the first stage, the road sign recognition system
consists of three primary modules, which are briefly
described below.
1. Single-image Sign Detection. Each image is ana-
lyzed independently to retrieve the pixel locations
of all present road signs. This module employs
a family of generic and learning-based detectors,
that operate independently for each sign class, but
exploit the same detection techniques. These de-
tectors are kept broadly generic to allow detection
of distorted signs and sign look-a-like objects.
2. Multi-view 3D Sign Positioning. The detections
found in the individual images are combined to
retrieve the real-world positions of the signs,
based on the geometrical properties of our source
data. This process operates independently per
sign class.
3. Sign Classification. For each localized sign, the
sign class is exploited during the determination
of the sign type. This involves the analysis of all
detections used during positioning of the respec-
tive sign, where each detection is classified in-
dependently. Afterwards, a weighted voting step
is employed to compute the sign type, where the
weights are based on an estimation of the visibil-
ity of the corresponding detection.
VISAPP2014-InternationalConferenceonComputerVisionTheoryandApplications
708

3 OVERVIEW OF THE ROAD
SIGN RECOGNITION SYSTEM
3.1 Single-image Sign Detection
The first module of the traffic sign recognition sys-
tem consists of processing all individual images to
detect the present road signs. Since each sign class
differs significantly in shape and color (as indicated
by Fig. 2), we follow a generic and learning-based
approach, such that the same detector can be applied
to each class, based on specific training data for each
respective sign appearance class. The employed de-
tector is based on Histogram of Oriented Gradients
(HOG) (Dalal and Triggs, 2005), which focuses on
(color) intensity differences. As traffic signs are de-
signed to attract visual attention and have discrimina-
tive colors and shapes, the standard HOG approach is
modified to include color information, as extensively
described in (Creusen et al., 2010)(Creusen et al.,
2012).
The HOG-based sign detection algorithm starts by
dividing each image into cells of 8 × 8 pixels, where
a gradient orientation histogram is computed for each
cell. The original HOG algorithm extracts the max-
imum gradient over all color channels. However,
our system computes the gradients over all individual
color channels in the LUV color space, resulting in
three histograms per cell. These histograms are nor-
malized w.r.t. the histograms extracted from the same
color channel in adjacent cells. Afterwards, a slid-
ing window covering 5 × 5 cells is moved over the
cells, and all included histograms are concatenated.
The resulting feature vector is used for classification
by means of a linear Support Vector Machine (SVM).
This procedure is repeated at multiple scales to ob-
tain scale invariance. Afterwards, all overlapping de-
tections are merged using Meanshift (Comanicu and
Meer, 2002).
This algorithm is executed independently per sign
class, resulting in a list of detections per image. Each
detection is characterized by the pixel coordinates of
its bounding box and the sign class of the detector that
performed the corresponding detection.
3.2 Multi-view 3D Sign Positioning
This stage combines the detections found in multiple
images to retrieve the real-world coordinates of the
detected traffic signs, based on the geometrical prop-
erties of our source data. Due to the extensive cali-
bration of the capturing systems, there exists a linear
relationship between the angular orientations and the
pixel coordinates. This enables the calculation of the
position of an object based on triangulation, when (at
least) two pixel locations corresponding to the same
object are known in an equal number of images. The
positioning process exploits the consistent detection
of the same sign over consecutively captured images,
thereby also removing most of the false detections
that are not consequently found in neighboring im-
ages.
The positioning stage operates independently per
sign class, and starts with the pair-wise combining of
nearby images. For each image couple, all detections
of the corresponding sign class are pair-wise com-
bined, where each pair leads to a hypothesis of the
position of a road sign. These hypotheses are clus-
tered around the real road sign positions, and are ex-
tracted using Meanshift (Comanicu and Meer, 2002).
Afterwards, each resolved cluster is processed, where
the following properties are verified.
• Each detection may be only present in a single
cluster. Detections also contained in a cluster hav-
ing a larger or equal cardinality are removed.
• Detections for which at least one position hypoth-
esis is located farther away than 33 cm from the
cluster center, are removed from the cluster.
• Clusters with less than 3 detections are discarded,
since clusters with more than 2 detections enable
validation of the found position.
This process results in the 3D positions of the detected
signs, where next to the position, also the sign class is
known. For clarity, we will denote these positioned
signs as 3D signs. Our road sign recognition system
is able to position about 93% of the traffic signs con-
tained in a geographical region.
3.3 Sign Classification
All retrieved 3D signs are subject to classification to
retrieve their sign type, given their sign class. This
process employs generic and learning-based tech-
niques, such that the same procedure is executed for
each sign class, based on class-specific training data.
The classification process is described extensively
in (Hazelhoff et al., 2012a). This approach consists
of two stages. In the first stage, all detections used
during positioning the 3D sign are classified indepen-
dently. The second stage combines the obtained clas-
sification results, where we employ weighted voting
to retrieve the overall sign type.
The first stage aims at the categorization of the
individual detections. Our classification approach
exploits both structural information and key feature
counting (Bag of Words (BoW) (Csurka et al., 2004)),
which both focus on different types of information.
MutationDetectionSystemforActualizingTrafficSignInventories
709

(a) (b) (c) (d)
Figure 4: Illustration of a 3D sign. All corresponding detec-
tions are shown, sorted by the capturing-to-sign distance.
Both methods employ SIFT descriptors (Lowe, 2004),
which we extract from a dense grid at five different
scales, after normalization of each image to a pre-
defined size. All descriptors are matched against a
precomputed codebook resulting in a histogram, con-
taining the number of matches for every codebook en-
try. This forms the BoW part of the feature vector.
The structural part of the feature vector consists of the
concatenation of the descriptors extracted at the mid-
dle scale. Both parts are normalized independently
using L2 normalization, and are concatenated after-
wards. The resulting vector is classified by a linear
SVM, using a One-versus-All classification approach.
This approach correctly classifies about 93% of the
individual detections.
The second stage combines the classification re-
sults obtained for the individual detections to retrieve
the sign type of the 3D sign based on weighted voting.
The weights are chosen such that classification re-
sults that are more likely to be correct, are assigned a
higher value. The weights are based on the capturing-
to-sign distance D
d
, as it is expected that signs cap-
tured from very close are subject to motion blur and
non-ideal viewing angles, where detections from far
away lack resolution, as e.g. displayed by Fig. 4. This
results in the following definition for the weights w
d
for detection d:
w
d
= exp
−
(D
d
− µ
D
)
2
2σ
2
D
!
. (1)
In this equation, µ
D
and σ
D
correspond to the param-
eters of the employed Gaussian model, which are em-
pirically specified as µ
D
= 8 m and σ
D
= 5 m. The
weighted voting approach results in the correct clas-
sification of 97.3% of the positioned 3D signs.
4 MUTATION DETECTION
The mutation detection component aims at the re-
identification of the signs present in an outdated road
sign survey (the baseline inventory). This baseline
inventory is created in a semi-automatic fashion to
obtain a highly accurate survey and to attain the re-
quired quality level. The re-identification stage in-
volves comparing the baseline inventory with the re-
sults of a newly performed inventory covering the
same geographical region. This comparison is con-
ducted in two different dimensions: sign type and po-
sition. The comparison may seem trivial, but as the
capturings are taken in real-world conditions and at
large scale, several kinds of distortions occur regu-
larly. For example, the recorded GPS position may
show an offset, which complicates comparison of the
sign positions. Besides this, capturings may be taken
during non-optimal lighting conditions, complicating
the discrimination between different sign types.
The sign type comparison matches two signs in
case the sign type found in the new inventory equals
the sign type present in the baseline inventory. As the
difference between certain sign types is very small,
misclassifications may occur. However, as the base-
line inventory has been manually validated to satisfy
the target quality criteria, we also allow very similar
sign types to match, where we relabel the newly found
sign type to the baseline type. This involves measur-
ing of the similarities between the different sign types,
which is performed based on cross-correlating ideal
templates of the sign types, where we threshold the
resulting correlation coefficients. We should note that
comparing the detections of the signs found in differ-
ent years would also be an option, although different
capturing conditions, viewpoint variations and pos-
sibly different capturing systems would complicate
this. Furthermore, this comparison of annual captur-
ings is limited by important practical aspects, includ-
ing the need for storing high-quality versions of all
images used for creating the baseline inventory.
The position comparison is performed in two dif-
ferent ways. For each sign, this stage starts by select-
ing all signs with a position difference smaller than
1.5 m, where only signs for which the sign type com-
parison did match are admitted. The position of two
signs matches directly in case their position deviates
less than 0.33 m. Since there may be a drift in GPS
position, we apply a context-based drift correction
step for the remaining signs. This involves process-
ing of all signs within 150 m w.r.t. the current sign,
where for each sign, the deviations between each sign
and all signs located within 1.5 m and having a match-
ing sign type, are calculated. These deviations are
clustered, and in case there exists a significant large
cluster (containing at least 10 signs, and not smaller
than 80% of the number of signs within the 150 m re-
gion), we employ the corresponding position offset to
correct the drift, after which the 0.33-m condition is
re-imposed.
All signs present in the baseline inventory that
are re-identified in the recent survey are returned as
unchanged signs. All other baseline signs form the
VISAPP2014-InternationalConferenceonComputerVisionTheoryandApplications
710

group of removed signs, while all signs found in the
new inventory that did not match with a baseline sign,
are labeled as newly placed signs. It should be noted
that in case of a large position deviation, a physically
unchanged sign is found as both removed and newly
placed.
5 EXPERIMENTS AND RESULTS
5.1 Experimental Setup
We have applied the described mutation detection ap-
proach to a large geographical region, covering over
1, 500 km of road (about 303, 000 images) and con-
taining villages, rural roads and a highway environ-
ment. We have performed a baseline inventory for this
region, based on the images captured in the spring of
2011, which is manually validated to ensure a high-
quality inventory. This validation involved the addi-
tion of missed signs, the removal of falsely detected
signs and the correction of misclassified sign types.
Based on the resulting inventory, we applied the de-
scribed mutation detection approach using the images
captured in the fall of 2012. All identified changed
situations are evaluated manually. Additionally, about
5% of the images is randomly sampled to check for
newly placed signs that were missed by our system.
The following sections will describe the numerical re-
sults together with the savings in manual effort. Ad-
ditionally, we will discuss the required manual vali-
dations to attain a high quality.
5.2 Results
Table 1 displays the amount of unchanged, removed
and newly placed signs encountered during this case
study. As follows, the number of newly placed and
removed signs equals 8.6% and 8.3% of the total
amount of signs present in the baseline inventory (the
2011 inventory), respectively, such that the total num-
ber of mutations equals 16.9% of the amount of base-
line signs. These changes are e.g. due to the con-
struction of new roads or the conversion of road sit-
uations (e.g. from intersection to roundabout). Our
approach re-identified 94.8% of the unchanged signs,
thereby resulting in a number of detected mutations
equal to approx. 29% of the amount of signs present
in the baseline survey. From these changes, 41.7% is
flagged erroneously. These misdetections are mainly
caused by large GPS deviations, which occur not sel-
domly, especially in woodlands. Besides this, a small
number of errors are caused by an incorrectly listed
sign type in the baseline inventory, which prevents
signs from matching. We should note that in these
cases both the baseline sign and the newly found sign
are labeled as a change, which increases the number
of found changes significantly.
Random sampling of 5% of the images results in
the retrieval of a very small number of missed signs,
which is probably comparable to the performance of
manually performed inventories. We should note that
during this check, all missed signs visible from the
evaluated images are included, such that the amount
of missed signs in the complete region is expected to
be much lower than 20 times the reported amount.
Considering the amount of required manual effort
to validate all found changes, our approach involves
the evaluation of about 30% of the amount of signs
present in the baseline inventory, for which specific
checks should be performed. Compared to creating
inventories from scratch, for which all images should
be searched for missed signs, this results in an effi-
ciency gain of over a factor of 5.
5.3 Discussion on Required Manual
Interventions for Quality Control
The above-described approach for updating invento-
ries of traffic signs promises to be an efficient way for
preserving the quality of road sign surveys, thereby
contributing to efficient sign maintenance. As the pro-
posed method should achieve the target quality crite-
ria (about 97.5% correctness), the system is operated
in a semi-automated fashion, where specific manual
interactions are applied to a minority of the situations.
In this section, we analyze the errors resulting from
our approach and discuss how to resolve them using
specific manual intervention. We have divided the er-
rors resulting from our mutation signaling approach
into four categories:
1. A sign present in the baseline inventory could be
missed in the new inventory.
2. A sign-like object could be identified as a newly
placed sign.
3. A removed sign could erroneously be re-identified
when a similar object is found at about the same
location.
4. A newly placed sign could be missed by our sign
recognition system.
These error categories can be resolved by specific
manual intervention. Correction of Cases 1 and 2
involve the manual evaluation of all found changes,
which can be performed efficiently as the amount of
identified mutations is limited and this evaluation con-
sists of a single check per item. Resolving error Cat-
egory 3 requires evaluation of all unchanged signs.
MutationDetectionSystemforActualizingTrafficSignInventories
711

Table 1: Summary of the amounts of signs found in both 2011 and 2012, together with the amount of signs flagged by our
mutation detection approach. In cases where e.g. the GPS locations deviates significantly, a physically unchanged sign will
be marked as both newly placed (the 2012 sign) and removed (the 2011 sign).
# Ground truth signs Identified sign mutations
# 2011 # 2012 % w.r.t. # 2011 # per mutation category % correct
Total signs 16, 504 16, 548
Unchanged signs 15, 127 91.7% 14, 345 94.8%
Newly placed signs 1, 421 8.6% 2, 541 55.6%
Removed signs 1, 377 8.3% 2, 254 61.1%
Missed newly placed signs 7
In practice, this error source can be neglected, as this
error is caused by the recognition of a sign-like ob-
ject of the same type at about the same position as
the removed sign, which is a very unlikely situation.
Manual correction of errors of Category 4, which is
caused by the detection accuracy of our sign recogni-
tion system, involves browsing through all images to
search for missed signs, which is a time-consuming
procedure, as complete images should be evaluated.
Neglecting this error source may affect the quality of
the updated inventory, because our sign recognition
system currently positions about 93% of the signs. As
browsing through all images is rather inefficient, we
have searched for other ways to retrieve the majority
of the missed signs. Since our recognition system de-
tects about 98.1% of the signs in at least a single im-
age, an alternative would be to evaluate all detections
that are not contained in a positioned 3D sign, such
that the amount of newly placed signs that is missed
is bounded to about 2%. Since this action operates on
detections, this process can be performed efficiently.
Related to this, we have observed that newly missed
signs have a lower probability of being worn due to
aging or being covered by vegetation. However, the
small number of missed signs complicates statistical
quantification of this.
Summarizing, all errors generated by our auto-
mated mutation detection system can be resolved ef-
ficiently by employing limited specific manual inter-
vention, leading to a continuation of the high inven-
tory quality over sequential surveys.
6 CONCLUSIONS
This paper has presented a (semi-)automated ap-
proach for detection of mutations in existing inven-
tories of traffic signs. The system consists of two
stages. The first stage involves the automatic cre-
ation of a new road sign inventory from street-level
images. This process starts by processing all individ-
ual images for sign detection, followed by a multi-
view position estimation process to retrieve the posi-
tions of the detected road signs. Afterwards, all po-
sitioned signs are classified, based on the detections
employed during positioning. The second stage ana-
lyzes the differences between the resulting inventory
and the baseline survey, aiming at the re-identification
of all unchanged signs. This results in the retrieval of
all changed situations, which enables specific manual
validations to attain the target quality.
This system is employed to perform a mutation
scan in a large geographical region over a 1.5-year
time period. The total amount of found changes
equals 16.9% of the amount of baseline signs, which
clearly shows the relevance of actualization. Our sys-
tem marked 94.8% of the unchanged signs accord-
ingly, and retrieved a number of changes equal to 29%
of the amount of baseline signs. We have analyzed the
error categories of our system, and we have discussed
the required manual intervention for resolving them.
These actions operate on a limited set of signs or de-
tections, and thereby allow for preserving the inven-
tory quality level. This approach reduces the required
manual effort with a factor 5, compared to recreat-
ing the inventory from scratch. In addition, this ap-
proach contributes to the feasibility of frequent updat-
ing, which is currently a time-consuming procedure.
REFERENCES
Bonaci, I., Kusalic, I., Kovacek, I., Kalafatic, Z., and
Segvic, S. (2011). Addressing false alarms and local-
ization inaccuracy in traffic sign detection and recog-
nition. In 16th computer vision winter workshop,
pages 1–8.
Comanicu, D. and Meer, P. (2002). Mean shift: A robust
approach toward feature space analysis. IEEE Trans-
actions on Pattern Analysis and Machine Intelligence,
24:603–619.
Creusen, I., Hazelhoff, L., and de With, P. (2012). Color
transformation for improved traffic sign detection. In
Image Processing (ICIP), 2012 19th IEEE Interna-
tional Conference on, pages 461–464.
Creusen, I. M., Wijnhoven, R. G. J., Herbschleb, E., and
de With, P. H. N. (2010). Color exploitation in hog-
based traffic sign detection. In Proc. IEEE Interna-
VISAPP2014-InternationalConferenceonComputerVisionTheoryandApplications
712

tional Conference on Image Processing (ICIP), pages
2669–2672.
Csurka, G., Dance, C. R., Fan, L., Willamowski, J., and
Bray, C. (2004). Visual categorization with bags of
keypoints. In Proc. European Conference on Com-
puter Vision (ECCV).
Dalal, N. and Triggs, B. (2005). Histogram of oriented gra-
dients for human detection. In Proc. IEEE Computer
Vision and Pattern Recognition (CVPR), volume 1,
pages 886–893.
Hazelhoff, L., Creusen, I., and de With, P. (2012a). Robust
classification of traffic signs using multi-view cues.
In Image Processing (ICIP), 2012 19th IEEE Inter-
national Conference on, pages 457–460.
Hazelhoff, L., Creusen, I. M., and De With, P. H. N.
(2012b). Robust detection, classification and position-
ing of traffic signs from street-level panoramic images
for inventory purposes. In Applications of Computer
Vision (WACV), Workshop on, pages 313 –320.
Lafuente-Arroyo, S., Maldonado-Bascon, S., Gil-Jimenez,
P., Acevedo-Rodriguez, J., and Lopez-Sastre, R.
(2007). A tracking system for automated inventory of
road signs. In Intelligent Vehicles Symposium, 2007
IEEE, pages 166 –171.
Lowe, D. G. (2004). Distinctive image features from scale-
invariant keypoints. Int. Journal of Computer Vision
(IJCV), 60(2).
Maldonado-Bascon, S., Lafuente-Arroyo, S., Siegmann,
P., Gomez-Moreno, H., and Acevedo-Rodriguez, F.
(2008). Traffic sign recognition system for inventory
purposes. In Intelligent Vehicles Symposium, 2008
IEEE, pages 590 –595.
Overett, G. and Petersson, L. (2011). Large scale sign detec-
tion using hog feature variants. In Intelligent Vehicles
Symposium (IV), 2011 IEEE, pages 326 –331.
Timofte, R., Zimmermann, K., and Van Gool, L. (2009).
Multi-view traffic sign detection, recognition, and
3d localisation. In Applications of Computer Vision
(WACV), 2009 Workshop on, pages 1 –8.
Timofte, R., Zimmermann, K., and Van Gool, L. (2011).
Multi-view traffic sign detection, recognition, and 3d
localisation. Machine Vision and Applications.
MutationDetectionSystemforActualizingTrafficSignInventories
713
