
Perceived Quality of Service and Content-based Bandwidth
Management in e/m-Learning Smart Environments for the Cultural
Heritage
Cristina De Castro
IEIIT-CNR, National Research Council of Italy, V.le del Risorgimento 2, Bologna, Italy
Keywords: Perceived Quality of Service, Smart Applications, Cultural Heritage, e/m-Learning, Quality of Service
Management.
Abstract: Smart Applications for the Cultural Heritage are playing an increasingly fundamental role in several fields,
ranging from tourism to home entertainment. E/m-Learning systems are also involved, since advanced
contents from the Cultural Heritage can be used in History of Art lessons. For instance, teachers can decide
to make students enjoy HQ images or videos of masterpieces, accessed from the Internet. In this context,
several problems must be considered, among which an appropriate fruition of such data. In this paper, two
specific issues are taken into account: firstly, the so called Perceived Quality of Service (PQoS) in case of
visual information; secondly, the case is discussed of high-bandwidth demanding contents accessed in real-
time, such as HQ streaming videos. An early architecture is finally proposed for the dynamic management
of bandwidth release on the basis of content size and duration.
1 INTRODUCTION
The increasing availability of rich multimedia
contents from the Internet is playing an important
role in several services. Consider for instance smart
applications for the Cultural Heritage, currently used
in many fields, such as tourism and home
entertainment. Such applications are full of
interesting contents, that can be used in e/m-
Learning activities, for instance in the field of
History of Art. This case is here discussed, and the
following scenario considered: a teacher and his or
her students use an e/m-Learning system, where
contents from the Cultural Heritage are adopted,
such as HQ images or videos available on the
Internet. Teachers choose which visual information
must be accessed; students follow lessons from
home or outside, using: (1) heterogeneous devices,
such as desktops, laptops, tablets and smartphones,
and (2) different network access connections, such
as a WiFi from a 100 Mbps wired, a 20 Mbps DSL
or GPRS (2 Mbps, used in several smartphones or
tablets if no WiFi is at disposal).
The learning goal is to enjoy rich and detailed
contents properly, for instance in History of Art
lessons. In this case, HQ images or videos need to be
accurately displayed. The problem is particularly
important of visual quality, which depends on
several factors, such as screen resolution and
network access speed, especially if high-bandwidth
demanding contents are accessed in real-time.
Contents are meant to be shown to a class, but each
student accesses the system using his or her device
and network access technology, which can both vary
over time depending on where and how students log
on to the system. In consequence, the possibility to
access the requested visual information properly or
not must be checked for each individual, according
to distinct situations and learning tasks.
This paper focuses on two specific and related
aspects concerning quality of advanced visual
contents from the Cultural Heritage and their use in
smart education environments (images and videos).
First, the concept is investigated of “Perceived
Quality of Service” (PQoS) in visual environments,
and a representation is proposed of the steps
between reality representation and perception. The
considerations made refer to every kind of visual
information, but are particularly important in case of
contents from the Cultural Heritage. The second
aspect faced refers to lessons involving high
bandwidth-demanding contents, such as HD
streaming virtual visits to museums, where the
bottleneck is data dimension with respect to network
225
De Castro C..
Perceived Quality of Service and Content-based Bandwidth Management in e/m-Learning Smart Environments for the Cultural Heritage.
DOI: 10.5220/0004794102250232
In Proceedings of the 6th International Conference on Computer Supported Education (CSEDU-2014), pages 225-232
ISBN: 978-989-758-020-8
Copyright
c
2014 SCITEPRESS (Science and Technology Publications, Lda.)
access speed. An early architecture is consequently
proposed for the dynamic management of bandwidth
release on the basis of content size and duration.
As an introduction, some considerations are
made about PQoS, quality of transmission and
display, and a representation proposed of the main
steps among the object represented and its final
perception. As for PQoS, the term “Quality of
Service” (QoS) (Bai, B., 2010, Ganesh Babu, T.V.J.,
2001, Montazeri, S., 2008) is rapidly evolving into
the concept of PQoS. In Smart Environments, PQoS
(Suffer, D., 2009, Vankeirsbilck, B., 2013,
Zhengyong, F., 2013) depends strongly on the user,
senses involved, kind of application, architectures,
advanced interfaces and technologies applied,
concerning both devices and kind of network access.
This is the link between the first and second aspect
discussed: quality of perception in visual smart
environments strongly depends on technical factors.
Quality of image and video transmission, in
particular, are related to both bandwidth required
and access technologies, and the following
considerations can be made. First, Smart
Environments are increasingly being enjoyed
through mobile devices and wireless networks;
second, contents from the Cultural Heritage are
growing richer and increasingly bandwidth-
demanding. The network and its performance, thus,
are fundamental. The same applies to device quality,
such as screen size and resolution.
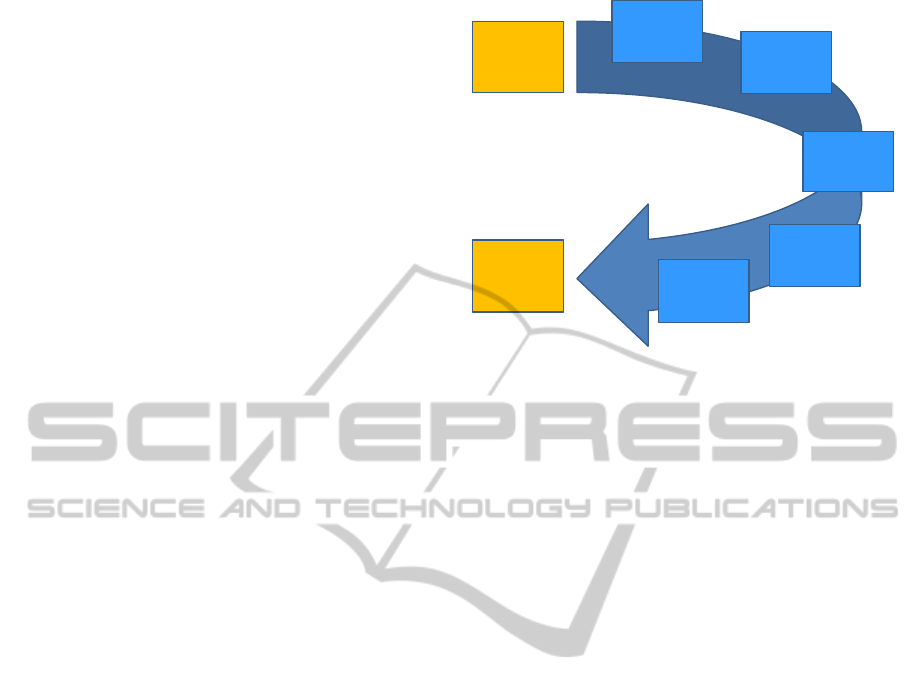
Fig. 1 represents the layers among every kind of
visual object and its final perception. In more detail,
the factors defining quality of service and its
perception in smart visual applications, can be
classified as: (i) actual contents and their
representation; (ii) smart application architecture;
(iii) smart application interface; (iv) network
architecture; (v) user’s network access
technology; (vi) user’s device; (vii) user’s
personal perception. The schema in Fig. 1 does not
mean to be exhaustive: as a matter of fact, each layer
depicts in a symbolic manner a set of contents,
methodologies and technologies, each strongly
dependent on the kind of application. For instance,
in advanced services for the Cultural Heritage, the
layer between the object and the smart application
architecture comprehends (at least) advanced digital
video instrumentation and exposure techniques, data
compression algorithms, data storing methods, etc.
In this simplified and general representation, an
object (meant as a content of any kind and
complexity), is acquired through specialized media.
user’s
perception
object (actual
contents)
smart
application
architecture
smart
application
interface
network
infrastructure
user’s
network
access
technology
user’s device
Figure 1: Main layers between contents and the user’s
perception.
Data are transmitted through a network
infrastructure (e.g. a 100 Mbps fixed network),
accessed by the user on the basis of his or her access
technology (e.g. a WiFi on a 20 Mbps DSL) and
through his or her device (e.g. a notebook or a
tablet).
All the above factors contribute to the final
perception. In particular, an appropriate transmission
and reception of images and videos (such as HD
streaming) strongly contribute to the user’s overall
perception. QoS management, thus, here meant as an
appropriate bandwidth distribution, becomes a focal
issue in PQoS and must be properly handled with.
This is particularly important when groupwork
activities are scheduled, such as lessons involving
the simultaneous vision of high bandwidth-
demanding contents. As a matter of fact, the lesson
is address to a group, but, since each student is free
to access information using his or her device and
network access technology, supervision concerns
individuals.
The paper is organized as follows: Section 2
extends the representation in Fig. 1 and proposes a
simple definition of the factors of PQoS. Section 3
discusses an early architecture for enhancing
dynamic QoS management in case of high
bandwidth-demanding visual contents. In particular,
the dynamic service allocation policies in (Toppan,
A., 2012, Won-Kyu Hong, D., 2003) are revised and
adapted to e/m-Learning requirements. Section 4 is
devoted to concluding remarks, open issues and
future work.
CSEDU2014-6thInternationalConferenceonComputerSupportedEducation
226

2 FROM REALITY TO VISUAL
PERCEPTION
Before detailing the layers between an image or
video and its perception, let us consider a simple
example, referred to the steps in Fig. 1; the example
considers a virtual visit to a museum and makes a
distinction between tourists and students. While the
former can be generally considered experienced and
properly equipped, the latter cannot always be
provided with either fast network technologies or
devices and have little experience in the field of fine
arts.
Consider a museum (object); roughly speaking,
the smart application represents and manages access
to the masterpieces, so as to allow the user to visit
them virtually. A visit can be enjoyed through the
application interface, generally interactive. The
perceived quality of service depends on several
technical factors, such as how the museum was
filmed, represented and stored, how fast information
is transmitted and received, how fast interactions
take place, etc. The application can include
streaming videos, transmitted through a network
infrastructure (for instance, a 100Mbps wired dorsal)
and reaching the user through his or her network
access technology (for instance, a WiFi on a 20Mbps
DSL from home) on his or her mobile device. The
device is defined by several properties, such as
screen dimension and resolution.
In summary, the issues that must be taken into
account are of two kinds: (i) personal factors: taste,
age, previous knowledge, culture or experience
about some masterpieces, expectations, attitude
towards the fine arts or specific art movements or
artists; (ii) equipment: network connection, devices.
All such factors are also time-variant. As for
personal factors, in fact, consider a masterpiece that
hit you very deeply in the past, particularly well
exposed. Suppose to see it again after many years in
a poor context or showed through low-quality
media: the effect is almost bound to be
disappointing. On the contrary, in case you couldn’t
appreciate a seriously damaged painting, you will
probably enjoy a digital restoration. In this case, the
young are less probably experienced and influenced
by memories than adults are.
As for equipment, the enjoyable and profitable
fruition of high bandwidth-demanding contents,
especially involving HD images or videos (such as
HD 3D), makes the difference between properly
equipped amateurs and most schools realities. On
the one hand, in fact, both network technologies,
such as Gigabit Ethernet (GbE) for wired
connections and Long Term Evolution (LTE) for
mobile communications, as well as powerful tablets
are already on trade. On the other hand, such
facilities are neither available worldwide nor at all
the students’ disposal.
Accompanied by an appropriate network load
management and dynamic bandwidth distribution
through QoS techniques, these fast connections and
high-quality screens would surely allow a good
enjoyment contents.
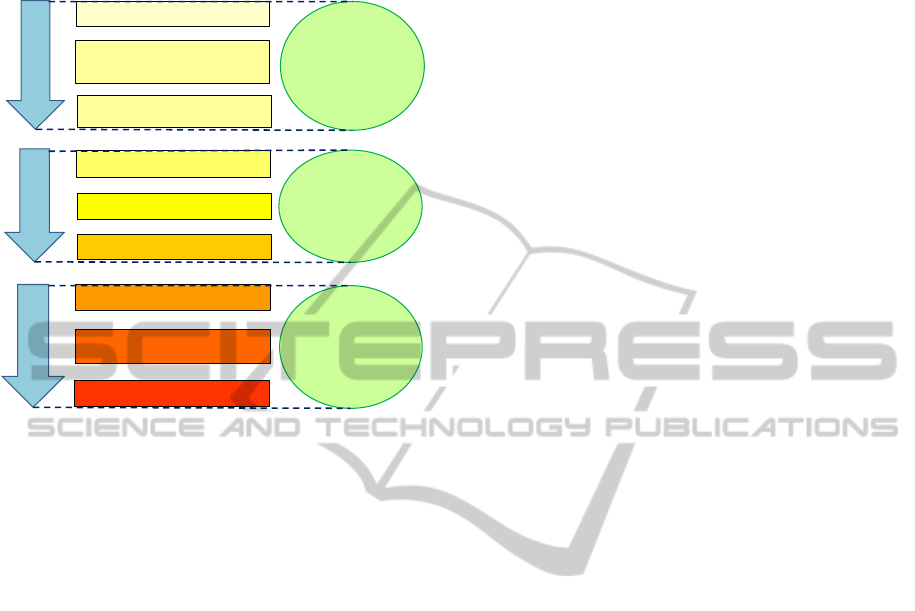
Also on the basis of the above considerations,
Fig. 2 extends the representation in Fig. 1 to the case
of visual perception. This depiction underlines once
more that PQoS depends on both technical and
personal factors and tries to detail some aspects of
the process that leads from a real object to a user’s
visual perception. Fig. 2 can be ideally divided in
three vertical areas. The arrows on the left represent
the main phases of the whole process, classified in
“acquisition”, “transmission/delivery” and “personal
elaboration”. In the mid of Fig. 2, each phase is
divided into its main components. On the right of
Fig. 2, the ovals indicate whether the phase is lossy
or enhancing, both from the technical and personal
viewpoint. In more detail (Fig. 2, upper part from
left to right), the acquisition process involves digital
acquisition and storage of the represented object.
In such phases, the real object is filmed or
photographed through videocameras or other
devices, on the basis of the application needs and the
photographer’s personal interpretation. Such data are
then stored, according to the application
architecture. In particular, techniques such as photo
restoration and digital compression are applied. In
this sense, thus, the acquisition process can be lossy
or enhancing from the technical viewpoint and is
also personal, due to the photographer’s or
environmental mediation. As far as the
transmission/delivery process is concerned (mid
portion from left to right in Fig. 2), it involves the
wired network infrastructure and the user’s network
access and device. Since every telecommunication
system aims at the most complete transmission of
the information received, data are transmitted in
such a way to preserve quality. In consequence, the
user will receive information in a period of time
which depends on actual network speed and
bandwidth at disposal. This can mean that, in case of
slow connections or very rich contents, a HD video
can reach the user with several interruptions, so as to
make it not properly enjoyable or useless for a
lesson. Further factors depend on the user’s device,
such as screen size and screen resolution. In this
sense, the transmission/delivery phase can be
PerceivedQualityofServiceandContent-basedBandwidthManagementine/m-LearningSmartEnvironmentsforthe
CulturalHeritage
227
technically lossy, even though it does not imply
personal judgement. Such judgement will begin
during the personal elaboration phase.
real object
digital acquisition
(digital photography,
photographer)
network infrastructure
user’s access connection
user’s device
human eye
human brain
(expectations, memory, …)
perception
acquisition
transmission/
delivery
personal
elaboration
technically
lossy or
enhancing;
photographer’s
personal
interpretation
technically
lossy;
no personal
factor
technically
lossy;
user’s personal
interpretation
storage
Figure 2: From the real object to perception.
As for the personal elaboration phase (bottom
part of Fig. 2), the image or video reaches the human
brain through the eyes and the complex process of
perception takes place. This process is almost
entirely personal, and can be considered a
reconstruction based on genetic factors,
environmental interactions and previous experiences
(Arnheim, R., 1954, Ryan, 2005). This viewpoint is
intentionally simplifying, but it can be useful when
Smart Applications for the Cultural Heritage are
considered. In this context, in fact, layers between
real objects and human perception are particularly
numerous and complicated.
As for PQoS, the whole system refers to the use
of images and video streaming. The problem is
particularly important when contents from the
Cultural Heritage are involved.
PQoS is quite difficult to define and measure
analytically. Still, some components can be
identified. The following definitions try to give a
contribute and simply intend to better characterize
the problem.
PQoS is time-variant (PQoS = PQoS(t)) and, in
the proposed approach, is a function of two
components. The first is a technical component, here
addressed to as TQoS = TQoS(t), which represents a
time-dependent “Technical Quality of Service”.
TQoS varies over time for several reasons: think, for
instance, that the quality of transmission depends on
the bandwidth available, which is time-variant.
The second component is PQoS itself, a sort of
personal factor, user’s dependent and time-
dependent, referred to the past, memorized in the
brain, based on previous experiences, taste,
expectations, etc. This component is here denoted by
PQoS(t
mem
), where t
mem
roughly indicates a single
instant, but comprehends all the times of memories,
experiences, etc.
Let t
now
be the current instant, when the image or
video is being looked at. PQoS(t
now
) can thus be
represented as a recursive function f of TQoS(t
now
)
and PQoS(t
mem
).
Expression E
1
: PQoS(t
now
) = f(TQoS(t
now
),
PQoS(t
mem
))
According to the representation in Fig. 2,
TQoS(t
now
) can be better detailed.
Let [t
start-acq
, t
end-acq
] be the time interval during
which the image was acquired and stored; [t
start-tra
-
t
now
] denotes the interval during which the image or
video was transmitted to the user’s device.
“Quality of Acquisition” can be denoted by
QoA([t
start-acq
, t
end-acq
]); in the same way, the overall
“Quality of Transmission” can be indicated as
QoT([t
start-tra
- t
now
]); The “Quality of the Device”
used to look at the object is QoD(t
now
).
In summary, TQoS(t
now
), quality of service
perceived at time t
now
, can be denoted as a function g
of its technical components:
Expression E
2
: TQoS(t
now
) = g(QoA([t
start-acq
, t
end-acq
]),
QoT([t
start-tra
- t
now
]), QoD(t
now
))
The above expressions lead to:
Expression E
3
: PQoS(t
now
) = f(g(QoA([t
start-acq
, t
end-
acq
]), QoT([t
start-tra
- t
now
]), QoD(t
now
)), PQoS(t
mem
))
Whereas PQoS(t
mem
) is strictly personal, the
technical quality of service can be handled with
more precisely. In visual mobile applications, for
instance, one of the most important quality factors to
be guaranteed is the sense of continuity of a video.
While very fast technologies, such as Gbps
transmissions, provide users with this feature, the
problem must be handled with in slower ones.
In the considered case, most school environments
have or will have to cope with this problem for a
long time.
The following Section takes two types of data
(HD videos and non HD) into account, discusses the
feasibility of an appropriate video enjoyment
through different network access technologies and
proposes a method for the dynamic management of
bandwidth release on the basis of content size and
duration.
CSEDU2014-6thInternationalConferenceonComputerSupportedEducation
228

3 PROPOSED ARCHITECTURE
The increasing availability of rich contents from the
Internet will force to consider technical network
aspects in e/m-Learning applications. Such
activities, in fact, can involve high bandwidth
demanding contents, such as HQ images or
streaming videos from the Cultural Heritage and
used in History of Art lessons.
The paper refers to different visual contents. In
the observations, visual quality, such as number of
interruptions, is considered. To this purpose, a long
video was needed, in order to make more
observations.
When a teacher prepares a lesson, he or she must
be aware of possible problems in some students’
connections and devices. For instance, the teacher
can use a fast Internet connection, find a beautiful
HD image or HD streaming video and decide to ask
the pupils to see it. Some students, on their hand, can
use slower connections when they follow the lesson
from home, access the image or video and see them
badly or with several interruptions. The risk,
especially where visual quality is fundamental, is
that such pupils are not able to follow the lesson
properly.
In order to handle with this situation, a possible
approach can be the following. On the one hand, the
teacher must be prepared (and indicated) which
contents he or she can use and which cannot, also on
the basis of the students’ technologies. On the other
hand, an appropriate schedule of activities, made
also on the basis of resources, can prevent the
inappropriate fruition of lessons.
In Section 2, a distinction was made between
TQoS and PQoS. The term TQoS includes several
technical factors, among which the so called Quality
of Service (QoS), as meant in Telecommunications.
QoS refers to techniques and protocols for assigning
bandwidth properly to single users or groups and
guarantee the desired performance to data flows and
services. In context of schooling applications, data
flows must be handled with on the basis of the
different activities scheduled over time. In
particular, quality levels must meet the needs of
teachers and allow all the students to enjoy
profitable lessons from distinct locations and using
heterogeneous access technologies.
Also due to the very severe lack of funding in
several countries, advanced contents are not at
everyone’s disposal, so that ad hoc QoS techniques
and scheduling methodologies must be adopted.
In the following, some QoS methodologies are
briefly recalled. Then, some considerations are made
about streaming videos. In particular, the feasibility
of their use in History of Art lessons in e/m-
Learning environments is addressed. An architecture
is then proposed for dynamic and profile-based QoS
management, based on duration and data rate
predicted for a lesson.
In the following, the concept of QoS management is
briefly summarized, in order to better explain the
proposed variant.
The ever-growing request of bandwidth in
mobile advanced applications, as well as the Digital
Divide discrimination, are leading to the
development of more and more efficient
methodologies for bandwidth optimization. Several
techniques have been developed, such as Traffic
Shaping (Gringeri, S., 1998), Policy-Based Traffic
Management (Conchon, E., 2010, Fangming Z.,
2008, Heithecker, S., 2007) and Quality of Service
(QoS) (Chang Wook, A., 2004, Huang, J.H., 2006).
In the considered e/m-Learning scenario, QoS
priority-based dynamic profiles in wireless
multimedia networks are considered. These
techniques (Naser, H., 2005, Song, S., 2006) allow
to assign different priorities to distinct applications,
so as to rearrange service quality in a dynamic way
(Kamosny, D., 2006) and guarantee the desired
performance to data flows. Among such methods,
the platform proposed and tested in (De Castro, C.,
2011, Toppan, A., 2012) can manage simultaneously
two levels of priority: (i) among different users and
(ii) within a single user’s connection. In (i), those
users whose profiles guarantee higher bandwidth,
are proportionally assigned a greater part of the
shared bandwidth. Case (ii) refers to each user,
whose distinct services are assigned distinct
priorities on the basis of necessity. Each profile, in
fact, allows the real-time management of services,
and a sort of priority parameter is used to queue the
desired applications properly. The testbed involved
80 users approximately. This method is at the basis
of the proposed variant, designed to meet the needs
of e/m-Learning environments. The idea is the
following: students and the teacher, as a group, have
specific users’ profiles. In case a scheduled lesson
requires peak bandwidth for a HD streaming video
enjoyment in a given time interval, the system
analyzes the students’ network access technologies
and decides whether the schedule can be
accomplished or must be modified.
In the proposed approach, in particular, an e/m-
Learning System and a Traffic Control Center
interact. A first feasibility evaluation is made by the
e/m-Learning System; a second phase is
accomplished by the Traffic Control Center on the
PerceivedQualityofServiceandContent-basedBandwidthManagementine/m-LearningSmartEnvironmentsforthe
CulturalHeritage
229

basis of information received from the e/m-Learning
System.
Some preliminary measurements about video
streaming quality in case of heterogeneous access
technologies are here reported. When a teacher
schedules a high bandwidth-demanding task, he or
she can tell the system in advance the desired period
of time during which a peak bandwidth requirement
will take place and to whom the necessary
bandwidth must be assigned.
In this way, the minimal bandwidth needed to
accomplish the task can be evaluated and compared
to the students’ access technologies. Such
evaluations can, for instance, rely on the simple
numerical observations in Tab. 1.
Before describing these measurements, it must
be observed that several and often unpredictable
factors contribute to a mobile network connection
speed, such as time, number of users connected,
position, data rate, etc.
The apparently straightforward time access formula
t
access
= D
dim
/Net
speed
, where t
access
represent the total
access time, D
dim
the data to be processed and
Net
speed
the network performance, is in fact only
indicative. Each of its components depends on
several, often time-variant factors. In particular,
Net
speed
varies over time and instantaneously.
Tab. 1 refers to a HD streaming motion picture
and its non HD version. The film lasts about 105
minutes and is about 3GB in the HD version and
2GB in the non HD version. A long motion picture
and no (generally shorter) specific content from the
Cultural Heritage was used in order to make several
observations during a long period. Some examples
from the Cultural Heritage are cited and observed
afterwards.
The effective measurements refer respectively to
the HD and non HD versions accessed through: (i) a
WiFi based on a wired 100Mbps (ii) a WiFi based
on a 20 Mbps DSL and (iii) a 2Mbps GPRS.
Tab. 1 reports the total number of interruptions
observed, but the discussion refers to the average. In
case of 100 Mbps transmission, the data to be
processed fits the network capability (0.9
interruptions per minute in the HD version and 0.6
in the non HD one). The streaming quality declines
with 20 Mbps access technology (2 and 1.5
interruptions per minute respectively). In case of
GPRS access, neither the HD nor the non HD videos
are not even accessible.
A Gbps connection would allow an excellent
streaming quality, as it already happens in North
America with streaming TV, but it is quite rarely the
case of schooling institutions and students all over
the world.
Table 1: Network technology and streaming quality.
Data Access Quality
3GB WiFi on 100Mbps 97 int./ 105 min.
2GB WiFi on 100Mbps 60 int./ 105 min.
3GB WiFi on 20Mbps 210 int./ 105 min.
2GB WiFi on 20Mbps 160 int./ 105 min.
3GB 2Mbps Not accessible
2GB 2Mbps Not accessible
As anticipated, the above examples do not refer
to contents from the Cultural Heritage, due to
measurements needs but also to the risk of violating
copyright. Some examples from the Cultural
Heritage are reported in the following, with no
image, and so are related observations . In particular,
a self-portrait by Van Gogh (www.
vangoghmuseum.nl/vgm/index.jsp?page=1728&coll
ection=1285&lang=en, as of December 26
th
2013)
was first accessed through a low resolution screen
and then through a good resolution smartphone.
Despite the screen dimension, the effect was much
better on the smartphone. Several interesting video
contents from the Cultural Heritage are available at
www.vimeo.com. In particular, the HD video at
http://vimeo.com/47694417 (as of December 26th
2013) about a Silver Athenian Tetradrachma, lasted
1,32’ and was accessed with no interruptions using a
100 Mbps, 1 interruption with a 20 Mbps DSL and 3
stops with a GPRS connection.
Talking about the architecture, dynamic
bandwidth management methods aim at assigning
bandwidth on the basis of different profiles, rights
and actual needs. The proposed method simply tries
to optimize bandwidth assignment on the basis of
the activities planned during a lesson: when a
teacher decides he or she wants to show his or her
students some highly bandwidth-demanding
contents, the early architecture proposed takes into
account all the people involved and tries to manage
the teacher’s request.
A simple example can be the following: a lesson
can involve an initial, introductory 15 minutes talk
of the teacher to the students and, successively, a
HD streaming video about 20 minutes long that the
teacher has decided to show to his or her students.
During the first 15 minutes, no high bandwidth-
demanding activity is involved (voice only), so
bandwidth assignment profiles can be kept low. In
the following 20 minutes, students need much more
bandwidth; in order not to be displayed videos with
several interruptions, their connections must be
appropriate and their bandwidth profiles kept high.
In the proposed approach two kinds of feasibility
CSEDU2014-6thInternationalConferenceonComputerSupportedEducation
230
controls are made, using information about the
students’ access technologies and network traffic
predictions.
Task
Requirements
Analyzer
Task Pre-
Scheduler
Tasks Management Module
e/m-Learning System
Traffic Control Center
Traffic
Analyzer
Traffic
Prediction
Module
QoS Management
Module
Feasibility
Analyzer
QoS
planner
forecasted
feasibility
users, access
technologies,
min_bandwidth,
t_from, t_to
1
2
3
4
5
6
7
8
9
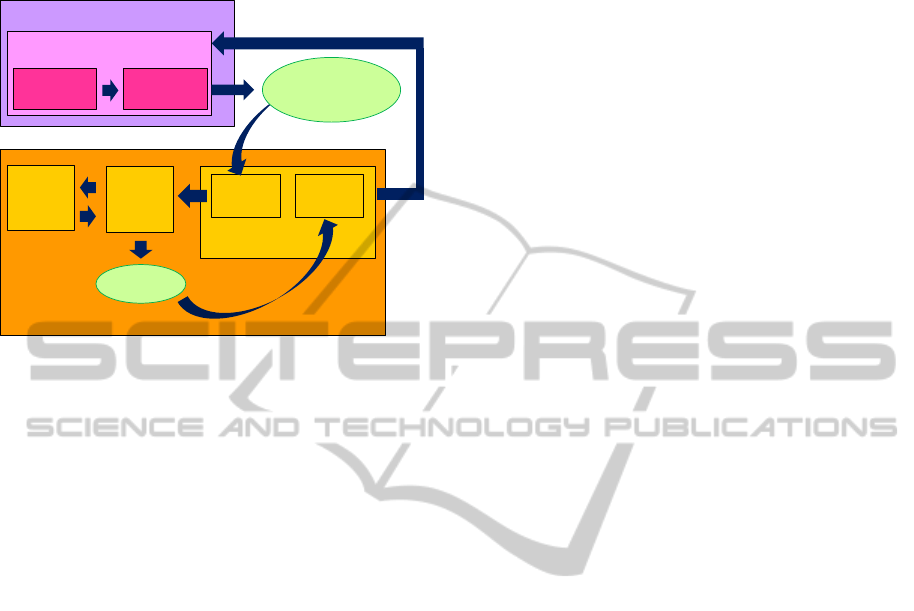
Figure 3: Proposed Architecture.
Fig. 3 illustrates the proposed architecture, in
which the e/m-Learning System and the Traffic
Control Center interact.
The e/m-Learning System contains several
components, among which the Task Management
Module, whose main sub-modules are the Task
Pre-Scheduler and the Task Requirements
Analyzer. The former collects the teachers’
proposed schedules (step 1 in Fig. 3), the latter
analyzes each task involved and, on the basis of the
users’ access technologies, makes a first feasibility
evaluation, on the basis of the measurements
reported above. In consequence, some students can
simply be suggested to use their home DSL rather
than GPRS from outside. This can be the case of a
tablet which uses both technologies: WiFi from
home DSL or the GPRS USIM. In the same way, if
several students are bound to come across
connection problems, the teacher can be asked
whether a non HD version can meet his or her
teaching needs.
This first phase accomplished, the Task
Requirements Analyzer (step 2) returns the
following data: users, their network access
technologies, the minimal bandwidth to be
guaranteed to everyone and the time interval [t_
from
,
t_
to
] of the task.
This information (step 3) is forwarded to the
Traffic Control Center, in particular to the
Feasibility Analyzer of the QoS Management
Module.
The Feasibility Analyzer forwards the
information to the Traffic Prediction Module (step
4). This module interacts with the Traffic Analyzer
(steps 5, 6) and the final decision (“forecasted
feasibility” in step 7) is forwared to the QoS
Planner (step 8) and, finally, to the Task
Management Module (step 9).
In particular, step 9 can be detailed as follows: in
case the task is not forecasted as feasible, the e/m-
Learning System is informed and the teacher can
decide to decide a new schedule or accept lower-
quality videos. In case the task is feasible, the QoS
planner produces a QoS schedule and the e/m -
Learning System is acknowledged.
4 CONCLUSIONS
In this paper, the use of advanced, visual contents in
History of Art lessons was discussed from the
viewpoint of visual quality. In particular, the concept
was faced of visual perception of goods put at
disposal by smart e/m-Learning applications using
the Cultural Heritage, and so were the technical
factors that contribute to the final perception were
investigated. In this context, the problem becomes
particularly relevant of image or video quality,
especially if high-bandwidth demanding contents
accessed in real-time are involved.
Two distinct but related aspects were discussed,
concerning advanced visual contents from the
Cultural Heritage and their use in smart education
environments, referred to images and videos. The
first was “Perceived Quality of Service” (PQoS) in
visual environments. Second, the following problem
was discussed: since learning contents can be
accessed from home or outside using heterogeneous
network access technologies (and, in consequence,
different speeds), in a lesson involving high
bandwidth-demanding contents, such as HD
streaming virtual visits to museums, the bottleneck
is data dimension. A possible solution to prevent
teachers from selecting visual contents that run the
risk of being inappropriately displayed by some
pupils was proposed. The proposal, currently being
under development phase, was an early architecture
for the dynamic management of bandwidth release
on the basis of content size and duration.
Further work will be devoted to a better
definition of Perceived Quality of Service and its
components, the role of memory and expectations
and to a refinement of the proposed architecture.
PerceivedQualityofServiceandContent-basedBandwidthManagementine/m-LearningSmartEnvironmentsforthe
CulturalHeritage
231

ACKNOWLEDGEMENTS
The author wants to thank Prof. Gianni Pasolini
(Telecommunications at DEI and WiLab, University
of Bologna, Italy) for his kind and precious help.
REFERENCES
Arnheim, R., 1954. Art and Visual Perception. A
Psychology of the Creative Eye, University of
California Press, Berkeley and Los Angeles.
Bai, B., Chen, W., Cao, Z. et al., 2010. Uplink Cross-
Layer Scheduling with Differential QoS Requirements
in OFDMA Systems. In EURASIP Journal on
Wireless Communications and Networking.
Chang Wook, A., Ramakrishnan, R.S., 2004. QoS
provisioning dynamic connection-admission control
for multimedia wireless networks using a Hopfield
neural network. In IEEE Transactions on Vehicular
Technology, 53(1), pp. 106-117.
Conchon, E., Pérennou, T., Garcia, J., et al., 2010. W-
NINE: A Two-Stage Emulation Platform for Mobile
and Wireless Systems. In EURASIP Journal on
Wireless Communications and Networking.
De Castro, C., Toppan, A., Toppan, P., 2011, Facing the
Digital-Divide through a Quality of Service
Distributed System in Real-Time Remote Cooperative
Learning. In Proc. of ICERI 2011 (International
Conference of Education, Research and
Innovation), Madrid (Spain).
Fangming, Z., Lingge,J., Chen, H., 2008. Policy-based
radio resource allocation for wireless mobile networks.
In Proc. of IEEE International Conference on Neural
Networks and Signal Processing, pp. 476-481.
Ganesh Babu, T. V. J., Le-Ngoc, T.; Hayes and J.F., 2001.
Performance of a priority-based dynamic capacity
allocation scheme for wireless ATM systems. In IEEE
Journal on Selected Areas in Communications, 19(2),
pp. 355-369.
Gringeri, S., Shuaib, K., Egorov, R. et al., 1998. Traffic
shaping, bandwidth allocation, and quality assessment
for MPEG video distribution over broadband
networks. In IEEE Network, 12(6), pp. 94 – 107.
Heithecker, S., do Carmo, L., Ernst, R., 2007. A High-End
Real time Digital Film Processing Reconfigurable
Platform. In EURASIP Journal on Embedded Systems.
Huang, J.H., Li-Chun, W., Chung-Ju, C., 2006. Capacity
and QoS for a Scalable Ring-Based Wireless Mesh
Network. In IEEE Journal on Selected Areas in
Communications, 24(11), pp. 2070-2080.
Kamosny, D., Novotyny, V., Balik, M., 2006. Bandwidth
Redistribution Algorithm for Single Source Multicast
Networking. In Proc. of Int. Conference on Systems
and Int. Conference on Mobile Communications and
Learning Technologies, pp. 147-156.
Montazeri, S., Fathy, M., & Berangi, R., 2008. An
Adaptive Fair-Distributed Scheduling Algorithm to
Guarantee QoS for Both VBR and CBR Video
Traffics on IEEE 802.11e WLANs. In EURASIP
Journal on Advances in Signal Processing.
Naser, H., Mouftah, H. T., 2005. A class-of-service
oriented packet scheduling (COPS) algorithm for
EPON-based access networks. In Proc. of 7
th
Int.
Conference on Transparent Optical Networks, pp.
232-236.
Ryan, N., Salmon Cinotti, T., Raffa, G., 2005. In
Workshop Proc. of Smart Environments and their
Applications to Cultural Heritage, in 7th Int.
Conference on Ubiquitous Computing (Ubicomp05),
Tokyo (Japan).
Song, S., Manikopoulos, C.N., 2006. A Priority-based
Feedback Flow Control System for Bandwidth
Control. In Proc. of 40th Annual Conference on
Information Sciences and Systems, pp. 1645-1652.
Suffer, D. (2009) Designing for Interaction: Creating
Innovative Applications and Devices, Google eBook.
Toppan, A., Toppan, P., De Castro, C., & Andrisano, O.,
2012. A Testbed about Priority-Based Dynamic
Connection Profiles in QoS Wireless Multimedia
Networks, in Telecommunications Networks - Current
Status and Future Trends, InTech, Europe.
Vankeirsbilck, B., Verbelen, T., Verslype, D., et al, 2013.
Quality of experience driven control of interactive
media stream parameters. In Proc. of 2013 IFIP/IEEE
International Symposium on Integrated Network
Management (IM 2013), pp. 1282 – 1287.
Won-Kyu Hong, D., & Choong Seon Hong, C., 2003. A
QoS management framework for distributed
multimedia systems. In Int. Journal on Network
Management, 13, pp. 115-127.
Zhengyong, F., Guangjun, W., 2013. QoS
guarantees of multiuser video streaming over wireless
links: Delay constraint and packet priority drop. In
IEEE Communications, China, 10, pp. 133-144.
CSEDU2014-6thInternationalConferenceonComputerSupportedEducation
232
