
SuperPhy
A Pilot Resource for Integrated Phylogenetic and Epidemiological Analysis of
Pathogens
Matthew D. Whiteside, Chad R. Laing, Akiff Manji and Victor P. J. Gannon
Laboratory for Foodborne Zoonoses, Public Health Agency of Canada, Lethbridge, AB, Canada
Keywords:
Bioinformatics, Computational Biology, Population Genomics, Epidemiology, Phylogeny, Bacterial Patho-
genesis.
Abstract:
Advances in DNA sequencing technology have created new opportunities in fields such as clinical medicine
and epidemiology, where performing real-time, genome-based surveillance and identification of phenotypic
characteristics of bacterial pathogens is now possible. New analytical tools and infrastructure are needed to
analyze these genomic datasets, store the data, and provide the essential biological information to end-users.
We have implemented an online whole-genome analyses platform called SuperPhy that uses Panseq as an
engine to compare bacterial genomes, the Fisher’s exact test to identify sub-group specific loci, and FastTree
to create maximum-likelihood trees. SuperPhy facilitates the upload of genomes for both private and public
use. Analyses include: 1) genomic comparisons of clinical isolates, and identification of virulence and antimi-
crobial resistance genes in silico, 2) associations between specific genotypes and phenotypic meta-data (e.g.,
geospatial distribution, host, source); 3) identification of group-specific genome markers (presence/ absence
of specific genomic regions, and single-nucleotide polymorphisms) in bacterial populations; 4) the ability to
manipulate the display of phylogenetic trees; 5) identify statistically significant clade-specific markers. The
SuperPhy pilot database currently contains genome sequences for 1063 Escherichia coli strains. Future work
will extend SuperPhy to include multiple pathogens.
1 INTRODUCTION
Centralized massively parallel nucleic acid sequenc-
ing has led to an exponential increase in genome data
generation that threatens to outpace advances in data
storage and analysis (Kahn, 2011; Teeling and Glck-
ner, 2012). In addition, distributed bench-top se-
quencing platforms such as the IonTorrent and MiSeq
promise to provide point of care investigation capa-
bilities with near real-time generation of genome data
(Loman et al., 2012). This capability will allow us
to rapidly disseminate data, especially where deci-
sions may be time-critical; for example, in clinical
medicine and epidemiological investigations. Better
algorithms, more powerful analytical tools and state-
of-the art infrastructure are needed to analyze these
datasets, store the raw and computed data, and pro-
vide the essential biological information to a wide
range of end-users in readily understandable and use-
ful formats.
We have previously created Panseq, an online
and standalone suite of software tools for the auto-
mated comparison of multiple genomes within a pan-
genome context (Laing et al., 2010; Laing et al.,
2011). The generated outputs help elucidate our
understanding of the evolution of specific bacterial
groups, and the genetic basis of important phenotypic
traits that differ among these groups (Laing et al.,
2010).
In this study, we have created a compli-
mentary computational platform, called SuperPhy
(http://lfz.corefacility.ca/superphy), that provides 1)
genomic comparisons of clinical isolates, identifica-
tion of virulence and antimicrobial resistance genes
in silico, 2) associations between specific genotypes
and phenotypic meta-data (e.g., geospatial distribu-
tion, host, source); 3) identification of group-specific
genome markers (presence/ absence of specific ge-
nomic regions, and single-nucleotidepolymorphisms)
in bacterial populations; 4) the ability to manipulate
the display of phylogenetic trees; 5) identify statis-
tically significant clade-specific markers. In addi-
tion, SuperPhy allows private user data repositories
where user-specific genome sequences and associated
datasets can be uploaded and analyzed in conjunction
with all public data. Figure 1 highlights the functions
40
Whiteside M., R. Laing C., Manji A. and P. J. Gannon V..
SuperPhy - A Pilot Resource for Integrated Phylogenetic and Epidemiological Analysis of Pathogens.
DOI: 10.5220/0004798800400048
In Proceedings of the International Conference on Bioinformatics Models, Methods and Algorithms (BIOINFORMATICS-2014), pages 40-48
ISBN: 978-989-758-012-3
Copyright
c
2014 SCITEPRESS (Science and Technology Publications, Lda.)
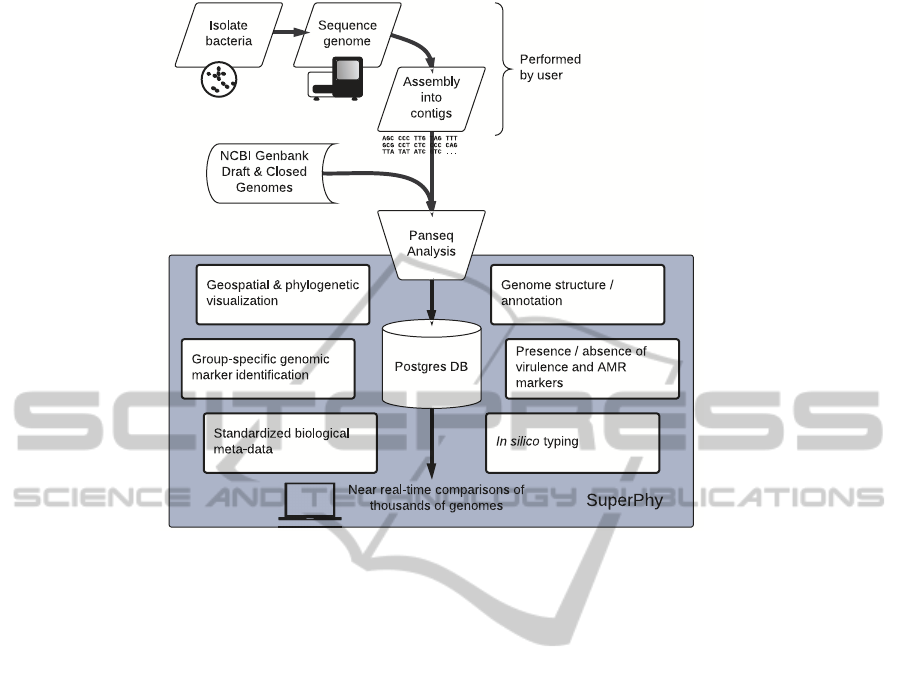
Figure 1: Overview of capabilities in the SuperPhy platform.
of SuperPhy.
The initial release of SuperPhy contains all pub-
licly available data for Escherichia coli, and in-
cludes expert-guided analyses of species-specific
pathogroups and virulence determinants. In the fu-
ture, SuperPhy will be expanded by the community to
provide expert-guided analyses of additional species
of bacterial pathogens for use by clinicians, epidemi-
ologists and evolutionary biologists.
2 DESIGN
SuperPhy is an interactive web platform that inte-
grates public E. coli genome data with analyses tools.
The 1063 closed and draft E. coli genome sequences
were downloaded from GenBank and incorporated
into the SuperPhy database. Users can upload their
own genome sequences for analyses to be kept pri-
vate, or to be integrated into the public dataset. The
platform is designed to be flexible and can work with
closed genomes or genomic contigs from the assem-
bly stage.
2.1 Database
The pilot stage of the SuperPhy platform focuses on
analyzing genomes of E. coli; however, SuperPhy was
designed to be extensible to other species. To make
the database flexible, we chose the Chado relational
schema (Mungall et al., 2007). In Chado, ontolo-
gies are used to assign types to entities, attributes and
relationships (Mungall et al., 2007). This ontology-
centric design makes Chado highly adaptable. By
not defining types in relational layers and instead us-
ing a mutable controlled vocabulary to assign types,
the schema can be easily re-used or changed over
time without having to change the relational structure
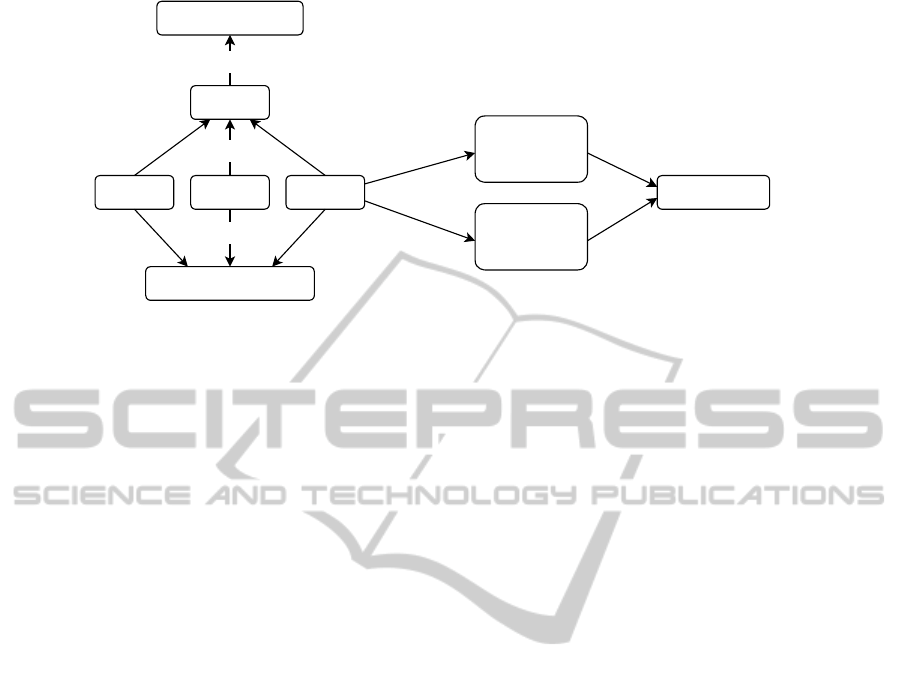
(Mungall et al., 2007). Figure 2 shows the main en-
tity types and corresponding relationship types used
in our SuperPhy instance of the Chado schema (not
shown are the attributes types).
Contig collection
is the parent term assigned to any genome project up-
loaded by a user or obtained from an external database
and is used to store global attributes. A collection
term contains one or more DNA sequences that are
labelled
contig
. The
contig
types can be assem-
bled contigs or fully closed chromosomes or plas-
mids. In SuperPhy, further experimental features are
calculated for each genome: pan-genome loci, antimi-
crobial resistance genes, virulence factor alleles, and
single nucleotide polymorphisms (SNPs) in the core
genome.
A predefined set of required and optional genome
meta-data fields and permissible values have been se-
lected from the minimum information about a genome
sequence (MIGS) specification (Field et al., 2008).
SuperPhy-APilotResourceforIntegratedPhylogeneticandEpidemiologicalAnalysisofPathogens
41

The meta-data types capture key bacterial isolate at-
tributes.
2.2 Analyses
Panseq is used as the computational engine for the
SuperPhy platform (Laing et al., 2010). Genome se-
quences uploaded by users or obtained from NCBI
GenBank Genome and Whole Genome Sequence
repositories (Benson et al., 2013) are input into
Panseq to identify segments that belong to the con-
served core genome and to the more variable acces-
sory genome. Panseq works by iteratively aligning
genomes using the MUMmer 3 program to produce
a non-redundant pan-genome sequence (Laing et al.,
2010; Kurtz et al., 2004). The pan-genome is then
compared back to the input genomes to generate a list-
ing of the presence or absence of each genomic locus
in the pan-genome across the input genomes. Panseq
also catalogues the SNP variations in the conserved
regions (Laing et al., 2010). The loci and SNPs identi-
fied by Panseq are loaded into the SuperPhy database.
Annotations for the pan-genome regions are deter-
mined using a BLASTx analysis against the GenBank
NR protein database.
A second analysis identifies virulence and antimi-
crobial drug resistance determinants in the genomes.
Starting with a predefined set of query virulence fac-
tor (VF) and antimicrobial resistance (AMR) genes,
the Panseq tool searches for alleles of these genes in
the input genomes. Panseq uses BLASTn to conduct
the search. The non-redundant query set of AMR
genes was created by downloading the entire Com-
prehensive Antibiotic Resistance Database (CARD)
(McArthur et al., 2013) and subsequently cluster-
ing the CARD sequences based on similarity using
BLASTclust (Altschul et al., 1997). Representatives
from each cluster were selected first by the phyloge-
netic distance of the species to E. coli and secondly,
by length where longer sequences were selected over
shorter ones. All query AMR genes are organized ac-
cording to their Antibiotic Resistance Ontology an-
notation to aid in identifying the presence of differ-
ent antimicrobial resistance mechanisms (Antezana
et al., 2009). The VF gene set was produced by ob-
taining all gene alleles of known virulence factors
in E. coli from the Virulence Factor Database (Chen
et al., 2012; Chen et al., 2005), supplemented with
known E. coli virulence factors from the literature.
The longest allele was selected for each VF gene, ex-
cept in cases where sequence similarity was less than
90%, in which case, multiple alleles were included in
the VF query set for a particular gene.
Phylogenetic trees in SuperPhy are used in the
results displays and also in the query forms. A
maximum-likelihood phylogenetic tree is constructed
for all E. coli genomes in the database using Fast-
Tree v2.1 (Price et al., 2010). The tree is built from
a multiple sequence alignment of the conserved core
genome regions among all genomes, but is dynam-
ically pruned based on user-selection to show spe-
cific genomes. Trees are also computed for individual
pan-genome regions and for identified AMR and VF
genes.
Shiga-toxin (Stx) subtype assignment of the E.
coli strains is calculated from the phylogenetic dis-
tribution of the query alleles in relation to Stx genes
with confirmed subtype. A phylogenetic tree of all
identified stx1 and stx2 was created, and clades spe-
cific to a Shiga-toxin subtype were identified based on
the scheme presented by (Scheutz et al., 2012). Mem-
bership in these pre-defined clades marks the subtype
of a genome; those strains that fall outside of known
sub-type clades are marked as unknown. Multiple se-
quence alignments of the Stx genes are stored in the
database for user reference.
2.3 Implementation Details
The web application was built with the Perl
CGI::Application framework (http://cgi-app.org/).
The Chado relational database schema was im-
plemented in Postgres 9.2. The Phylogenetic tree
graphical display was constructed with the D
3
JavaScript library (Bostock et al., 2011) and the
map tool with the Google Maps JavaScript API v3
(https://developers.google.com/maps/documentation/
javascript/).
3 FUNCTIONALITY
3.1 Uploading a Genome
Users can upload their E. coli genomes to Super-
Phy for analysis and comparison to the other E.
coli genomes in the database. Access to uploaded
genomes and associated analyses is regulated by the
user. Users can select to keep their genome data pri-
vate indefinitely, immediately make it publicly acces-
sible, or choose to release it after a specified date,
where it will automatically be added to the public
data. Under the private setting, users can also grant
specific users access to their genomes. After up-
load, genomes are submitted to the SuperPhy analysis
pipeline. Return times for the results depend on server
load, but under typical conditions, analysis results are
available within an hour.
BIOINFORMATICS2014-InternationalConferenceonBioinformaticsModels,MethodsandAlgorithms
42
&RQWLJ&ROOHFWLRQ
&RQWLJ
613 /RFXV $OOHOH
([SHULPHQWDO)HDWXUH
$QWLPLFURELDO
5HVLVWDQFH
*HQH
4XHU\*HQH
9LUXOHQFH
)DFWRU
*HQH
SDUWBRI
ORFDWHGBLQ
LVBD
VLPLODUBWR
LVBD
Figure 2: A ontology graph representing the main entity types used in the SuperPhy schema.
3.2 Retrieving Genome Meta-data
Existing E. coli genomes from the NCBI GenBank
and Whole Genome Sequence repositories (Benson
et al., 2013) have been loaded into the SuperPhy
database. Meta-data in these sources were mapped to
the standardized MIGS set of meta-data types and val-
ues (Field et al., 2008). To facilitate navigation, users
can choose to display one or more meta-data types
in the forms (accession, serotype, strain, host species,
isolation source, isolate date can be displayed along-
side genome name). Through the advanced search
facility, genome information can be queried by se-
lecting from a interactive phylogenetic tree, from a
world map, by date range or by boolean search of
user-defined search fields and keywords. The sophis-
ticated query interface is designed to help address a
broad range of hypotheses based on meta-data or phy-
logenetic information (Figure 3).
3.3 Groupwise Comparisons of the
Distribution of SNPs and the
Presence / Absence of Variable
Genomic Loci
The E. coli pan-genome is highly variable, with ap-
proximately 80% of an individual genome comprised
of variable, accessory genes and only 20% from the
core-genome (Lukjancenko et al., 2010). To help cor-
relate phenotype and genotype, SuperPhy provides
the ability to compare between groups the presence
or absence of pan-genome loci, as well as the distribu-
tion of SNPs within shared genome regions. A single
consolidated pan-genome is computed from the indi-
vidual genomes in the SuperPhy database. To identify
group-specific or group-dominant genome regions or
SNPs, the groupwise comparison function of Super-
Phy allows users to select genomes in two comparison
groups and returns the set of nucleotide variations or
genome regions that are statistically enriched in one
group compared to the other. The statistical enrich-
ment is determined by the Fisher’s Exact test as im-
plemented in the R statistical language (R Core Team,
2013).
3.4 Identifying Virulence and
Antimicrobial Drug Resistance
Determinants
SuperPhy provides the ability to identify and evalu-
ate risk factors. Users can examine the distribution
of the presence or absence of virulence and AMR
markers in the genomes. Pre-defined sets of charac-
terized virulence factors and antimicrobial resistance
genes were collected and examined for their pres-
ence among all individual genomes (McArthur et al.,
2013; Chen et al., 2012; Chen et al., 2005). Users
can specify multiple query markers in multiple target
genomes. The sequences of identified VF and AMR
gene alleles in the individual genomes are stored in
the database, as are the multiple sequence alignments
of the alleles. This allows the sequence-based com-
parison among user selected strains to be displayed in
real-time.
3.5 Visualizing Phylogenetic and
Geospatial Data
Phylogenetic tree views are provided for Genomes,
AMR and VF genes and individual pan-genome re-
gions (Figure 4). The tree interface is designed to be
highly interactive; users can pan, zoom and expand,
collapse or select tree nodes. The tree view is coupled
with an interactive world map view of the location
SuperPhy-APilotResourceforIntegratedPhylogeneticandEpidemiologicalAnalysisofPathogens
43
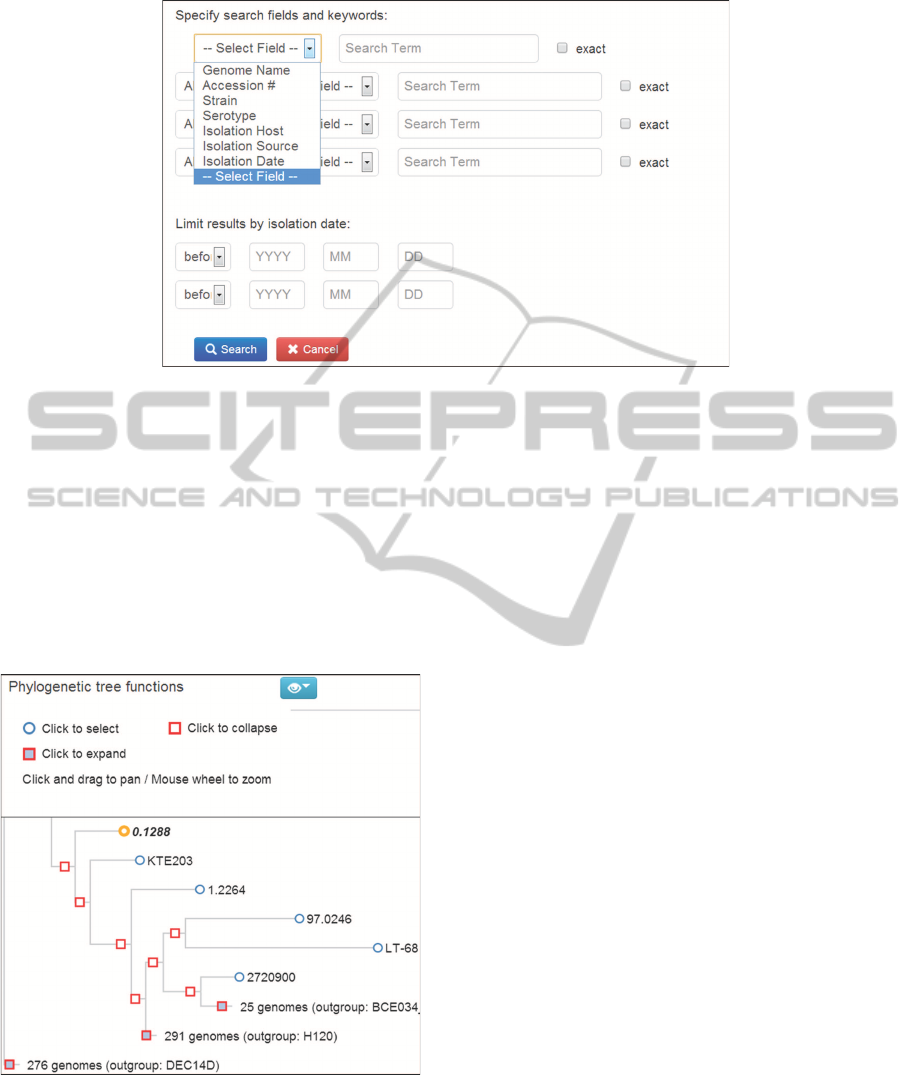
Figure 3: Advanced meta-data search function in SuperPhy. Users can perform a boolean search of specified fields and
keywords.
of strains (Figure 5). Locations can be regions such
as countries, territories or states, or can be points de-
fined by latitude and longitude coordinates. Queried
genomes are simultaneously displayed in the tree and
map views allowing users to explore and compare
the phylogenetic and geospatial positions of strains.
Meta-data such as host, source, associated disease or
isolation date can be overlayed in the phylogenetic
tree.
Figure 4: The interactive phylogenetic tree interface in Su-
perPhy. In addition to displaying phylogenetic data, the in-
terface can be used to select single or groups of genomes for
further investigation. In the form, users can pan, zoom, or
collapse/expand tree nodes to explore sections of the tree.
3.6 Shiga-Toxin Subtyping
Shiga-Toxin (Stx) producing E. coli can be charac-
terized by their Stx1 and Stx2 gene variants (Scheutz
et al., 2012). Stx variants are often associated with
distinct biological phenotypes. Stx subtypes are as-
signed to the Shiga-toxin E. coli in the database based
on the cluster membership of the Stx alleles in pre-
defined phylogenetic clades in the Stx gene tree. Stx
subtype is presented on the Strain Information sum-
mary page, where a phylogenetic tree of the Stx genes
can also be viewed.
4 EXAMPLES OF USE CASES
4.1 Time Critical Genomic Analyses
Example: A clinician has just received a bacterial iso-
late from a patient with gastrointestinal illness and
would like to know the risk to the patient (how severe
and what sort of illness is associated with the strain
based on meta-data from closely related strains in the
database), the risk to the community (have these bac-
teria been isolated from other patients; is this an out-
break?) and possible treatment or prevention options.
In order for the information to be to useful, the bacte-
rial isolate must be characterized as soon as possible.
The genome sequence is determined in the hospital
using a distributed sequencing platform such as the
MiSeq or IonTorrent and subsequently uploaded to
SuperPhy. The resulting information presented con-
tains a summary of the strain for known virulence
and AMR determinants, any novel genome regions
BIOINFORMATICS2014-InternationalConferenceonBioinformaticsModels,MethodsandAlgorithms
44
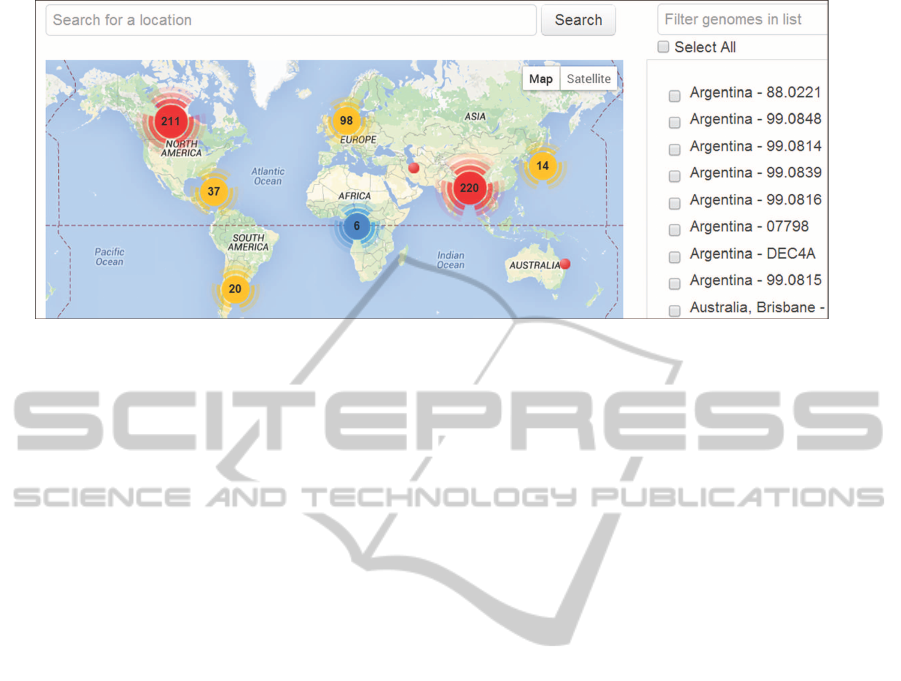
Figure 5: The interactive world map interface in SuperPhy displays the isolation location of strains. The display algorithm
clusters nearby strains and shows the number of strains in a region. Zooming in or clicking on a cluster will resolve individual
strains in the region.
with respect to the genomes already present in the
database, the phylogenetic position of the new iso-
late and closely related strains, and their geographical
distribution. This clinician also has the opportunity
to add the new strain to the shared public database,
where it will instantly be available to the community
of SuperPhy users.
In the current genomics landscape, it is impossible
to perform the above analyses in the time required to
make effective decisions. The same analyses would
require days of wet-lab work, and to perform these
tasks in silico, one would need knowledge of a num-
ber of bioinformatics programs, a local collection of
strains to run the comparison against, a collection of
virulence and antimicrobial factors, and a means of
identifying unique genome elements.
The entire process would be lengthy and the
knowledge gained would not be immediately avail-
able to others. With our novel integration of the
data and computational approaches, the analyses can
be performed relatively quickly, a summary gener-
ated, and both the genome and information about that
genome stored and available for other users, saving
duplication of analyses and increasing the value of the
computational platform. The rate-limiting step for the
platform is now the deposition of genome sequence
data.
4.2 Identification of Genomic Novelty
Informing Phenotype
Examples: 1) An epidemiologist has identified a
pathogen responsible for high levels of severe ill-
ness and wishes to identify genome regions that are
present in the pathogen but absent among closely re-
lated strains not implicated in human disease; 2) An
agricultural researcher wishes to identify genome el-
ements statistically associated with E. coli strains that
are shed from cattle more frequently and in higher
amounts than other E. coli found in the bovine gas-
trointestinal tract; 3) A researcher wishes to identify
novel genes in a group of E. coli that persist in soil
longer than other known groups of E. coli; 4) A food
microbiologist wishes to identify genome regions that
allow persistent E. coli to remain in a food-production
environment, where most other E. coli are not capable
of persisting.
As the SuperPhy computational tools are tightly
coupled with the underlying data, all meta-data
(source, host, severity of illness, etc.) are imme-
diately available for determining phenotypic groups
that can be compared at the genome level. Addition-
ally, the spatial distribution of genome sequences is
displayed in map form, allowing the user to ‘zoom-
in’ and graphically select a region of interest. The
presence / absence of all genome regions and single-
nucleotide polymorphisms among shared genome re-
gions is also pre-computed, enabling the identifica-
tion of genome regions that are statistically different
between groups, be they based on severity of illness,
host, or geographical location.
The results are then made available for download
and the analysis saved in the platform for others to use
with permission of the original user.
4.3 Discovery Research
Example: A genomics researcher has obtained the
assembled contigs from an Illumina sequencing run,
generating a large number of novel genome sequences
in a novel E. coli strain responsible for severe cases
of human disease, as was seen in the 2011 E. coli
SuperPhy-APilotResourceforIntegratedPhylogeneticandEpidemiologicalAnalysisofPathogens
45

O104:H4 outbreak (Mellmann et al., 2011). She
wishes to quickly identify the phylogenetic relation-
ships among this new strain and all previously se-
quenced E. coli genomes, as well as to identify
virulence and AMR genes, and novel genomic re-
gions present in the strains with respect to closely
related genome sequences. The researcher simply
uploads his sequences to SuperPhy, after which the
new strains are placed on the phylogenetic tree of
all strains, and the presence of any known virulence
/ AMR genes is determined. Lastly, the new strains
are compared to the pre-computed genomes database,
where any novel genomic regions are identified for
the researcher.
5 DISCUSSION
To meet the opportunities presented by current
genome sequencing technologies, tools are needed
that can analyze genomic data in a rapid and ac-
cessible way. Efforts have been made to auto-
mate complex bioinformatics workflows, such as Tav-
erna (Lanzn and Oinn, 2008) and Galaxy (Goecks
et al., 2010), and while they are effective at sim-
plifying the process, data are not integrated with
these tools requiring users to transfer genome se-
quences from public or private databases and per-
form their own separate analyses. Likewise, on-
line repositories of genome sequence data such as
the National Center for Biotechnology Information
(http://www.ncbi.nlm.nih.gov/)and the Genomes On-
line Database (http://www.genomesonline.org/) pro-
vide a wealth of data, but are decoupled from an effi-
cient analytical platform.
Only recently have platforms emerged that at-
tempt to provide both large-scale data storage and
analyses. Relevant to microbiology, the tools Mi-
croScope and PATRIC provide broad pre-computed
analyses for public genomes (Vallenet et al., 2012;
Wattam et al., 2013). MicroScope, limited to pub-
licly available closed and annotated genomes, con-
tains informationfor >1100 genomes, while PATRIC,
which has a gene annotation workflow and includes
incomplete genomes, contains >10 000 genome se-
quences. Analyses compare the phylogeny, biologi-
cal pathways and gene functions of bacterial species.
Several of the analyses in MicroScope focus on com-
paring the genome structure. Both tools allow users to
add genome-associated data such as transcriptomics
results to aid in the understanding of gene function
(Vallenet et al., 2012; Wattam et al., 2013).
IMG is a combined genome annotation and anal-
ysis platform (Markowitz et al., 2013). While more
limited in scope in comparison to PATRIC or Mi-
croScope, IMG allows the submission of genomic
data by users. Other platforms are organism specific,
such as Sybil; a platform for the comparative analy-
ses of Streptococcus pneumoniae based on BLASTp
searches (Riley et al., 2012). Outside of these broad
analyses suites, other large-scale genome tools tend
to focus on a specific analysis. For example, sev-
eral tools provide a global phylogenetic tree for pub-
lic bacterial genomes (Letunic and Bork, 2011; Fang
et al., 2013; Federhen, 2012).
The integration of phylogenetic and epidemio-
logical analyses with genomic data uniquely posi-
tions SuperPhy to aid both clinical and basic mi-
crobiological research. Users can upload their in-
complete or closed genomic sequence data and in
near real-time compare their strain to other public
or user-submitted strains in the database. Analyses
provide clear, targeted answers to questions that are
of interest to microbiologists and clinicians. The
group-based comparison allows users to investigate
genotype-phenotype correlations by statistically eval-
uating associated genomic markers or regions in user-
supplied strain groups. While other platforms can
identify SNPs or novel regions, SuperPhy evaluates
the significance of genomic novelty in the context of
the comparison groups. SuperPhy contains lists of
known disease risk factors and highlights the presence
or absence of the factors. Relevant pathogen-specific
data are also incorporated into SuperPhy; Shiga-toxin
producing E. coli variants are characterized using an
in silico typing method. Finally, result are displayed
in integrated, information-rich, but understandable
views. Retrieving the information for a strain, for ex-
ample, will return a geographical map, a phylogenetic
tree and all associated meta-data (e.g source, host, as-
sociated diseases, Stx subtype, Pubmed ID, etc.). In
the tree and map views, meta-data can be overlayed
to examine the distribution of a particular feature. Re-
trieving similar information on other platforms would
require significant manipulation or manual collation
of data across analyses tools. In coupling data with
targeted analyses tools and result views, SuperPhy
can quickly obtain answers to multiple research hy-
potheses, by users with little bioinformatics expertise.
5.1 Collaboration and Community
Benefit
There are currently similar projects under way world-
wide with similar goals: to provide a platform for
comparative genomic epidemiology (Kupferschmidt,
2011). The transfer of strains across international bor-
ders can be time consuming or impossible, whereas
BIOINFORMATICS2014-InternationalConferenceonBioinformaticsModels,MethodsandAlgorithms
46

the exchange of genome sequence information can
happen as soon as it becomes available. These inter-
national efforts with common goals should at the least
provide data in a format that allows for it to be easily
shared and understood among the various platforms.
The value to the community of users of this shared
computational resource increases as the number of
users contributing data to it increases, which in turn
makes the platform more attractive to use and con-
tribute to by others. Users are encouraged to add not
only data, but suggest improvements and additions to
the SuperPhy platform, so that it can be iteratively de-
veloped to meet the needs of the user community.
6 AVAILABILITY
The website is available at http://lfz.corefacility.ca/
superphy/. The software code and database will be
made available upon request.
7 CONCLUSIONS
SuperPhy is a broadly accessible, integrated platform
for the phylogenetic and epidemiological analyses of
bacterial genome data. It providesnear real-time anal-
yses of thousands of genome sequences using novel
computational approaches with results that are under-
standable and useful to a wide community, includ-
ing those in the fields of clinical medicine, epidemi-
ology, ecology, and evolution. The web-interface
to this computational platform obviates the need for
command-line skills, or a particular computer envi-
ronment. As additional members of the research com-
munity use the platform, the number of genome se-
quences stored and analyzed will increase, adding
further value to the platform, and in turn attracting
more users. Genomic platforms such as SuperPhy
will become increasingly important in transforming
raw genome data into a format suitable for the de-
velopment of a world-wide real-time surveillance and
analyses network for bacterial genomes.
REFERENCES
Altschul, S. F., Madden, T. L., Schffer, A. A., Zhang, J.,
Zhang, Z., Miller, W., and Lipman, D. J. (1997).
Gapped BLAST and PSI-BLAST: a new generation
of protein database search programs. Nucleic Acids
Research, 25(17):3389–402.
Antezana, E., Kuiper, M., and Mironov, V. (2009). Biologi-
cal knowledge management: the emerging role of the
semantic web technologies. Briefings in Bioinformat-
ics, 10(4):392–407.
Benson, D. A., Cavanaugh, M., Clark, K., Karsch-Mizrachi,
I., Lipman, D. J., Ostell, J., and Sayers, E. W. (2013).
GenBank. Nucleic Acids Res., 41(Database issue):36–
42.
Bostock, M., Ogievetsky, V., and Heer, J. (2011). D
3
data-driven documents. Visualization and Computer
Graphics, IEEE Transactions on, 17(12):2301–2309.
Chen, L., Xiong, Z., Sun, L., Yang, J., and Jin, Q. (2012).
VFDB 2012 update: toward the genetic diversity and
molecular evolution of bacterial virulence factors. Nu-
cleic Acids Res., 40(Database issue):D641–645.
Chen, L., Yang, J., Yu, J., Yao, Z., Sun, L., Shen, Y., and
Jin, Q. (2005). VFDB: a reference database for bacte-
rial virulence factors. Nucleic AcidsRes., 33(Database
issue):D325–328.
Fang, H., Oates, M. E., Pethica, R. B., Greenwood, J. M.,
Sardar, A. J., Rackham, O. J., Donoghue, P. C., Sta-
matakis, A., de Lima Morais, D. A., and Gough, J.
(2013). A daily-updated tree of (sequenced) life as a
reference for genome research. Sci Rep, 3:2015.
Federhen, S. (2012). The NCBI Taxonomy database. Nu-
cleic Acids Res., 40(Database issue):D136–143.
Field, D., Garrity, G., Gray, T., Morrison, N., Selengut, J.,
Sterk, P., Tatusova, T., Thomson, N., Allen, M. J.,
Angiuoli, S. V., Ashburner, M., Axelrod, N., Bal-
dauf, S., Ballard, S., Boore, J., Cochrane, G., Cole,
J., Dawyndt, P., De Vos, P., DePamphilis, C., Ed-
wards, R., Faruque, N., Feldman, R., Gilbert, J.,
Gilna, P., Glockner, F. O., Goldstein, P., Guralnick,
R., Haft, D., Hancock, D., Hermjakob, H., Hertz-
Fowler, C., Hugenholtz, P., Joint, I., Kagan, L.,
Kane, M., Kennedy, J., Kowalchuk, G., Kottmann, R.,
Kolker, E., Kravitz, S., Kyrpides, N., Leebens-Mack,
J., Lewis, S. E., Li, K., Lister, A. L., Lord, P., Maltsev,
N., Markowitz, V., Martiny, J., Methe, B., Mizrachi, I.,
Moxon, R., Nelson, K., Parkhill, J., Proctor, L., White,
O., Sansone, S. A., Spiers, A., Stevens, R., Swift, P.,
Taylor, C., Tateno, Y., Tett, A., Turner, S., Ussery, D.,
Vaughan, B., Ward, N., Whetzel, T., San Gil, I., Wil-
son, G., and Wipat, A. (2008). The minimum informa-
tion about a genome sequence (MIGS) specification.
Nat. Biotechnol., 26(5):541–547.
Goecks, J., Nekrutenko, A., Taylor, J., and $au-
thor.lastName, a. f. (2010). Galaxy: a comprehen-
sive approach for supporting accessible, reproducible,
and transparent computational research in the life sci-
ences. Genome Biology, 11(8):R86.
Kahn, S. D. (2011). On the future of genomic data. Science
(New York, N.Y.), 331(6018):728–729.
Kupferschmidt, K. (2011). Outbreak detectives embrace the
genome era. Science, 333(6051):1818–1819.
Kurtz, S., Phillippy, A., Delcher, A. L., Smoot, M.,
Shumway, M., Antonescu, C., and Salzberg, S. L.
(2004). Versatile and open software for comparing
large genomes. Genome biology, 5(2):R12.
Laing, C., Buchanan, C., Taboada, E. N., Zhang, Y.,
Kropinski, A., Villegas, A., Thomas, J. E., and Gan-
non, V. P. J. (2010). Pan-genome sequence analysis
using panseq: an online tool for the rapid analysis of
SuperPhy-APilotResourceforIntegratedPhylogeneticandEpidemiologicalAnalysisofPathogens
47

core and accessory genomic regions. BMC Bioinfor-
matics, 11:461.
Laing, C., Villegas, A., Taboada, E. N., Kropinski, A.,
Thomas, J. E., and Gannon, V. P. J. (2011). Identifi-
cation of salmonella enterica species- and subgroup-
specific genomic regions using panseq 2.0. Infec-
tion, Genetics and Evolution: Journal of Molecular
Epidemiology and Evolutionary Genetics in Infectious
Diseases.
Lanzn, A. and Oinn, T. (2008). The taverna interaction
service: enabling manual interaction in workflows.
Bioinformatics (Oxford, England), 24(8):1118–1120.
Letunic, I. and Bork, P. (2011). Interactive Tree Of Life
v2: online annotation and display of phylogenetic
trees made easy. Nucleic Acids Res., 39(Web Server
issue):W475–478.
Loman, N. J., Misra, R. V., Dallman, T. J., Constan-
tinidou, C., Gharbia, S. E., Wain, J., and Pallen, M. J.
(2012). Performance comparison of benchtop high-
throughput sequencing platforms. Nature biotechnol-
ogy, 30(5):434–439.
Lukjancenko, O., Wassenaar, T. M., and Ussery, D. W.
(2010). Comparison of 61 sequenced escherichia coli
genomes. Microbial Ecology, 60(4):708–720.
Markowitz, V. M., Chen, I. M., Palaniappan, K., Chu, K.,
Szeto, E., Pillay, M., Ratner, A., Huang, J., Woyke,
T., Huntemann, M., Anderson, I., Billis, K., Varghese,
N., Mavromatis, K., Pati, A., Ivanova, N. N., and Kyr-
pides, N. C. (2013). IMG 4 version of the integrated
microbial genomes comparative analysis system. Nu-
cleic Acids Res.
McArthur, A.G., Waglechner, N., Nizam, F., Yan, A., Azad,
M. A., Baylay, A. J., Bhullar, K., Canova, M. J.,
De Pascale, G., Ejim, L., Kalan, L., King, A. M.,
Koteva, K., Morar, M., Mulvey, M. R., O’Brien, J. S.,
Pawlowski, A. C., Piddock, L. J., Spanogiannopou-
los, P., Sutherland, A. D., Tang, I., Taylor, P. L.,
Thaker, M., Wang, W., Yan, M., Yu, T., and Wright,
G. D. (2013). The comprehensive antibiotic re-
sistance database. Antimicrob. Agents Chemother.,
57(7):3348–3357.
Mellmann, A., Harmsen, D., Cummings, C. A., Zentz,
E. B., Leopold, S. R., Rico, A., Prior, K.,
Szczepanowski, R., Ji, Y., Zhang, W., McLaughlin,
S. F., Henkhaus, J. K., Leopold, B., Bielaszewska, M.,
Prager, R., Brzoska, P. M., Moore, R. L., Guenther, S.,
Rothberg, J. M., and Karch, H. (2011). Prospective
genomic characterization of the german enterohem-
orrhagic escherichia coli O104:H4 outbreak by rapid
next generation sequencing technology. PLoS ONE,
6(7):e22751.
Mungall, C. J., Emmert, D. B., et al. (2007). A chado case
study: an ontology-based modular schema for rep-
resenting genome-associated biological information.
Bioinformatics, 23(13):i337–i346.
Price, M. N., Dehal, P. S., and Arkin, A. P. (2010). FastTree
2 approximately maximum-likelihood trees for large
alignments. PLoS ONE, 5(3):e9490.
R Core Team (2013). R: A Language and Environment for
Statistical Computing. R Foundation for Statistical
Computing, Vienna, Austria.
Riley, D. R., Angiuoli, S. V., Crabtree, J., Hotopp, J. C. D.,
and Tettelin, H. (2012). Using sybil for interactive
comparative genomics of microbes on the web. Bioin-
formatics, 28(2):160–166.
Scheutz, F., Teel, L. D., Beutin, L., Pirard, D., Buvens,
G., Karch, H., Mellmann, A., Caprioli, A., Tozzoli,
R., Morabito, S., Strockbine, N. A., Melton-Celsa,
A. R., Sanchez, M., Persson, S., and O’Brien, A. D.
(2012). Multicenter evaluation of a sequence-based
protocol for subtyping shiga toxins and standardizing
stx nomenclature. Journal of clinical microbiology,
50(9):2951–2963.
Teeling, H. and Glckner, F. O. (2012). Current opportunities
and challenges in microbial metagenome analysis–a
bioinformatic perspective. Briefings in bioinformatics.
Vallenet, D., Belda, E., Calteau, A., Cruveiller, S., Enge-
len, S., Lajus, A., Le Fevre, F., Longin, C., Mor-
nico, D., Roche, D., Rouy, Z., Salvignol, G., Scarpelli,
C., Thil Smith, A. A., Weiman, M., and Medigue,
C. (2012). MicroScope–an integrated microbial re-
source for the curation and comparative analysis of
genomic and metabolic data. Nucleic Acids Research,
41(D1):D636–D647.
Wattam, A. R., Abraham, D., Dalay, O., Disz, T. L.,
Driscoll, T., Gabbard, J. L., Gillespie, J. J., Gough,
R., Hix, D., Kenyon, R., Machi, D., Mao, C., Nord-
berg, E. K., Olson, R., Overbeek, R., Pusch, G. D.,
Shukla, M., Schulman, J., Stevens, R. L., Sullivan,
D. E., Vonstein, V., Warren, A., Will, R., Wilson,
M. J., Yoo, H. S., Zhang, C., Zhang, Y., and Sobral,
B. W. (2013). PATRIC, the bacterial bioinformatics
database and analysis resource. Nucleic Acids Res.
BIOINFORMATICS2014-InternationalConferenceonBioinformaticsModels,MethodsandAlgorithms
48
